


Introduction
Obesity is becoming a more and more important public health problem as well as a worldwide pandemic. The main role of adipocytes is the site of energy storage to form of triacylglycerol during times when input exceeds consumption and to break down the stored lipid into free fatty acids when energy is needed. Obesity occurs when energy input persistently exceeds energy consumption, causing both hypertrophy and hyperplasia of adipocytes (Otto and Lane, 2005). Obesity is caused by an excessive accumulation of body fat, and it can adversely affect health. In fact, obesity is one of the main factors that cause many serious diseases such as insulin resistance, hyperlipidemia, hypertension, cardiovascular diseases (CVD), certain cancers, and type-2 diabetes (Haslam and James, 2005; Hirose et al., 2013).
Many research scientists have endeavored to define the transcriptional events regulating preadipocyte differentiation (adipogenesis) and adipocyte function for many years. The differentiation of preadipocytes into adipocytes is controlled by a sophisticated network of transcription factors that regulate the expression of many proteins that establish the mature giant cell phenotype (Farmer, 2006). The CCAAT/enhancer-binding protein (C/EBP) family (C/EBPα, β, and δ) and peroxisome proliferator-activated receptor γ (PPARγ) are the main transcription factors for adipocyte differentiation by being involved in the sequential expression of adipocyte-specific proteins (Gregoire et al., 1998; Rosen et al., 1999). PPARγ is a member of the nuclear receptor superfamily of transcription factors and is mainly expressed in adipose tissue (Tontonoz et al., 1994). C/EBPs are numbers of a diverse group of nuclear factors that contain leucine zipper domain; in particular, C/EBPα has a direct role to play in establishing the quiescent, terminally differentiated state of adipocyte (Cao et al., 1991; Samuelsson et al., 1991).
Although the relationship between obesity and probiotics has not been extensively studied, the beneficial effects of some probiotics or probiotic-containing food products on body weight control and metabolic diseases such as diabetes, hypertension, and hypercholesterolemia have been reported (Bhathena et al., 2009; Lee et al., 2007).
In this study, we sought to investigate the inhibitory effect of L. plantarum Q180 on adipocyte differentiation 3T3-L1, fat absorption, and reduction of adipocyte size in mice fed high-fat diet.
Materials and Methods
L. plantarum Q180 isolated from the feces of healthy adults: This strain was selected by screening for probiotic properties such as acid and bile tolerance, antibacterial activity, and antibiotic tolerance (Park et al., 2014). The culture was maintained in MRS broth (Difco, USA).
3T3-L1 cells were obtained from the American Type Culture Collection (ATCC, USA). According to the method of Hemati et al. (1997), 3T3-L1 cells were cultured in Dulbecco’s modified Eagle’s medium (DMEM; GIBCO) with high glucose content supplemented with 10% bovine calf serum (BCS; GIBCO) and 1% penicillin/streptomycin (Sigma, USA) at 37°C in a humidified atmosphere of 5% CO2. Before differentiation, MTT (3-(4,5-Dimethyl-2-thiazolyl)-2,5-diphenyl-2H-tetrazolium bromide) assay was performed as described by the modified method of Mosmann (1983) for the determination of strain concentration that does not have any cell toxicity. 3T3-L1 cells were seeded in a 96-well plate at a 1 × 10⁵ cells. After 24 h, the DMEM medium was exchanged with the same medium containing sample (10, 100, 200, 400, 800, and 1000 µg/mL). After 24 h, the 20 µL of 5 mg/mL MTT solution was added in each well, and the cell were incubated at 37°C for 4 h. The medium was removed and the cells lysed with dimethyl sulfoxide (DMSO). The amount of MTT formazan product formed was determined by measuring the absorbance at 550 nm. To induce differentiation, 2-day post-confluent cells (day 0) were stimulated for 2 days with an adipocyte differentiation cocktail medium containing 5 mM 3-isobutyl-1-methylxanthine (IBMX; Sigma, USA), 1 mM dexamethasone (Dex; Sigma, USA), and 5 μg/mL of insulin (Sigma, USA) in DMEM supplemented with 10% fetal bovine serum (FBS; GIBCO) and 1% penicillin/streptomycin. On day 2, the medium was replaced with DMEM containing 10% FBS, 1% penicillin/streptomycin, and 5 μg/mL of insulin, and incubated for 2 days, followed by culturing with DMEM containing 10% FBS and 1% penicillin/streptomycin for an additional 4 days (day 8) at the end of which more than 90% of the cells were changed into mature adipocytes with accumulated fat droplets. To examine the effect of L. plantarum Q180 on the differentiation of preadipocytes into adipocytes, the cells were treated with various concentrations of sample on day 0 and day 2. For sample preparation, the culturing L. plantarum Q180 in MRS broth were harvested in a refrigerated centrifuge (1,500 g for 15 min at 4℃) and washed three times with distilled water to remove the MRS broth. The washed L. plantarum Q180 was freeze-dried and resuspended in distilled water at a concentration of 10 mg/mL, homogenized using a sonicator for 50 s, followed by a 1 min interval (repeated three times). The 3T3-L1 cells were treated with different concentration of supernatant, i.e., 0, 10, 100, 200, 400 μg/mL. Quantified lipid accumulation was measured using oil red O (Sigma) described method by Ramirez-Zacarias et al. (1992).
Western blot analysis of the cultured 3T3-L1 cells was performed based on the modified method previously described by Rhyu et al. (2014). Mature 3T3-L1 adipocytes treated with L. plantarum Q180 were harvested, and cell pellets were washed and resuspended in PBS. After centrifugation, cells were resuspended in RIPA buffer (50mM Tris–HCl, 150 mM NaCl, 1% (v/v) Nonidet-P40, 0.5% (w/v) sodium deoxycholate, 0.1% (w/v) SDS, 1 mM Na3VO4, 10 μg/mL leupeptin, 50 mM NaF, and 1 mM phenylmethanesulfonyl fluoride, pH 8.0) containing protease inhibitor, and cell lysis was performed at 4℃ for 30 min with vigorous shaking. Cell lysates were then centrifuged at 22,000 g for 25 min at 4℃, and supernatants were stored at -70℃ until the western blot analysis. Protein concentration was determined using the Bradford method (Bradford, 1976). Protein samples (40 μg protein per well) were electrophoresed on 12% SDS-polyacrylamide gels. Cellular proteins were then transferred onto a polyvinylidene difluoride (PVDF) membrane blocked with 5% non-fat dried milk in TBS-T buffer (10 mM Tris-HCl, 150 mM NaCl, and 0.06% Tween-20, pH 8.0) for 30 min at room temperature. Next, the blots were incubated overnight with primary antibodies [C/EBPα, PPARγ, and β-actin (Santa Cruz Biotechnology, USA)] at 4℃. After three washes with TBS-T buffer, the blots were incubated with the secondary antibody for 2 h at room temperature. Horseradish peroxidase was used as secondary antibody. And then, the bolts were washed three times with TBS-T buffer, and incubated with ECL substrate solution (Amersham Biosciences, UK) according to the instruction manual. Stained protein bands were visualized using a ChemiDoc XRS System (Bio-Rad Laboratories, USA), and protein expression was quantified using image J software (National Institute of Health, USA).
Male C57BL/6J mice (male, 6 weeks old, n=18) were purchased from DooYeol Biotech (Korea). All of the mice were housed individually in standard mouse cages measuring 33 × 20 × 19 cm (W × D × H) and containing 1 cm of sawdust under constant temperature and humidity (20 ± 2°C, 55 ± 10%), with a 12 h light/dark cycle. After acclimatization for 1 week on a normal chow diet, they were divided into three groups of six mice based on their body weights (23.2 ± 0.7 kg). The mice were fed either a high-fat diet (HFD; n=12) or a normal diet (ND; n= 6) for 6 weeks. In calorific terms, the high-fat diet contained of 34.3% fat, 27.3% carbohydrate, and 34.3% protein (5.1 kcal/g), whereas the normal diet consisted 4.2% fat, 64.7% carbohydrate, and 18.6% protein (3.7 kcal/g). The compositions of HFD and ND are given in Table 1. The groups of mice were fed as follows: the ND group was fed a normal diet and an orally administered saline solution; the HFD group, a high fat diet and an orally administered saline solution; and the HFD+Q180 group, a high fat diet and an orally administered L. plantarum Q180 (109 CFU/day) in saline solution. Food and water were freely available, and L. plantarum Q180 in saline solution or only saline solution was orally administered once a day for six weeks (2.5 µg/g body weight). L. plantarum Q180 was suspended in sterilized saline immediately prior to oral administration to the mice. Body weight was measured once a week. After 6 weeks, the mice were anesthetized with diethyl ether after 12 h of fasting. The epididymal fat pads, liver, spleen, and kidneys of the mice were quickly isolated after they were sacrificed and weighed. All animal experimentations were performed after obtaining approval from Institutional Animal Care and Use Committee of Korea Food Research Institute (KFRI-M-181).
At the end of the 6-wk experimental period, blood samples were collected from all the rats (taken from the eyes) and immediately placed in sterile tubes. Serum was collected by centrifugation at 2,000 g for 15 min at 4℃. The serum samples were analyzed for total cholesterol (TC), triglyceride (TG), aspartate transaminase (AST) and alanine transaminase (ALT) activity concentration by Green Cross (Korea).
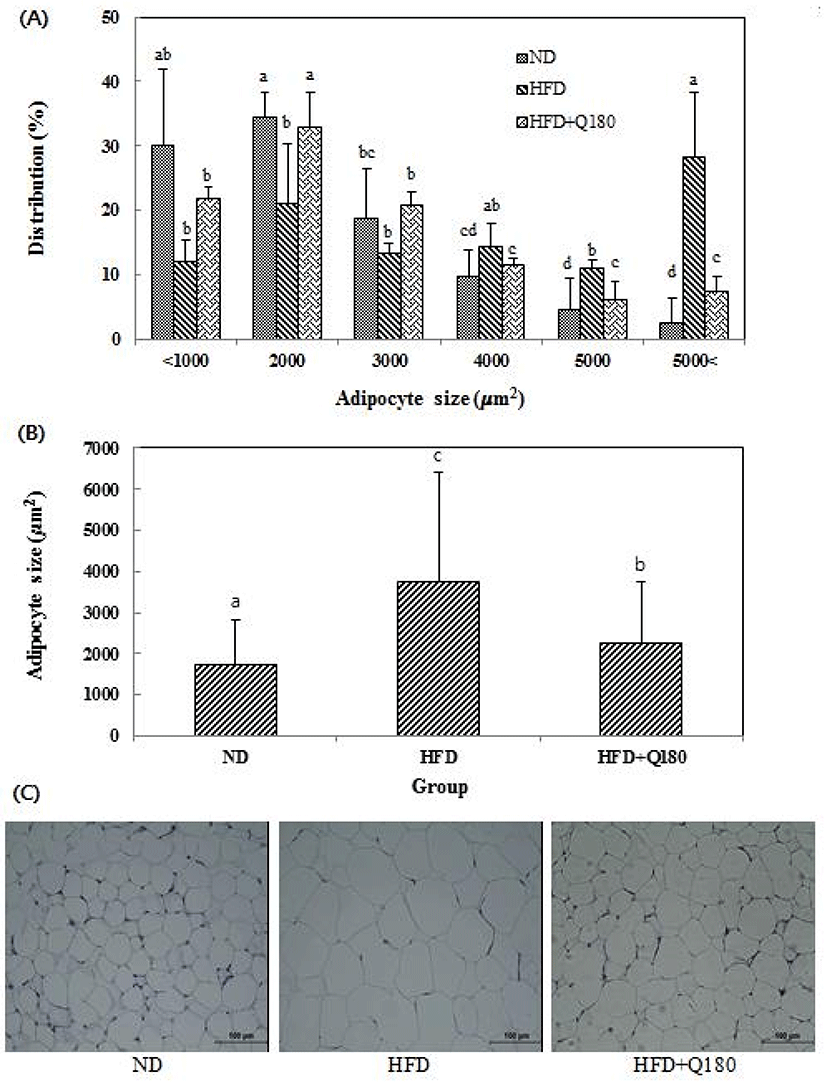
After the animals were sacrificed, the both side epididymal fat pads were quickly collected. Epididymal fat pads were fixed with 10% formaldehyde. According to the method of Hirsch and Gallian (1968), samples were filtered using a 250-µm nylon filter and washed completely with PBS. And, then the filtrate was filtered using a 25-µm nylon filter to trap fixed adipocytes, and the cells were washed completely with PBS. Cell suspensions were applied to glass slides and then stained with hematoxylin and eosin solutions (H&E staining) according to previously described method by van Goor et al. (1986). The cells on the glass slides were observed with a microscope, and the adipocyte size was measured using Image J Software (National Institute of Health, USA).
The results were expressed as mean ± standard deviation (SD). Statistical analysis was performed with a statistical analysis system (SAS version 9.0, SAS Institute, Inc., NC, USA). The significance of the differences was analyzed by conducting a one-way analysis of variance (ANOVA) using Duncan’s multiple range tests. Significance was considered at p<0.05.
Results and Discussion
According to the result of the MTT assay, L. plantarum Q180 did not have any cell toxicity in the 3T3-L1 cell line up to a concentration of 400 µg/mL (Fig. 1). Fig. 2 shows that an 8-day treatment at various concentrations (0, 10, 100, 200, 400 µg/mL) of L. plantarum Q180 during the differentiation period inhibited adipogenesis in 3T3-L1 significantly and in a dose-dependent manner in terms of lipid accumulation compared with the control cells. Among the tested concentrations of L. plantarum Q180, 400 µg/mL was the most effective concentration in reducing the lipid accumulation in differentiated cells (by 18.47 ± 0.32% compared with the control cells). We carried out western blotting analysis to determine whether L. plantarum Q180 inhibited adipocyte differentiation by negatively controlling the expression of C/EBPα and PPARγ, the key transcriptional regulators. L. plantarum Q180 significantly inhibited the protein expression of C/EBPα and PPARγ (p<0.05). As shown in Fig. 3, the expression levels of C/EBPα and PPARγ in 3T3-L1 adipocyte treated with 400 µg/mL of L. plantarum Q180 were significantly reduced by 35.16% and 40.07%, respectively, relative to the levels in the control. The intense of obesity is closely related to the degree of differentiation of preadipocytes to adipocytes and the enlargement of adipocytes in adipose tissues (Wang and Jones, 2004). During adipocyte differentiation, among many kinds of transcriptional activators, C/EBPα and PPARγ play a main role in coordinating the adipocyte gene expression (Guo and Liao, 2000). According to Park et al. (2011), KY1032-CE was obtained by lysing L. plantarum KY1032 isolated from kimchi suspended in PBS 1010 CFU/mL and subsequently used to treat 3T3-L1 preadipocytes during the adipogenic phase. After treatment with KY1032-CE at 0.01% and 0.1%, lipid accumulation decreased by 11 ± 3.6% (p<0.01) and 30.6 ± 9.2% (p<0.001), respectively. Furthermore, KY1032-CE treatment led to a decrease in C/EBPα and PPARγ expression by 23 ± 8.2% and 28.3 ± 5.1% (p<0.001), respectively. The inhibitory effect on the 3T3-L1 adipocyte differentiation of KY1032-CE was higher than that of L. plantarum Q180. Note, however, that the concentration of KY1032-CE treatment during cell differentiation was higher than that of L. plantarum Q180. Moreover, the expression levels of C/EBPα and PPARγ were lower in 3T3-L1 adipocyte treated with L. plantarum Q180 than in the cell treated with KY1032-CE. Moon et al. (2012) reported that W. koreensis OK1-6, the strain isolated from kimchi and cultured in MRS broth with 1% arginine added, reduced lipid accumulation by 32% and 28% of the control in 3T3-L1 adipocyte. Moreover, the strain significantly reduced the mRNA expression levels of C/EBPα compared with the untreated cell but did not reduce the PPARγ levels.
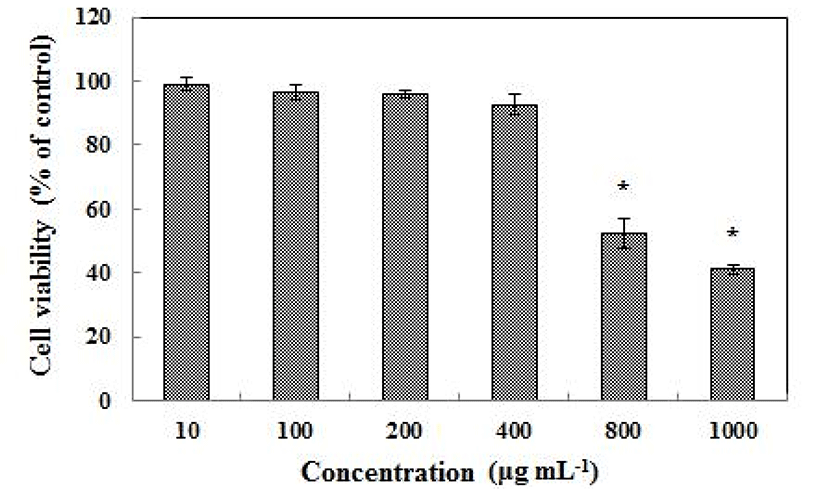
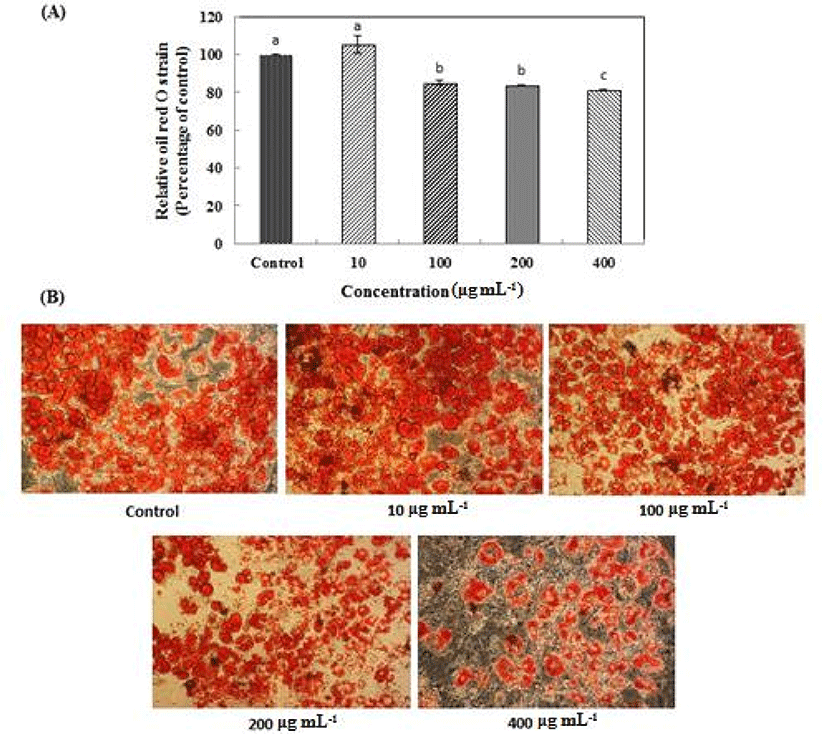
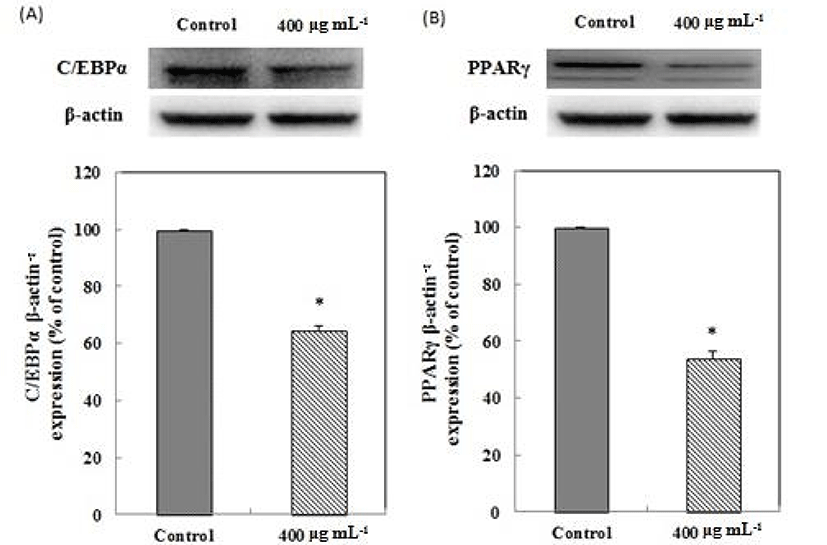
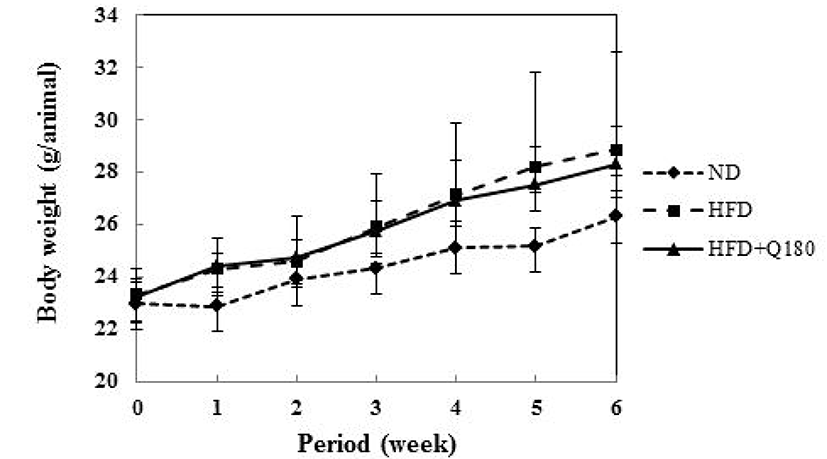
Fig. 4 and Table 2 shows the changes in body weight of the groups during the experiment. After six weeks, the body weight of the HFD group was observed to increase 25.94% on average, whereas that of the HFD+Q180 group increased by 21.87% on average. The rate of increase in body weight was 13.7% lower in the HFD+Q180 group compared with the HFD group, although the HFD+Q180 mice still gained more weight than the mice fed with the ND. However, no significant differences in body weight gains were observed among the groups. This increase in body weight appears to be associated with an increase in the weight of the epididymal fat pads of the mice (Table 3). The ND group showed the lowest epididymal fat weights (0.31 ± 0.05), whereas the HFD group showed the highest epididymal fat weights (0.81 ± 0.41). The HFD+Q180 group showed a decrease in epididymal fat weight (0.65 ± 0.23) than the HFD group. However, there were no significant differences between the groups, except the ND group, and no there were no significant differences between the groups regarding the weights of the liver, kidneys and spleen. C57BL/6J mice were fed on three different diets for six weeks. After six weeks, the rate of increase of body weight was 13.7% lower in the HFD+Q180 group compared with the HFD group (Fig. 4). In addition, the size of adipocyte cells taken from epididymal adipose tissues in mouse fed L. plantarum Q180 was found to decrease (Fig. 5). According to the report of An et al. (2011), Sprague-Dawley (SD) rats were fed on three different diets (i.e., an SD group fed a standard diet and PBS; an HFD group fed an HFD and PBS; and an HFD+LAB group fed an HFD and LAB [B. pseudocatenulatum SPM 1204, B. longum SPM 1205 and B. longum SPM 1207; 1:1:1 ratio]). After seven weeks, the body weight of the HFD group was observed to increase by 9.53% compared to the SD group, while that of the HFD+LAB group increased by 7.01% compared with the SD group. The body weight was decreased by 2.70% of the HFD+LAB group than on the HFD group. The tendency towards an increase in body weight in that study is similar to the findings of our study.
| ND1) | HFD | HFD + Q180 | |
|---|---|---|---|
| Body weight gain (g) | 3.33 ± 0.51NS3) | 6.12 ± 3.14 | 5.07 ± 1.26 |
| Food efficiency ratio2) | 0.027 ± 0.003NS | 0.040 ± 0.006 | 0.036 ± 0.011 |
All values are the mean ± SD (n=6).
1)ND, normal diet; HFD, high fat diet with saline solution; HFD+Q180, high fat diet with L. plantarum Q180 (109 CFU/day).
2)Food efficiency ratio = total body weight gain/total food intake.
3)NSValues in a row are not significantly different at p<0.05.
All values are the mean ± SD (n=6).
1)ND, normal diet; HFD, high fat diet with saline solution; HFD+Q180, high fat diet with L. plantarum Q180 (109 CFU/day).
2) NSValues in a row are not significantly different at p<0.05.
3) a,bMeans in a row with difference letters are significantly differences (p<0.05).
The blood serum levels are shown in Table 4. No significant differences were observed in the levels of TC, ALT and AST between the HFD group and HFD+Q180 group. TG concentration of the HFD group showed a significantly increase, however, serum TG concentration of the HFD+Q180 group was significantly decreased than that of the HFD group (p<0.05). The effect of lowering TG concentration of the HFD+Q180 group without affecting the structure and relative weight of the liver compared with ND group may not be due to a redistribution of lipids from the plasma to the liver, but rather to decreased intestinal absorption of lipids or increased lipid catabolism (Taranto et al., 1998). ALT and AST levels are commonly used for the indicator for diagnosis of the liver damage. ALT activities in HFD group was found to be significantly increased than ND group (p<0.05). ALT level of HFD group was increased by 2.61 folds compared with ND group. The ALT level of the HFD+Q180 group was decreased than that of the HFD group, but the difference was not significant.
All values are the mean ± SD (n=6).
1)ND, normal diet; HFD, high fat diet with saline solution; HFD+Q180, high fat diet with L. plantarum Q180 (109 CFU/day).
2)a,bMeans within a row with difference letters are significantly differences (p<0.05).
3)NSValues in a row are not significantly different at p<0.05.
The comparison of adipocyte size of epididymal fat pads between mice groups in shown in Fig. 4. The epididymal fat pads of the mice were quickly isolated and the adipocyte size was observed and measured. In the ND group, which was the control group, the ratio of 2000 µm2 of adipocyte was higher than in the other size of adipocyte. In the HFD+Q180 group, fed HFD and orally administered L. plantarum Q180 (109 CFU day-1), the ratio of 2000 µm2 of adipocyte was also higher than in the other size of adipocyte. Note, however, that the ratio of over 5000 µm2 of adipocyte was highest in the HFD group, or the control group fed HFD. In addition, the average adipocyte size of the HFD group was found to be higher than that of the other groups. In the photograph of the epididymal fat pads in the mouse, it could also be seen that the adipocyte size of the HFD+Q180 group was smaller than that of the HFD group. The effects of certain lactobacillus and Bifidobacterium on reducing the adipocyte size in the HFD-fed mouse model have been reported in some papers. According to the report of Li et al. (2016), adipocyte sizes in mice administered four kinds of probiotic bacteria (L. casei, L. acidophilus, B. bifidus BGN4, and B. longum BORI) as supplement were significantly smaller than those in the HFD group. Takemura et al. (2010) also reported that the average adipocyte size was significantly lower in the L. plantarum strain No.14 administered mice than in the vehicle-administered mice. That is because the strains have the effect that reduced fat storage by the inhibition of dietary fat absorption (Hamad et al., 2009). Thus, the results suggest that L. plantarum Q180 may have a beneficial effect on obesity by inhibiting of differentiation of 3T3-L1 adipocyte and reducing the size of the adipocyte cells.
Conclusion
This study aimed to investigate the anti-obesity effects of L. plantarum Q180 through the inhibition of 3T3-L1 adipocyte differentiation, fat absorption and reduction of adipocyte size in diet-induced obese mice for application to functional food products that help improve obesity. L. plantarum Q180 inhibited the adipocyte differentiation of 3T3-L1 cells (18.47 ± 0.32%) at a concentration of 400 µg mL-1 (108 CFU/g). Also, the expression levels of C/EBPα and PPARγ in 3T3-L1 adipocyte treated with 400 µg/mL of L. plantarum Q180 decreased 35.16% and 40.07%, respectively, compared with the control. In the animal test, after six weeks, the rate of increase of body weight was 13.7% lower in the group feed HFD and orally administered L. plantarum Q180 compared to the HFD group. In addition, the epididymal fat weights of the HFD+Q180 group were lower than that of the HFD group. The change of adipocyte size was measured in diet-induced obese mice. Consequently, the number of large-size adipose tissue was less distributed in the ND and HFD+Q180 groups than in the HFD group. In conclusion, the L. plantarum Q180 strain is shown to have the inhibition of 3T3-L1 adipocyte differentiation via down-regulation of C/EBPα and PPARγ, fat absorption and reduction of adipocyte size in diet-induced obese mice and it has the potential to be applied to functional food products that help improve obesity as probiotics.