


Introduction
Obesity is a serious medical condition in which excess body fat accumulates to the extent that it may have a negative effect on health, leading to reduced life expectancy and/or increased health problems (Kopelman, 2000; Plessis et al., 2010). Obesity causes various kinds of metabolic syndrome such as diabetes, insulin resistance, hypertension, arteriosclerosis, cardiovascular diseases, type-2 diabetes, certain cancers, and sleep apnea/sleep-disordered breathing (Haslam and James, 2005; Hirose et al., 2013).
Most probiotic products such as yogurts contain lactic acid bacteria (Adolfsson et al., 2004). Each type of lactic acid bacteria has individual characteristics and various health effects such as stimulation of the immune system and stabilization of gut microflora (Axelsson, 1998; Gibson et al., 1997; Parvez et al., 2006; Perdigon et al., 1995). Recently, the anti-obesity effect of probiotics has attracted the attention of the public (Pereira and Gibson, 2002; Usman and Hosono, 2000). Although the relationship between probiotics and obesity has not been extensively studied, additional beneficial effects of some probiotics or food products containing probiotics on bodyweight control and metabolic disorders related with obesity have been reported recently (Bhathena et al., 2009; Lee et al., 2007; Lye et al., 2009).
Obesity is associated with an increase in the size and amount of adipose tissue (Cani et al., 2007). Adipose tissue secretes a number of signaling molecules commonly referred to as adipocytokines (Koerner et al., 2005). Leptin and adiponectin are the important adipocytokines produced by adipocytes.
In this study, we investigated the effects of yogurt fermented by Lactobabacillus plantarum Q180 on bodyweight, serum lipid, adipocytokine concentrations and adipocyte size in the epididymal fat pad of rats with a view to developing new functional food products.
Materials and Methods
Lactobacillus plantarum Q180 was isolated from the feces of healthy adults. In several in vitro studies, it was demonstrated that the strain has potential as a probiotic with anti-obesity effects (Park, 2014). The culture was maintained in MRS broth (Difco, USA). ABT-3, a commercial probiotic start culture obtained from Chr. Hansen’s Laboratory (Denmark), was used for lowering pH of the yogurt because of slow acid production rate of Lactobacillus plantarum Q180. Also, to increasing of antiobesity effect, Garcinia cambogia was added in some of yogurts.
Male Sprague-Dawley rats aged 7 wk were purchased from Hanlim Animal Co. (Korea). All of the rats were individually housed at constant temperature and humidity (20±2℃, 55±5%) under a 12 h light/dark cycle. After acclimatization for 1 wk on a normal chow diet, they were then randomized according to their bodyweights and divided into six groups of six rats. The rats were fed either a high-fat diet (HFD; n=30) or a normal diet (ND; n=6) for 8 wk. In calorific terms, the high-fat diet consisted of 34.3% fat, 27.3% carbohydrate, and 34.3% protein (5.1 kcal/g), whereas the normal diet contained 4.2% fat, 64.7% carbohydrate, and 18.6% protein (3.7 kcal/g). The compositions of HFD and ND are shown in Table 1. The group of rats were fed as follows: Group A was fed an ND and orally administrated saline solution; Group B, an HFD and orally administrated saline solution; Group C, an HFD and orally administrated yogurt fermented by ABT-3, a commercial probiotic start culture obtained from Chr. Hansen’s Laboratory (Denmark), and L. plantarum Q180; Group D, an HFD and orally administrated yogurt with added extract of Garcinia cambogia, a plant popularly used as an ingredient of dietary supplements for weight loss (Saito et al., 2005), and fermented by ABT-3 and L. plantarum Q180; Group E, an HFD and orally administrated yogurt fermented by L. plantarum Q180; and Group F, an HFD and orally administrated yogurt with added Garcinia cambogia extract, and fermented by L. plantarum Q180. Food and water were freely available. Yogurt or only saline solution was orally administrated once a day for eight weeks (1 mL/200 g bodyweight of rat). Each yogurt was fermented by 1% of probiotics for 18 h at 37℃. To the yogurt for groups D and F was added 0.15% Garcinia cambogia extract. After fermentation, the amount of lactic acid bacteria in the yogurt was over 109 CFU/mL. Bodyweight and food intake were measured once a week. Before being sacrificed, the rat were fasted for 12 h and anesthetized with diethyl ether. All animal experimentation was performed after obtaining the approval of the Institutional Animal Care and Use Committee (IACUC) of Seoul National University College of Medicine.
At the end of the 8-wk experimental period, blood samples were collected from all the rats (taken from the eyes) and immediately placed in sterile tubes. Serum was collected by centrifugation at 2000 × g for 15 min at 4℃. The serum samples were analyzed for total cholesterol (TC), triglyceride (TG) concentration, total protein, glucose, aspartate transaminase (AST) and alanine transaminase (ALT) activity by Green Cross (Korea). Serum adiponectin and leptin concentrations were measured using a quantikine ELISA kit (R&D system, USA). The detection ranges of adiponectin and leptin were 0.062-4 ng/mL and 0.156-10 ng/mL, respectively. Also, the rats’ epididymal fat pads, visceral fat, kidney fat, liver, spleen, and kidney were quickly isolated after the sacrifice and weighed.
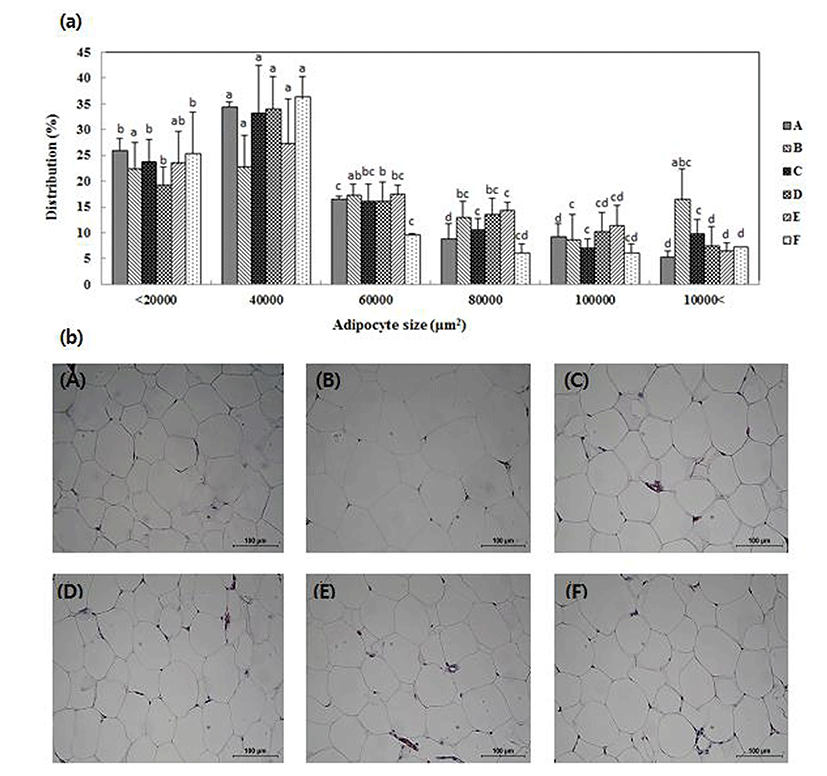
The left and right epididymal fat pads were quickly isolated after the animals were sacrificed, and fixed in 10% formaldehyde solution. According to the method of Hirsch and Gallian (1968), the samples were passed through a 250-m nylon filter in order to remove fibrous tissue and intact shreds of fixed adipose tissue. The tissue shreds were flushed thoroughly with PBS. The filtrate was then passed through a 25-m nylon filter to trap fixed adipocytes, and the cells were washed thoroughly with PBS. Cell suspensions were applied to glass slides and then stained with hematoxylin and eosin solutions (H&E staining), as previously described (van Goor et al., 1986). The cells on the glass slides were observed with a microscope and the size of the adipocytes was measured using Image J Software (National Institute of Health, USA).
The results are expressed as the mean±standard deviation (SD). Statistical analysis was performed with a statistical analysis system (SAS, SAS Institute Inc., USA). The significance of the differences was analyzed by conducting a one-way analysis of variance (ANOVA) with Duncan’s multiple range tests. Values of p<0.05 were considered statistically significant.
Results and Discussion
Fig. 1 and Table 2 show the changes in bodyweight and food intake of the groups during the experiment. After eight weeks, group B’s bodyweight increased by 23.96 percent, whereas the bodyweight of groups C, D, E and F increased by 17.59, 15.91, 19.79 and 10.56 percent, respectively. Notably, the rate of increase in bodyweight was 10.81 percent lower in group F compared with group B. However, there were no significant differences in bodyweight gains between B group and the other groups fed with yogurt fermented by probiotics. Also, no significant differences in food efficiency ratio (FER) were observed for the groups fed with yogurt fermented by probiotics in comparison with group B.
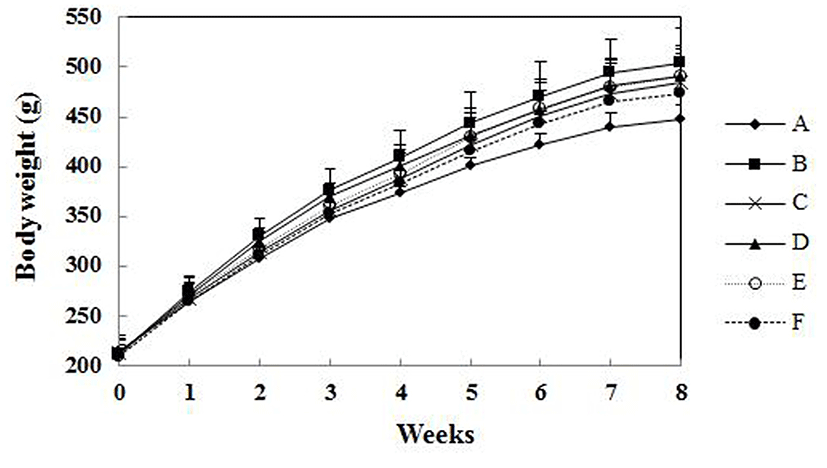
1)A, normal diet; B, high-fat diet; C, high-fat diet with yogurt fermented by ABT-3 and L. plantarum Q180; D, high-fat diet with yogurt with added Garcinia cambogia extract and fermented by ABT-3 and L. plantarum Q180; E, high-fat diet with yogurt fermented by L. plantarum Q180; F, high-fat diet with yogurt added Garcinia cambogia extract and fermented by L. plantarum Q180.
2)Weight gain rate compared to ND group (group A)
3Weight loss rate compared to HFD group (group B)
4)FER: Food efficiency ratio, Wt. gain(g)/Food intake(g) × 100
Values are the mean±SD of 6 rats per group.
a-dMeans with the same letter within the same line are not significantly different (p<0.05).
Organ weights and fat weights are shown in Table 3. There were no significant differences in the liver, kidney, spleen, and kidney fat weight between group B and the other groups fed with yogurt fermented by probiotics. However, epididymal fat weights were reduced in the groups fed yogurt fermented by probiotics. The epididymal fat weights of groups E and F (9.44±2.08 g and 9.02±2.26 g, respectively) were significantly lower than that of B group (12.33±2.71 g). It was also reduced in groups C and D (9.89±2.09 g and 9.80±1.58 g, respectively), but no significant differences in group B were observed. The visceral fat weights in groups C, D, E and F (3.97±0.99 g, 3.59±0.86 g, 3.61±1.25 g and 3.46±0.95 g, respectively) were lower than that of group B (4.63±0.83 g). However, no significant differences were observed between the groups, except for group A. According to the results, with the exception of group A, the mean values of the fat weights (epididymal, visceral and kidney fat) of group F were generally the lowest.
1)A, normal diet; B, high-fat diet; C, high-fat diet with yogurt fermented by ABT-3 and L. plantarum Q180; D, high-fat diet with yogurt with added Garcinia cambogia extract and fermented by ABT-3 and L. plantarum Q180; E, high-fat diet with yogurt fermented by L. plantarum Q180; F, high-fat diet with yogurt with added Garcinia cambogia extract and fermented by L. plantarum Q180.
Values are the mean±SD of 6 rats per group.
a-c Means with the same letter within the same row are not significantly different (p<0.05).
In another study, SD rats were fed on two different diets, as follows: the Control group was fed a high-carbohydrate diet and administered PBS; BNR17 was fed a high-carbohydrate diet and administered Lactobabillus gasseri BNR17 isolated from breast milk. PBS and the probiotics orally administered twice a day. After twelve weeks, the average bodyweight was 9.58 percent lower in the BNR group compared to the control group. In addition, the weights of the mesenteric fat pads, perirenal fat pads, and epididymal fat pads were lower in the BNR group compared to the control group (Kang et al., 2010). The tendency toward weight increase in that study is similar to the findings of our study.
The blood serum levels are shown in Tables 4 and 5. No significant differences were observed in the levels of TC, HDL-C, LDL-C, total protein, glucose and ALT between group B, the HFD control group, and the other groups fed with yogurt fermented by probiotics. However, the TG level of the groups fed with yogurt fermented by probiotics was lower than that of the HFD control group, which suggests that probiotics help to reduce the accumulation of triglyceride in rats. The AST level was lower in group C than in the other groups. It was also lower in groups D, E and F than in the control group, although no significant differences were observed. The level of adiponectin, a physiologically active polypeptide hormone secreted by adipose tissue, did not show a significant difference between groups. However, the average value of the adiponectin level in groups A, C, E and F was higher than that of group B. Generally, the amount of diponectin is reduced in obese and diabetic mice, and the plasma levels of adiponectin are lower in obese than lean humans (Arita et al., 1999; Hu et al., 1996). The level of leptin, a hormone produced predominantly in adipocytes, was significantly reduced in groups A, C, D, E and F compared with group B. Unlike adiponectin, plasma leptin concentrations are generally higher in obese than lean humans or mice (Considine et al, 1996; Frederich et al. 1995).
1)A, normal diet; B, high-fat diet; C, high fat-diet with yogurt fermented by ABT-3 and L. plantarum Q180; D, high-fat diet with yogurt with added Garcinia cambogia extract and fermented by ABT-3 and L. plantarum Q180; E, high-fat diet with yogurt fermented by L. plantarum Q180; F, high-fat diet with yogurt with added Garcinia cambogia extract and fermented by L. plantarum Q180.
Values are the mean±SD of 6 rats per group.
a-c Means with the same letter within the same line are not significantly different (p<0.05).
| A | B | C | D | E | F | |
|---|---|---|---|---|---|---|
| adiponectin (ng/mL) | 3.26±0.55a | 2.99±0.39a | 3.10±0.24a | 2.83±0.32a | 3.04±0.58a | 3.25±0.84a |
| leptin (pg/mL) | 315.05±20.71c | 532.76±135.92a | 426.55±46.14b | 408.16±61.19b | 426.61±64.87b | 413.76±42.19b |
1)A, normal diet; B, high-fat diet; C, high-fat diet with yogurt fermented by ABT-3 and L. plantarum Q180; D, high-fat diet with yogurt with added Garcinia cambogia extract and fermented by ABT-3 and L. plantarum Q180; E, high-fat diet with yogurt fermented by L. plantarum Q180; F, high-fat diet with yogurt with added Garcinia cambogia extract and fermented by L. plantarum Q180.
Values are the mean±SD of 6 rats per group.
a-cMeans with the same letter within the same line are not significantly different (p<0.05).
The epididymal fat pads of the rat were quickly isolated and the adipocyte size was observed and measured. Each cell was photographed on the microscope five times and the adipocyte size was measured using Image J Software. The distribution of various sizes of adipocytes and a picture of adipocytes are shown in Fig. 2. Large adipocytes were more distributed in group B than in the other groups; whereas small adipocytes were relatively more distributed in groups A, C, D, E and F. In many previous studies, it has been demonstrated that an increase in the size of adipocyte cells is associated with obesity (Guo et al., 2004; Weisberg et al., 2003). Meanwhile, a decrease in the size of adipocytes is considered to help in preventing obesity due to the inhibition of hypertrophy and hyperplasia (Cariou et al. 2006; Faust, 1984). Furthermore, Marques et al. (1998) suggested that enlarged adipocytes secrete growth factors that trigger adipogenesis through preadipocyte differentiation. According to Sato et al. (2008), they measured the size of adipocytes in SD rats fed on a diet containing skimmed milk fermented by Lactobacillus gasseri SBT2055 for 4 wk, and observed a significant reduction in the size of the rats’ adipocytes, as well as in increase in the number of small adipocytes. Therefore, they suggested that the fermented milk product containing L. gasseri SBT2055 may have a beneficial effect on the onset of obesity by influencing the size of the cells from visceral adipose tissues. Thus, the results of our study indicate that L. plantarum Q180 has an anti-obesity effect because the size of the cells taken from epididymal adipose tissues was observed to decrease.
Conclusion
Bodyweight gain was reduced in diet-induced SD rats treated with yogurt fermented by Lactobacillus plantarum Q180. Compared with the HFD control group, the rate of increase in the bodyweight of group F, the rats fed with yogurt with added Garcinia cambogia extract and fermented by L. plantarum Q180, was the lowest, being some 10.81% lower than that of the HFD control group. The epididymal fat weight of groups E and F was also significantly lower than that of the HFD control group. Furthermore, he amounts of triglyceride and leptin were significantly reduced in groups C, D, E and F compared to the HFD control group. In addition, the percentage of large-size adipose tissue was less distributed in groups A, C, D, E and F than in the HFD control group. When used only L. plantarum Q180 for yogurt fermentation, there was small effects in bodyweight lose compare with other groups except control group. It seems because the growth rate of L. plantarum Q180 was slower than commercial strain. However, the decrease effect of fat weight and TG and the increase effect of HDL level were good in group E, the rats fed with yogurt fermented by L. plantarum Q180. Taken together, these findings suggest that yogurt fermented by Lactobacillus plantarum Q180 might prevent obesity, at least in rats. In particular, the anti-obesity effect was greatest when the rats were fed with yogurt with added Garcinia cambogia extract and fermented by L. plantarum Q180.