Introduction
Benzoic acid is used as a food preservative in various products owing to its antioxidant and antimicrobial activity to prevent spoilage by enzymes, oxidation, or microorganisms (Dong and Wang, 2006; Pan et al., 2005). Benzoic acid is generally recognized as safe; however, adverse effects related to allergic reactions, such as asthma, urticarial, metabolic acidosis, and convulsions, have been reported in sensitive individuals (Qi et al., 2009; Safford et al., 1990). Therefore, it is important to determine the levels of benzoic acid in food for both quality assurance and food safety purposes (Shan et al., 2008). These preservatives are allowed by legislation that establishes the maximum permitted concentrations in each type of food. The excessive addition of these preservatives to food products could be harmful to human health (Dong and Wang, 2006; Javanmardi et al., 2015). The addition of benzoic acid to yogurt is not allowed, and the amount of benzoic acid in yogurt should not exceed 50 mg/kg (Cakir and Cagri-Mehmetoglu, 2013; Choi et al., 2008; Hejtmankova et al., 2000). The Joint FAO/WHO Expert Committee on Food Additives (JECFA) (WHO, 2000) has established acceptable daily intakes of 0-5 mg/kg body weight for benzoic acid.
The concentrations of benzoic acid in milk and yogurt are typically 2-5 mg/kg and up to 50 mg/kg, respectively (Urbiene and Leskauskaite, 2006). As lactic acid bacteria grows, lactic, acetic, and propionic acid increase and hippuric, orotic, and citric acid decrease (Urbiene and Leskauskaite, 2006). Benzoic acid is produced via lactic acid bacterium- mediated enzymatic conversion of hippuric acid, which is naturally present in milk; degradation of phenylalanine; and auto-oxidation of benzaldehyde (Sieber et al., 1995; Urbiene and Leskauskaite, 2006). Additionally, benzoic acid can be produced by β-oxidation in the catabolism of fatty acids in bacterial cells (Hertweck et al., 2001). These processes and results are depending on the fermentation starter and milk type (Horníèková et al., 2014). Strains that are known to produce benzoic acid in milk include Lactococcus lactis, Lactobacillus casei, Streptococcus thermophilus, Lactobacillus helveticus, Escherichia coli, and Pseudomonas fluorescens (Garmiene et al., 2010; Sajko et al., 1984). The benzoic acid in fermented milk is detected immediately after the inoculation of the starter culture in the fermentation stage at 2.28-10.48 mg/kg (Lim et al., 2013).
Benzoic acid production has been studied for various starter cultures and incubation temperatures (Lim et al., 2013; Urbiene and Leskauskaite, 2006). However, the optimization of benzoic acid production has not been reported. Therefore, the objective of this study was determining the optimized benzoic acid production with respect to starter culture and incubation temperature using response surface methodology (RSM) in a range of regulation.
Materials and Methods
Benzoic acid, tetrabutyl ammonium hydroxide solution, cetyltrimethyl ammonium chloride, hydrogen chloride, and sodium hydroxide were purchased from Sigma-Aldrich (USA). Commercially available milk (Maeil Dairy Co., Korea) was used for yogurt preparation. All solvents were analyzed as high-performance liquid chromatography (HPLC) grade (J. T. Baker, USA).
Yogurt was prepared as described by Donkor et al. (2007), with a few modifications. The reconstituted milk was standardized with milk and skim milk powder (SNF value, 11%). The yogurt base was prepared by heating at 85℃ for 30 min, and followed by cooling to 45℃. The starter strains were Streptococcus thermophilus, Lactobacillus acidophilus, L. delbrueckii subsp. bulgaricus, L. rhamnosus, L. casei, L. paracasei, L. reuteri, L. plantarum, Bifidobacterium longum, B. lactis, B. bifidum, B. infantis, and B. breve. These strains were purchased from Chr. Hansen (Denmark). The starter was aseptically inoculated (inoculation ratio, 0.02% w/v), and the inoculated milk was incubated at 37℃, 42℃, and 45℃ until pH of 4.5±0.1 was reached. Manufactured yogurt was used for analysis directly.
The pH was determined using a pH meter (VTW, Germany). The bacterial cell count was determined using the plate counting method described by Dave and Shah (1996) and Korean Food Standards Codex (KFDA, 2015). Sampled yogurt was diluted using 0.1% peptone water, and spread on BCP (Bromocresol purple) plate count agar (Eiken chemical, Japan). The plates were incubated at 42℃ for 48 h, and the cell number was counted.
The benzoic acid analysis was performed according to the methods of Korean Food Standards Codex (KFDA, 2015). Methanol (10 mL) and 0.005 M CTA solution (10 mL) were loaded on a Sep-Pak C18® cartridge sequentially at a 2 mL/min flow rate. Yogurt samples (5 g) were diluted in 25 mL of water, and 5 mL of diluent was obtained and mixed with 1 N HCl (0.5 mL) and 0.005 M CTA solution (0.5 mL). The diluent yogurt sample was injected, and H2O (10 mL) and methanol (10 mL) were added to the activated Sep-Pak C18® cartridge. The obtained sample was filtered by using a 0.45-μm cellulose acetate filter and used for the benzoic acid analysis.
Benzoic acid was quantified with HPLC analysis (Agilent 1100 apparatus; Agilent Technologies, USA) with a C8 column (Shiseido, 5 μm, 150 mm × 4.6 mm) and a UV detector (217 nm). The flow rate was 1 mL/min, and the injection volume was 10 μL; a mixture of 0.1% TBA (tetrabutylammonium hydroxide)-OH solution (A) and acetonitrile (B) was used as the mobile phase. Gradient conditions were 0-2.5 min, 75% A and 25% B; 7 min, 65% A and 35% B; 12 min, 60% A and 40% B; 15 min, 70% A and 30% B.
To evaluate validation of the proposed Sep-Pak-HPLC method, the linearity, limit of detection, and limit of quantification were studied. We analyzed the rate of linearity recovery by using CRM (certificated reference material) to confirm the specificity and appropriacy of benzoic acid in this method.
The optimization of benzoic acid production was performed using RSM with a central composite design. The following were evaluated with respect to benzoic acid production during yogurt fermentation: incubation temperature (a), L. rhamnosus (b), L. paracasei (c), and S. thermophilus (d). The incubation temperatures ranged from 35℃ to 44℃ and starter cultures ranged from 0% to 0.04% (Table 1). For each factor, 5 levels were defined, and were designed by the following codes: −2, −1, 0, +1, +2 (see Table 2 for definitions). End point of fermentation was controlled by final pH (pH 4.5±0.1). A single type of yogurt was used for the optimization process, and the production of benzoic acid was assessed using HPLC.
| Variables | Coded levels | ||||
|---|---|---|---|---|---|
|
|
|||||
| −2 | −1 | 0 | 1 | 2 | |
| Temperature (a, ℃) | 35 | 37 | 40 | 42 | 44 |
| L. rhamnosus (b, %) | 0 | 0.01 | 0.02 | 0.03 | 0.04 |
| L. paracasei (c, %) | 0 | 0.01 | 0.02 | 0.03 | 0.04 |
| S. thermophilus (d, %) | 0 | 0.01 | 0.02 | 0.03 | 0.04 |
a, temperature; b, L. rhamnosus; c, L. paracasei; d, S. thermophilus.
All experiments were repeated at least three times. The results are expressed as mean±standard deviation of the treatments in triplicate, and were analyzed by a one-way analysis of variance, Duncan’s multiple range test, and RSM. The threshold level for statistical significance was set at p<0.05. SPSS version 18 (USA) and SAS 9.4 (SAS Institute Inc., USA) were used for analyses.
Results and Discussion
The correlation coefficient (R2) was 0.999 for benzoic acid, indicating a linear response in the range of 0.5-100 mg/kg. The limit of detection and limit of quantification for benzoic acid were 0.11 and 0.32 mg/kg, respectively. In case of CRM, correlation coefficient of linearity and rate of recovery were 0.998 and 99.96±4.18%, respectively in the range of 0.5-8.00 mg/kg.
Changes in benzoic acid during yogurt fermentation were measured using commercial starters (Table 3). To estimate benzoic acid production, 0.02% inoculums of S. thermophilus, L. acidophilus, L. delbrueckii subsp. bulgaricus L. rhamnosus, L. casei, L. paracasei, L. reuteri, L. plantarum, B. longum, B. lactis, B. bifidum, B. infantis, and B. breve were incubated at 42℃ for 24 h. The single strains, excluding S. thermophilus, reached to stationary phase at 24 h. The benzoic acid contents during yogurt fermentation were 0-17.46 mg/kg. The maximum benzoic acid contents for L. rhamnosus and L. paracasei were 13.89±0.63 mg/kg and 17.46±0.54 mg/kg, respectively.
AYogurt incubated for 24 h. BYogurt incubated for 6 h.
These values represented as mean±SD.
a-fThe letters are different significantly.
N.D. means not detected.
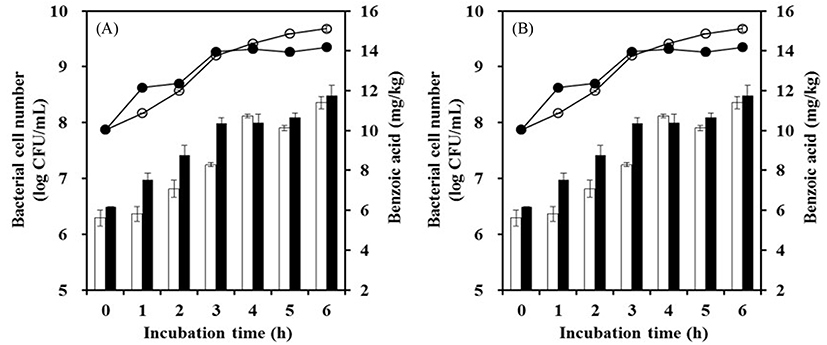
S. thermophilus is the most widely used species in yogurt manufacturing because it has characteristics of β-galactosidase-producing and homofermentative strains. We examined mixed cultures to determine benzoic acid production in commercial conditions. The mixed cultures of 0.01% each strain with 0.01% S. thermophilus were incubated at 42℃ for 6 h to reach the stationary phase. The benzoic acid contents of mixed cultures ranged from 0.76 to 11.36 mg/kg. Those of the mixed cultures of L. rhamnosus with S. thermophilus and L. paracasei with S. thermophilus were 10.12±0.49 mg/kg and 11.36±1.09 mg/kg, respectively (Fig. 1). Bacterial cell number increased rapidly at the initial fermentation and maintained cell growth when the stationary phase was reached. The benzoic acid content also increased and then decreased with cell growth because benzoic acid is primary metabolite.

Benzoic acid production was reported for the commercial starter YC-180, which is composed of Lactobacillus delbrueckii subsp. lactis, S. thermophilus, and L. delbrueckii subsp. bulgaricus, ABT-2 composed of L. acidophilus, Bifidobacteria, and S. thermophilus, and La-5, which is composed of L. acidophilus (Urbiene and Leskauskaite, 2006). Benzoic acid production was highest values in the yogurt fermented with La-5, at 24 mg/kg, and these levels were detected at the initial stationary phase (Urbiene and Leskauskaite, 2006). The commercial starters MYE 95, MY900, CH1, and LYOFAST Y 4.80F have been investigated in Lebanon (Mroueh et al., 2008). The benzoic acid contents using these strains were 4.7, not detected, 14.7, and 8.5 mg/kg, respectively. Based on these results, the production of benzoic acids was influenced by a starter type.
S. thermophilus, L. rhamnosus, and L. paracasei were incubated at 37℃, 42℃, and 45℃ (data not shown). The cell counts and benzoic acid contents for S. thermophilus at 37℃ and 42℃ were 9.26±0.01 Log CFU/mL and 0.89±0.01 mg/kg, and 9.41±0.11 Log CFU/mL and 3.53±0.25 mg/kg, respectively. The cell counts and benzoic acid contents of the mixed culture of L. rhamnosus with S. thermophilus at 37℃ and 42℃ were 9.21±0.03 Log CFU/mL and 10.48±0.17 mg/kg, and 9.29±0.05 Log CFU/mL and 10.62±0.03 mg/kg, respectively. The mixed culture of L. paracasei with S. thermophilus at 37℃ and 42℃ were 9.62±0.06 Log CFU/mL and 11.40±0.30 mg/kg, and 9.33 ±0.02 Log CFU/mL and 11.75±0.51 mg/kg, respectively. However, the tested strains did not grow at 45℃. Therefore, the benzoic acid contents for these strains was higher at 42℃.
Optimized conditions were evaluated in the range of 35-44℃ for the incubation temperature and 0-0.04% for the inoculum ratio using L. rhamnosus, L. paracasei, and S. thermophilus (Table 2). A quadratic model was fitted to the obtained data (Table 4). This model was used to predict responses for any parameter value, and the RSM model in terms of coded values is as follows:
R = 0.04a2 + 4816.85b2 + 2050.19c2 + 2471.02d2 − 5.49ab + 8.94ac − 2.81ad − 2143.75bc − 1443.75bd + 1585.42cd − 3.04a + 116.26b − 428.25c + 36.49d + 74.41 (Eq. 1)
a, temperature; b, L. rhamnosus; c, L. paracasei; d, S. thermophilus.
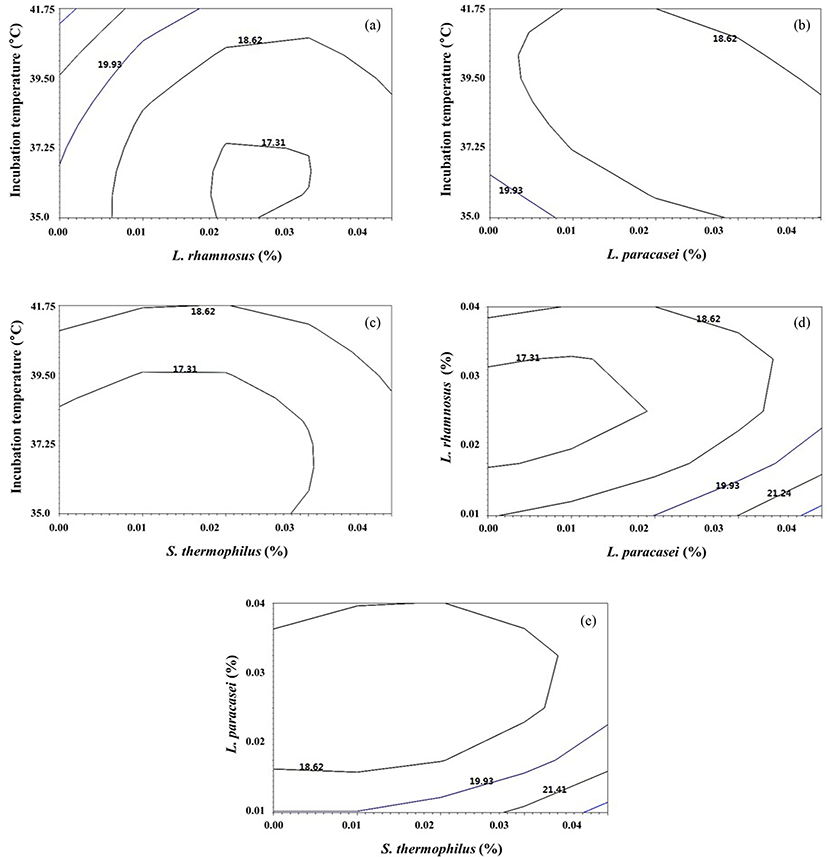
Where R represents benzoic acid production as a function of temperature (a), L. rhamnosus (b), L. paracasei (c), and S. thermophilus (d). Based on the analysis of variance, the model was significant, with a p-value of less than 0.0001 and an R2 value of 0.96 (Table 5). The explanatory variables had significant linear effects on the response variable. The interactive effects of ab, ac, ad, bc, bd, and cd were significant (p<0.005). The benzoic acid production was influenced by factor interactions of each variants (Fig. 2). The conditions for maximum benzoic acid production was 38.12℃, 0.04% a, 0.01% b, and 0.02% c, at which the maximum response for benzoic acid production is predicted (13.31 mg/kg).

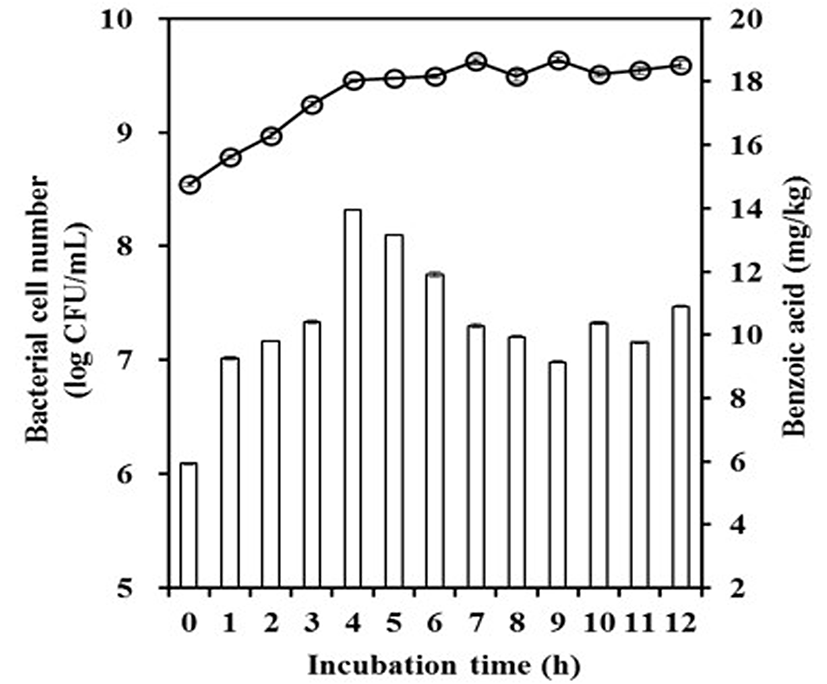
The optimized conditions were applied to yogurt fermentation to empirically confirm the predicted values. The time course of benzoic acid production is shown for yogurt fermentation in Fig. 3. The maximum value of benzoic acid was reached at 4 h, the initial stationary phase (pH 4.8), and then decreased. Benzoic acid production was 5.90-13.96 mg/kg for the incubation period. The predicted and actual values were similar, i.e., 13.31 and 13.96 mg/kg, respectively. Maximal benzoic acid production has been reported for an incubation time of 3-6 h (≥ pH 4.5), which is consistent with our results (Lim et al., 2013; Urbiene and Leskauskaite, 2006). In case of L. paracasei, concentration of benzoic acid was higher than optimized condition after 24 h incubation as a single strain. However, considering the manufacturing process in commercial, fermentation would be complete around in 6 h. L. paracasei doesn’t grow well as a single strain at initial state, because of pH and temperature of milk. In mixed culture incubation, fermentation ends before L. paracasei reach to maximum growth. Thus, only obtained values during fermentation with S. thermophilus would be in consideration. In commercial yogurt, benzoic acid production has been reported as 12-47 mg/kg (Sieber et al., 1995) and 8.94-28.30 mg/kg (Yildiz et al., 2012). These naturally occurring levels of benzoic acid are within regulatory guidelines.

Conclusions
This study investigated the production of a naturally occurring yogurt preservative with respect to starter culture and incubation temperature. Among 12 commercial starter cultures, L. rhamnosus and L. paracasei showed the highest benzoic acid production. RSM of incubation temperature, L. rhamnosus, L. paracasei, and S. thermophilus was performed to optimize benzoic acid production. The optimum conditions for benzoic acid production were 38.12℃, 0.04% L. rhamnosus, 0.01% L. paracasei, and 0.02% S. thermophilus. The predicted production was similar to observed value. The results demonstrated maximal naturally occurring benzoic acid production during the yogurt fermentation process, and these values satisfy current regulations.


