


Introduction
As an alternative to breast milk, infant formula has achieved an annual growth rate of nearly 20% since 2013 in the global market, particularly in China (Meng et al., 2024).
Lactoferrin (LF), a prominent bioactive glycoprotein found in human milk, is also present in animal milk and exerts a variety of beneficial effects. Research indicates that it plays an important role in safeguarding infants against infections, facilitating the development of the immune system, and ameliorating iron deficiency anemia in infants (Hao et al., 2019). Given its excellent biological functions, LF is frequently incorporated into infant formula to enhance the nutritional profile of milk powder, thereby making it more comparable to breast milk. However, LF is susceptible to various environmental factors, including thermal processing, pH levels, and ionic strength, which can cause protein denaturation, disrupt the spatial configuration of LF, and ultimately result in a loss of its biological functions. The complex coacervation of LF and polysaccharides is considered a promising approach for protecting LF from thermal denaturation, primarily owing to its avoidance of elevated temperatures and organic solvents. Previous studies have shown that the thermal stability of LF can be enhanced through complex coacervation with anionic polysaccharides, such as soybean soluble polysaccharide, okra polysaccharide, and sodium alginate (Li et al., 2019; Lin et al., 2022; Xu et al., 2019). Moreover, these complex coacervates play a key role in regulating food structure, stabilizing emulsions, substituting fats, and encapsulating bioactive ingredients (Ahad et al., 2023; Krzeminski et al., 2014; Warnakulasuriya and Nickerson, 2018).
Resistant dextrin (RD) is a typical oligosaccharide widely present in infant formula, recognized for its properties such as low viscosity, high solubility in water, and unique thermal stability, which render it a preferred component in functional foods and beverages (Trithavisup et al., 2019). Docosahexaenoic acid (DHA) serves as a nutritional fortifier in infant formula, and a recent regulation from the European Commission mandates its inclusion in such products. DHA is associated with several biological benefits, such as the promotion of brain and visual development, the prevention of cardiovascular diseases, and potential anti-cancer effects (Fu et al., 2020). However, DHA is susceptible to degradation through exposure to oxygen, light and heat, which can lead to oxidation and the development of off-putting odors during the production and storage of infant formula (Wang et al., 2022). Microencapsulation of DHA presents a viable technological approach to protect it from oxidative degradation. This method can not only preserve the nutrient’s integrity and extends its shelf life, but also helps to mask undesirable flavors. Research conducted by Chen et al. (2016) demonstrated that encapsulating DHA within a wall matrix composed of a glucose, casein, and lactose yields microcapsules with remarkable oxidative stability. Following accelerated oxidation tests at 45°C over a period of 8 weeks, the peroxide value of the encapsulated DHA was found to be merely one-ninth of the unencapsulated DHA oil.
To the best of our knowledge, there is a paucity of research on the effects of LF and RD complex coacervation on the functional properties of LF, particularly in the context of utilizing LF-RD complexes as carriers for the delivery of DHA. The formation of complex coacervates between proteins and polysaccharides is primarily driven by electrostatic attractions between the charged groups present on these macromolecules (Tian et al., 2023). The strength of these interactions is influenced by various factors, including pH, the ratios of biopolymers, and ionic strength (Liu et al., 2009; Samanta and Ganesan, 2018). Thus, it is essential to identify the optimal conditions for the complex coacervation process. Moreover, the electrostatic complexes generated through the coacervation of proteins and polysaccharides not only integrate the unique physicochemical properties of both components, but also provide a viable strategy to address the limitations and improve functionality of individual biopolymers, thereby indicating a broader potential for application (Bastos et al., 2018; Meng et al., 2024; Xu et al., 2020).
On the background of this, this study was designed to (1) identify the optimal conditions (pH, biopolymer mixing ratios) for the formation of LF-RD complex coacervates; (2) determine the binding constant, number of binding sites, and thermodynamic parameters for this complex reaction under different temperatures; (3) characterize the structural, thermal, foaming, emulsifying, morphological, antioxidant, and in vitro digestion properties of LF-RD complex coacervates; (4) explore the feasibility of microencapsulating DHA using LF-RD complex coacervates.
Materials and Methods
Bovine LF (purity≥95.0%), DHA, Nile blue, Nile red, 5-aminofluorescein, dimethyl sulfoxide, and gallic acid (GA) were provided by Shanghai Yuanye Bio-Technology (Shanghai, China). RD was sourced from Shandong Balongchuangyuan Bio-Technology (Shandong, China). Hydrochloric acid (HCl), 8-anilino-1-naphthalenesulfonic acid (ANS), sodium hydroxide (NaOH), and 2, 2-diphenyl-1-picrylhydrazyl (DPPH), were procured from Sigma-Aldrich® (Shanghai, China).
Add LF and RD powders to distilled water separately to a concentration of 0.1% (w/w). The preparation of complex coacervates involved mixing LF and RD powders in various mass ratios (LF:RD=1:1, 1:2, 1:4, 1:8, 1:12, 1:16, 1:20, w/w), and the total concentration of the mixed solution formed was 0.1%. Subsequently, these solutions were homogenized through a magnetic stirrer (RO10, IKA, Staufen, Germany) for 2 h to ensure absolute dissolution.
A Zetasizer Nano (Nano-ZS, Malvern Instruments, Malvern, UK) was conducted to measure the zeta potential and particle size of LF, RD, and LF-RD coacervates. Samples’ pH was adjusted within a range of 4.0 to 8.5 by adding 0.1 M HCl and 0.1 M NaOH in increments of 0.5±0.05 units. The zeta potentials of LF and RD measured at each pH were labeled as ZP1 and ZP2, respectively. Then, the strength of the electrostatic interaction (SEI) between LF and RD was calculated using Eq. (1) (Tomé Constantino and Garcia-Rojas, 2022).
The determination of turbidity for samples at pH 7.0 was performed using a spectrophotometer (UV-2550, Shimadzu, Kyoto, Japan). Distilled water served as the reference and the samples’ turbidity was represented as absorbance at 600 nm.
The yield of coacervates from the systems (1%, w/v) was assessed at various ratios of LF to RD (1:1, 1:2, 1:4, 1:8, 1:12, 1:16, and 1:20, w/w) according to Chen et al. (2021). Simply, once the complex coacervate was formed at the optimum pH (highest turbidity), centrifugation was carried out, and the precipitate obtained was dried at 105±0.1°C. The dried complex coacervates’ weight, as well as the total weight of LF and RD, were recorded as Wc and Wt, respectively. Then, the yield of the complex coacervates was estimated by the Eq. (2).
Based on the trials conducted in the previous section of 2.3, 2.4, and 2.5 in this study, a mixed solution of LF-RD (0.1%, w/w) with a ratio of LF to RD at 1:12 was employed to produce complex coacervates. The blend was mixed thoroughly and its pH was corrected to 7.0. Subsequently, the mixed solution’s temperature was quickly lowered to below 5°C in an ice bath and stirred at 200 rpm for 30 min to enhance coacervate formation. The resulting solution was freeze-dried using a lyophilizer (Freezone® 6 Plus, Labconco, Kansas City, MO, USA) for subsequent analysis.
Fluorescence spectroscopy was performed at three distinct temperatures (298 K, 303 K, and 308 K) by a fluorescence spectrophotometer (F-2700, Hitachi, Tokyo, Japan). The interaction between LF and RD was confirmed through the fluorescence quenching method as described by Li et al. (2018) with slight amendments. Various concentrations of RD solutions were introduced to the LF solution, resulting in a final concentration of LF was12.5 μM, while RD’s final concentrations were 20, 40, 80, 160, 240, 320, and 400 μM, respectively. Fluorescence spectra were recorded in the 300–450 nm range at an excitation wavelength of 295 nm.
The binding constant (Ka) and the number of binding sites (n) of the binding characteristics between LF and RD were calculated according to the double logarithmic Eq. (3) (Yan et al., 2022).
In this equation, F0 and F stand for the maximum fluorescence intensity of LF without RD and with RD; while [RD] represents the concentration of RD.
To investigate the thermodynamical parameters, the enthalpy change (ΔH), entropy change (ΔS), and Gibbs free energy change (ΔG) were calculated according to the Van’t Hoff equation.
Here, R denotes the gas constant (8.314 J mol−1 K−1) and T signifies the thermodynamic temperature (298 K, 304 K, or 310 K).
Structural analysis of LF, RD, and lyophilized coacervate was conducted utilizing an Fourier transform infrared (FTIR) spectrometer (Nicolet iS10, Thermo Fisher Scientific, Waltham, MA, USA). Spectral data were collected over a wavelength range from 4,000 to 600 cm−1.
The diffraction patterns of LF, RD, and lyophilized coacervate were analyzed using a wide-range X-ray diffractometer (D8 ADVANCE, Bruker, Germany) with Cu-Kα radiation (λ=1.54056 A°). The sample was positioned on a flat glass sample holder and scanned in reflection mode at a scanning rate of 0.02° 2θ/s within the 4°–40° range. All measurements were conducted at a 40 kV voltage and 40 mA tube current.
Scanning electron microscopy (SEM) was done to observe the shape and morphology of LF, RD, and LF-RD coacervates. Samples were initially affixed onto a conductive adhesive and then covered with a gold layer through a spraying process. Subsequently, the morphology was observed at various magnification levels using a scanning electron microscope (GeminiSEM 300, ZEISS, Oberkochen, Germany).
To achieve confocal laser scanning microscopy (CLSM) investigations, the sample solution (0.01% and 1%, w/v) was stained with a mixed fluorescent dye solution composed of 1.0 mg mL–1 Nile blue and 1.0 mg mL–1 5-aminofluorescein for 20 min at 25°C. Subsequently, 5 μL of the sample solution was placed on a glass slide and examined by 20× objective lens on a confocal laser scanning microscope (Olympus FV 1200-BX61, Olympus, Tokyo, Japan). Nile blue and 5-aminofluorescein observations were obtained at laser wavelengths of 633 and 488 nm, respectively.
The surface hydrophobicity was assessed according to Zhang et al. (2024). Briefly, a 20 μL solution of 8 mM ANS, which served as a hydrophobic probe, was added to a 4 mL sample solution. After a 15-minute incubation period in the dark, fluorescence spectroscopy was then conducted, with excitation was 390 nm and emission wavelengths was 400 to 600 nm.
The foaming characteristics of samples were analyzed by Yan et al. (2022), albeit with minor adjustments. Specifically, the foam was accomplished by agitating a 10 mL sample solution (10 mg mL–1) at a high speed (10,000 r min–1) for 2 min. The calculation formula of foam capacity (FC) and foam stability (FS) were as stated below:
Where V (mL) represents the initial volume pro-homogenization; V0 (mL) and V30 (mL) refer to the foam volumes at 0 min and 30 min post-homogenization, respectively.
A mixture comprising the sample solution (1 mg mL–1) and olive oil (3:1, v/v) was subjected to homogenization at a speed of 12,000 r min–1 for a duration of 3 min. Subsequently, emulsions (30 μL each) were collected at 0 and 10 minutes and mixed with 3 mL of 0.1% (w/v) sodium dodecyl sulfate solution. The absorbance values of samples were measured at 500 nm. The emulsion activity index (EAI) and emulsification stability index (ESI) were determined utilizing the provided formulas:
Here, N is the dilution factor (100); C stands for the LF concentration (g mL–1); φ indicates the volume fraction of oil in the emulsions; A0 and A10 refer to the absorbances measured at 0 and 10 min respectively.
A differential scanning calorimetry (DSC; Discovery DSC-250, TA Instruments, New Castle, DE, USA) was employed to characterize the thermal stability of the samples. Sealed aluminum pans containing lyophilized samples (5–10 mg) were heated from 30°C to 180°C at a rate of 5°C min–1. The thermal stability of LF, RD, and lyophilized complexes was explored utilizing a thermogravimetric (TGA) analyzer (TGA2, Mettler-Toledo, Schwerzenbach, Switzerland). Typically, 5–10 mg of sample was subjected to heating from 30°C to 600°C at a rate of 10°C min–1.
According to the methods outlined in the Chinese national standard (Ministry of Health of the People’s Republic of China, 2020) and the previous reports (Chen et al., 2022; Li et al., 2021a; Li et al., 2023), the antioxidant activity of the LF-RD complex coacervates was assessed using the DPPH and 2,2’-azino-bis(3-ethylbenzothiazoline-6-sulfonic acid) (ABTS) assays. In the DPPH assay, 1 mL of a 2 mg mL–1 sample solution was mixed with 3 mL of 0.1 mM ethanol DPPH solution. The samples were then incubated in the dark for 30 min, after which the absorbance was measured at 517 nm by a UV/visible spectrophotometer (UV-2550, Shimadzu). For the ABTS assay, a 7.0 mM ABTS solution was mixed with a 2.45 mM potassium persulfate solution and stored in the dark for 16 h. The resulting mixture was diluted with distilled water to obtain an absorbance of 0.70±0.02 at 734 nm. The samples were then combined with an equal volume of ABTS stock solution and allowed to react for 30 min, with absorbance subsequently measured at 734 nm. The radical scavenging activity (%) was calculated using the following formula:
Here, A denotes the absorbance of the control sample, A1 represents the absorbance of the sample after 30 min of reaction in the dark, and A2 corresponds to the absorbance of the sample without DPPH or ABTS.
GA was utilized as a standard control in the antioxidant activity assays to establish standard curves for DPPH and ABTS radicals. A stock solution was prepared by dissolving 1.89 mg of GA in 25 mL distilled water, which was subsequently diluted to obtain GA solutions with concentrations varying from 10 to 80 μM and 20 to 100 μM. These solutions were then subjected to reactions with DPPH and ABTS radicals, as previously described, and the absorbance was recorded at 517 nm and 734 nm, respectively. Standard curves were developed by plotting the concentrations of GA against their corresponding absorbance values. Following this, 5 mg mL–1 solutions of LF, RD, and LF-RD complexes were subjected to DPPH and ABTS radical scavenging assays using the same procedure. The results were expressed as μmol gallic acid equivalent (GAE)/g sample.
An in vitro digestion pattern was employed to analyze the gastric digestion process of LF and LF-RD complex coacervates, with the simulated gastric fluid prepared following previously reported methods (Ménard et al., 2018). Specifically, the infant simulated gastric fluid was composed of NaCl (94 mM) and KCl (13 mM), with the pH adjusted to 5.3 using 1 M HCl. The LF concentration was set at 5 mg mL–1, and the samples were digested with pepsin at a ratio of 268 U mL–1. In vitro digestion was initiated by adding 5 mL of pre-warmed (37°C) simulated gastric fluid to 5 mL of the sample solution. Samples were collected at 0, 30, 60, and 120 min after the initiation of digestion. Subsequently, the hydrolysis of LF and LF-RD complexes during this simulated digestion was assessed through sodium dodecyl sulfate-polyacrylamide gel electrophoresis, which was performed using a 5% concentrate gel and a 12% separator gel at 120 V for 2 h. After electrophoresis, the gels were stained with Coomassie Brilliant Blue R-250 (Solarbio, Beijing, China) for 2 h and then destained overnight in a 7.5% acetic acid.
The encapsulation process was carried out according to El Ghazzaqui Barbosa et al. (2022) with minor adaptations. To this end, the solution contained 1.0% (w/w) wall material with a core-to-wall ratio of 1:2 (w/w). Initially, an oil-in-water emulsion was prepared using an Ultra-Turrax (Ultraturrax T18, IKA) with LF and DHA at 10,340×g for 5 min. Subsequently, RD was added to the emulsions, adjusting the pH to 7.0 with 0.1M HCl. Transglutaminase (30 U/g of protein) was introduced to facilitate the crosslinking of the wall material. Finally, samples were frozen in liquid nitrogen and lyophilized. Regarding the encapsulation efficiency of DHA microcapsules, it was assessed following the method described by Chen et al. (2022). This involves measuring the surface oil (SO) and total oil (TO) contents by gravimetric method, and the encapsulation efficiency was calculated according to Eq. (11).
The encapsulation process of DHA microcapsules was observed under an optical microscope. The sample was positioned at the center of a glass slide and carefully covered with a coverslip. DHA was stained with Nile red, and the formation of microcapsules was monitored by an optical microscope fitted with a camera (CX 21, Olympus). The CLSM observations of DHA microcapsules was referred to those of LF-RD complexes, as detailed in section 2.8, with the sole distinction being the use of Nile red for staining DHA instead of 5-aminofluorescein.
All the data obtained from three parallel experiments were presented as the mean±SD. An analysis of variance (ANOVA) was performed using Duncan’s multiple range test (p<0.05), facilitated by SPSS 25.0 software (IBM, Armonk, NY, USA). Graphical illustrations were generated using Origin 2018 software (OriginLab, Northampton, MA, USA).
Results and Discussion
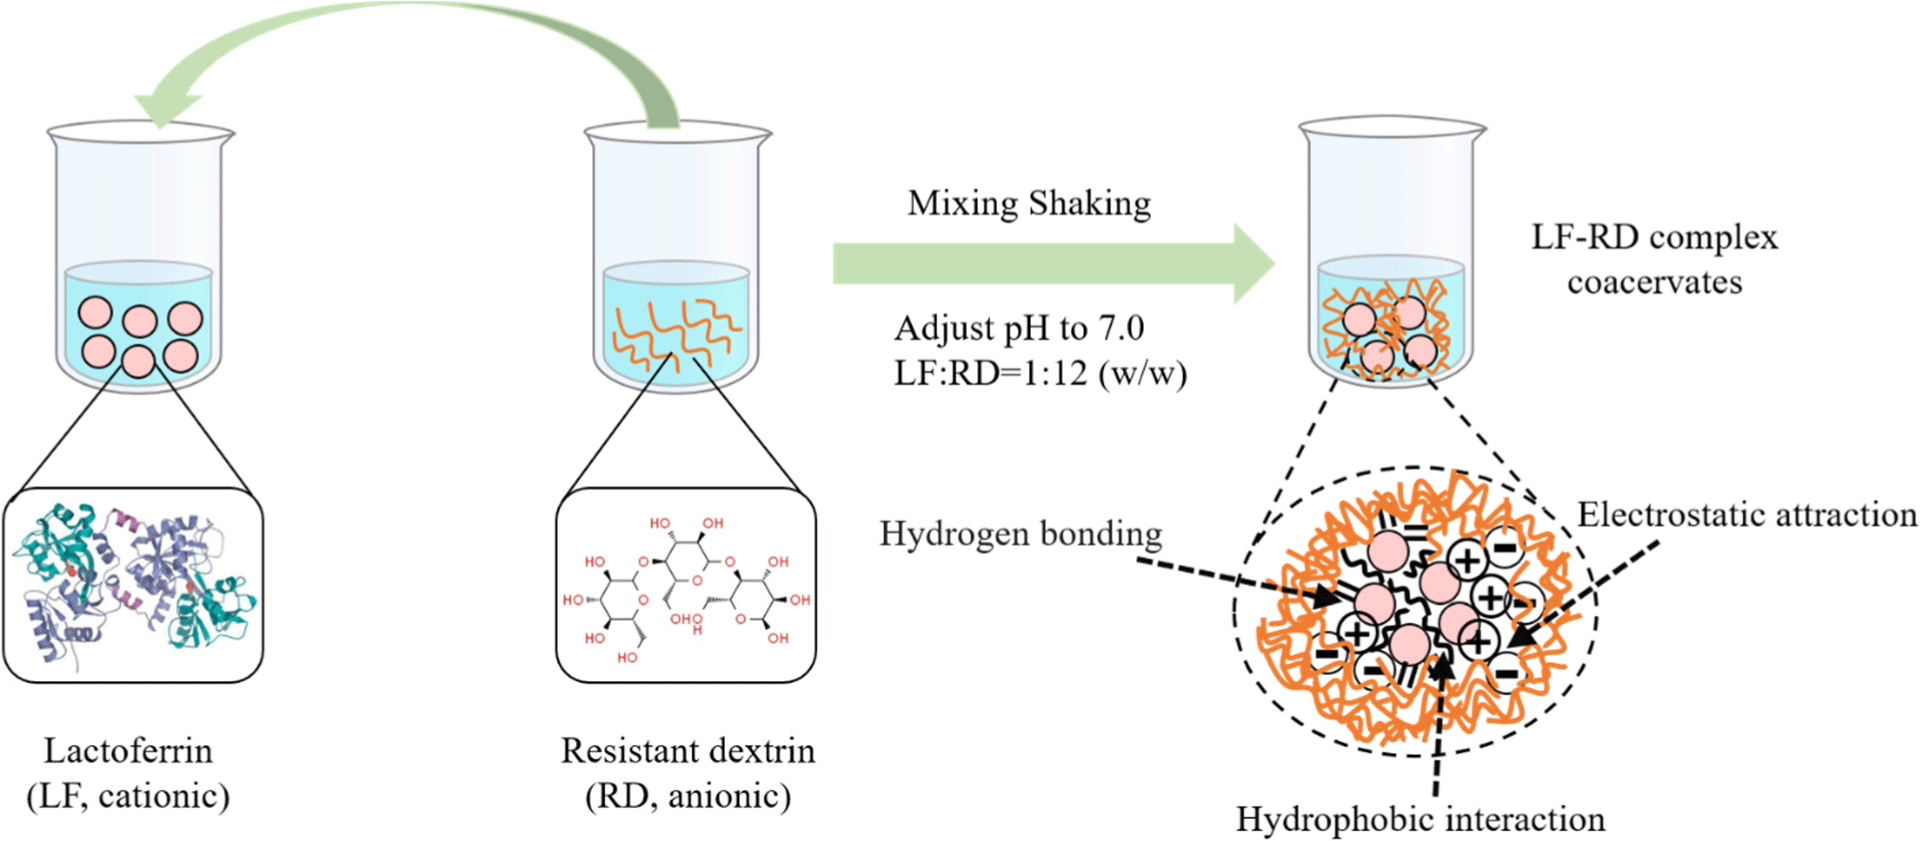
The coacervation of protein-polysaccharide complex is driven by electrostatic forces between biopolymers possessing contrasting charges. This process is significantly influenced by pH, which exerts a substantial influence on this process by modulating the intensity of electrostatic attraction and the degree of complex coacervation between the biopolymers (Chen et al., 2021). In addition, the proportion of protein to polysaccharide in the mixture is another critical variable that impacts the results, as an ideal ratio fosters heightened electrostatic interactions and maximizes coacervate yield (Chen et al., 2022; Li et al., 2024). Hence, this study commenced by establishing the optimal pH and LF to RD ratio as fundamental parameters.
Fig. 1A illustrates the variations in the zeta potential values of LF and RD in the pH range of 4.0–8.5. It is evident that as the pH increased, the zeta potential values for both LF and RD tended to decrease. The isoelectric point (pI) of LF is approximately 8.2, consistent with previous research findings (Peinado et al., 2010). The zeta potential value of RD became positive below pH 4.7, whereas it remained negatively charged at all pH values above 4.7. SEI was calculated based on the zeta potential values of LF and RD. Electrostatic interaction forces are significant in determining the optimal pH for interactions between biopolymers. The highest SEI of 297.46±3.41 mV2 was observed at pH 7.0, suggesting the strongest binding or attraction between LF and RD. This parameter is crucial for complex coacervation, given that RD carries a negative charge above pH 4.7 and LF is positively charged below pH 8.2. Similar findings have also been observed that LF can form complex coacervates with soy protein isolate, okra polysaccharide, or sodium alginate at a neutral pH value (Tokle et al., 2010; Xu et al., 2019; Zheng et al., 2020). Thus, this pH value was used to identify the most appropriate LF-to-RD ratio.
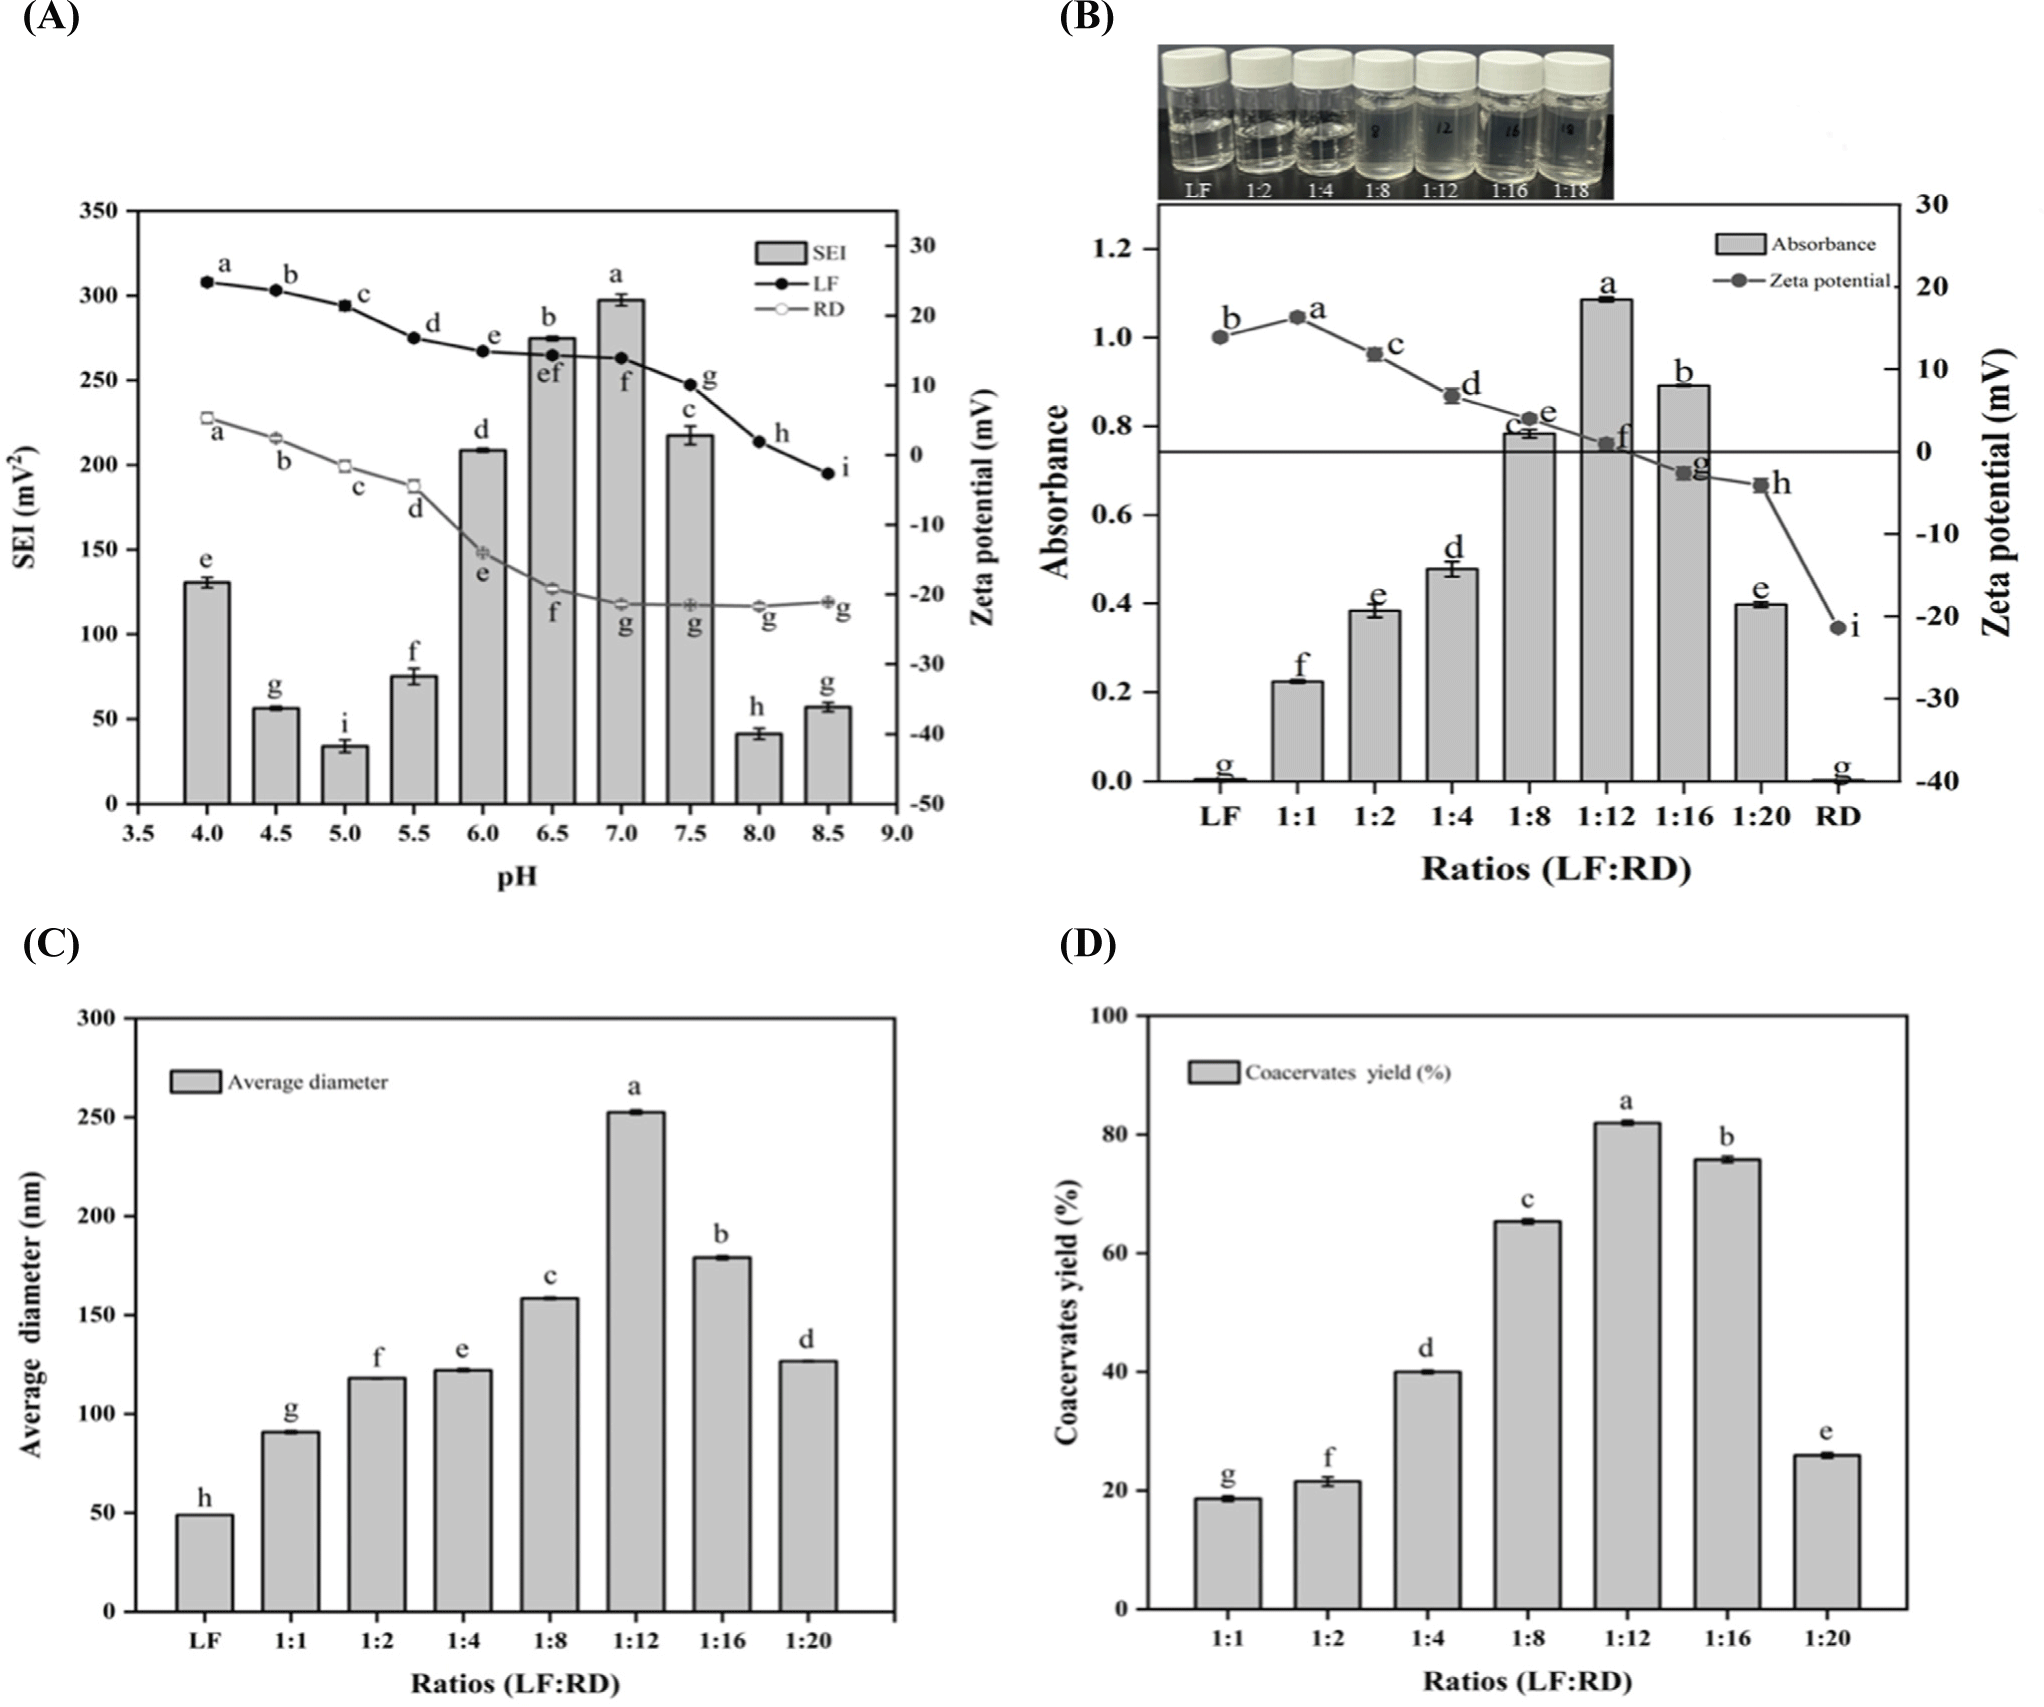
The zeta potential and turbidity results for various LF:RD ratios (1:1–1:20, w/w) at pH 7.0 are presented in Fig. 1B. It was noted that neither LF nor RD solutions exhibited turbidity at pH 7.0, indicating the absence of self-aggregation. With an increase in the RD content, the turbidity of the system gradually increased, peaking at an LF:RD ratio of 1:12. At this ratio, the zeta potential was closest to electrical neutrality (0.91 mV), implying that an equilibrium between positive (NH3+) and negative (COO-) charges was attained. Comparable results were documented in a research study that investigated the combination of LF and carboxymethyl tara gum in different ratios (Santos et al., 2021). However, a further rise in the RD content resulted in a reduction in turbidity. Studies have proposed that an excessive amount of polysaccharides in the system impedes protein aggregate formation by inducing steric repulsion, thereby reducing turbidity (Naderi et al., 2020).
Fig. 1C displays the average diameters of the LF and LF-RD coacervate at pH 7.0. Initially, the average diameter of the LF at room temperature is 48.96±0.02 nm. Following the addition of RD, the average diameter of the LF-RD complex exhibited a gradual increase, which may be potentially ascribed to electrostatic interactions between LF and RD molecules. The particle size achieved a maximum value of 252.6±1.08 nm at a ratio of 1:12, signifying the optimal degree of complex coacervation of LF and RD under these specific conditions. A similar trend was noted in a previous investigation, where the diameter of the LF-NaCas complex increased with an escalating NaCas addition ratio ranging from 4:1 to 1:2 (LF: NaCas, w/w; Li and Zhao, 2017).
In order to identify the optimal conditions for complex coacervation, specifically focusing on a 1:12 ratio and a pH of 7.0, the coacervate yield was assessed. The results presented in Fig. 1D indicate that the highest coacervate yield is achieved at pH 7.0 and a 1:12 ratio, which aligns with the findings from the turbidity measurements. Taking into account a comprehensive analysis of the experimental results presented above, it can be inferred that a 1:12 (LF:RD) ratio at pH 7.0 is the most favorable condition for the generation of complex coacervates.
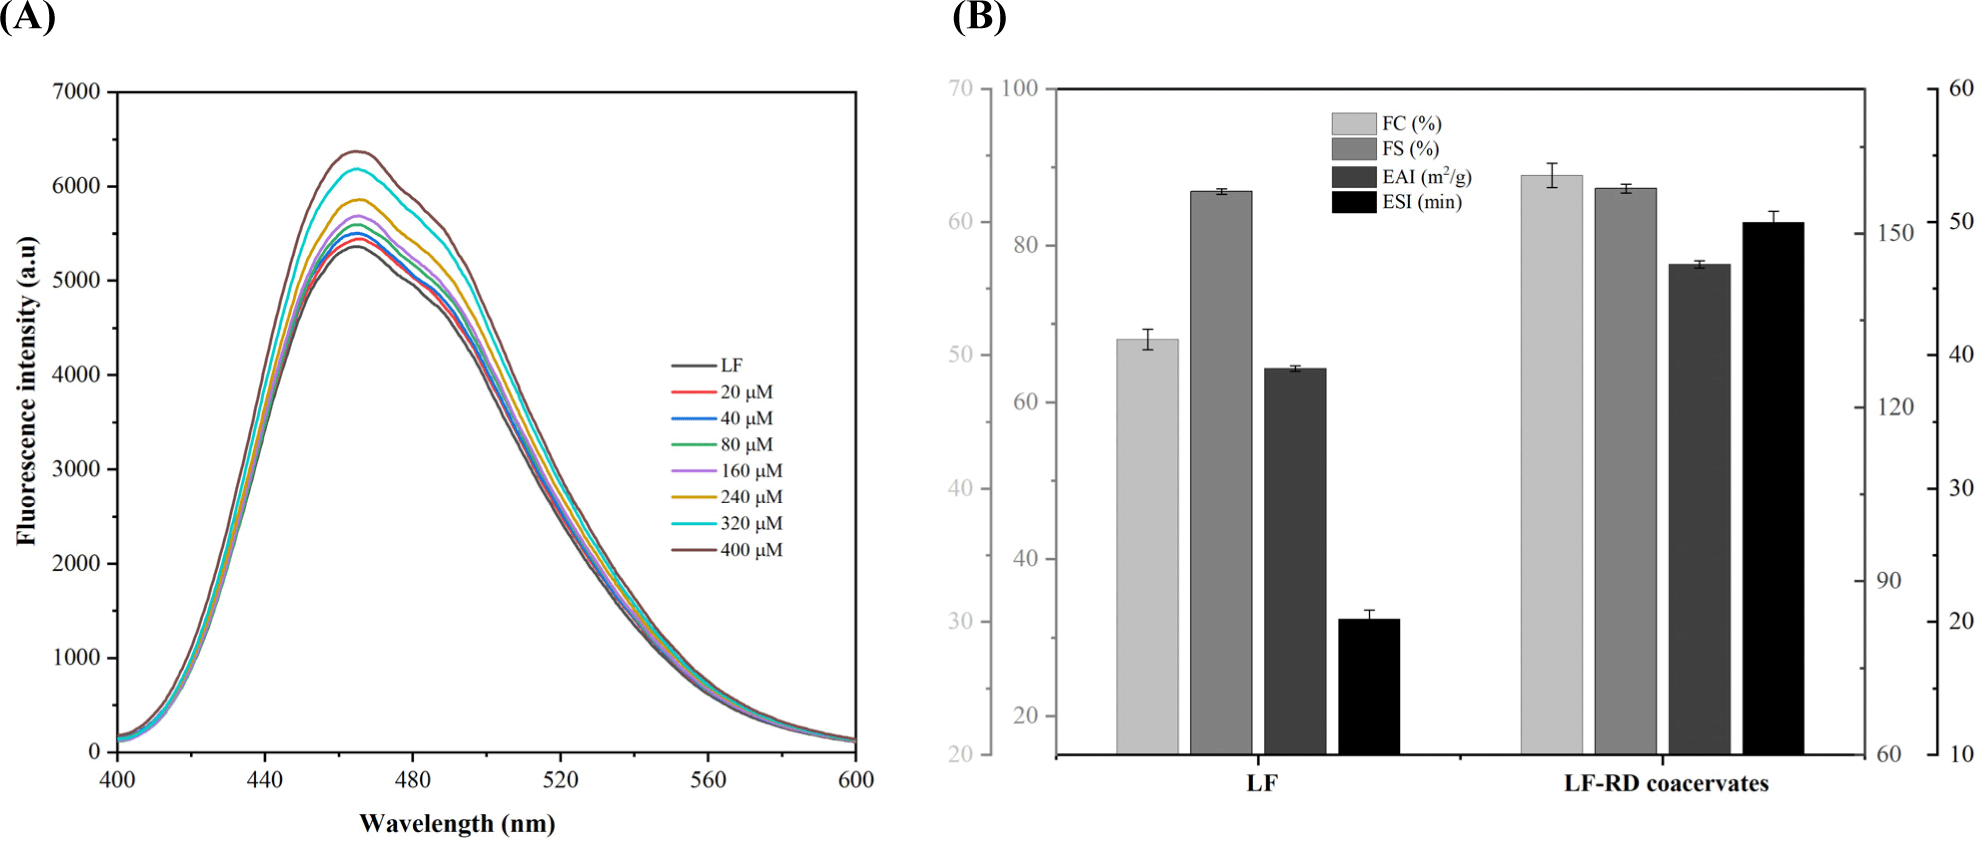
Fluorescence spectroscopy serves as a prevalent method for investigating the interactions that occur between proteins and bioactive substances (Rossi and Taylor, 2011; Zhang et al., 2020). Figs. 2A, B, and C depicts the changes in the intrinsic fluorescence intensity of LF as a function of RD concentration. It was observed that under pH 7.0 conditions, LF exhibited a maximum intrinsic fluorescence emission at approximately 331.5 nm, in compliance with a previous study (Li et al., 2019). The fluorescence intensity of LF demonstrated a concentration-dependent decay as RD concentration increased, a trend similarly noted by Peinado et al. (2010). The finding implies that the intrinsic fluorescence of LF is quenched due to the complexation interaction between LF and RD.
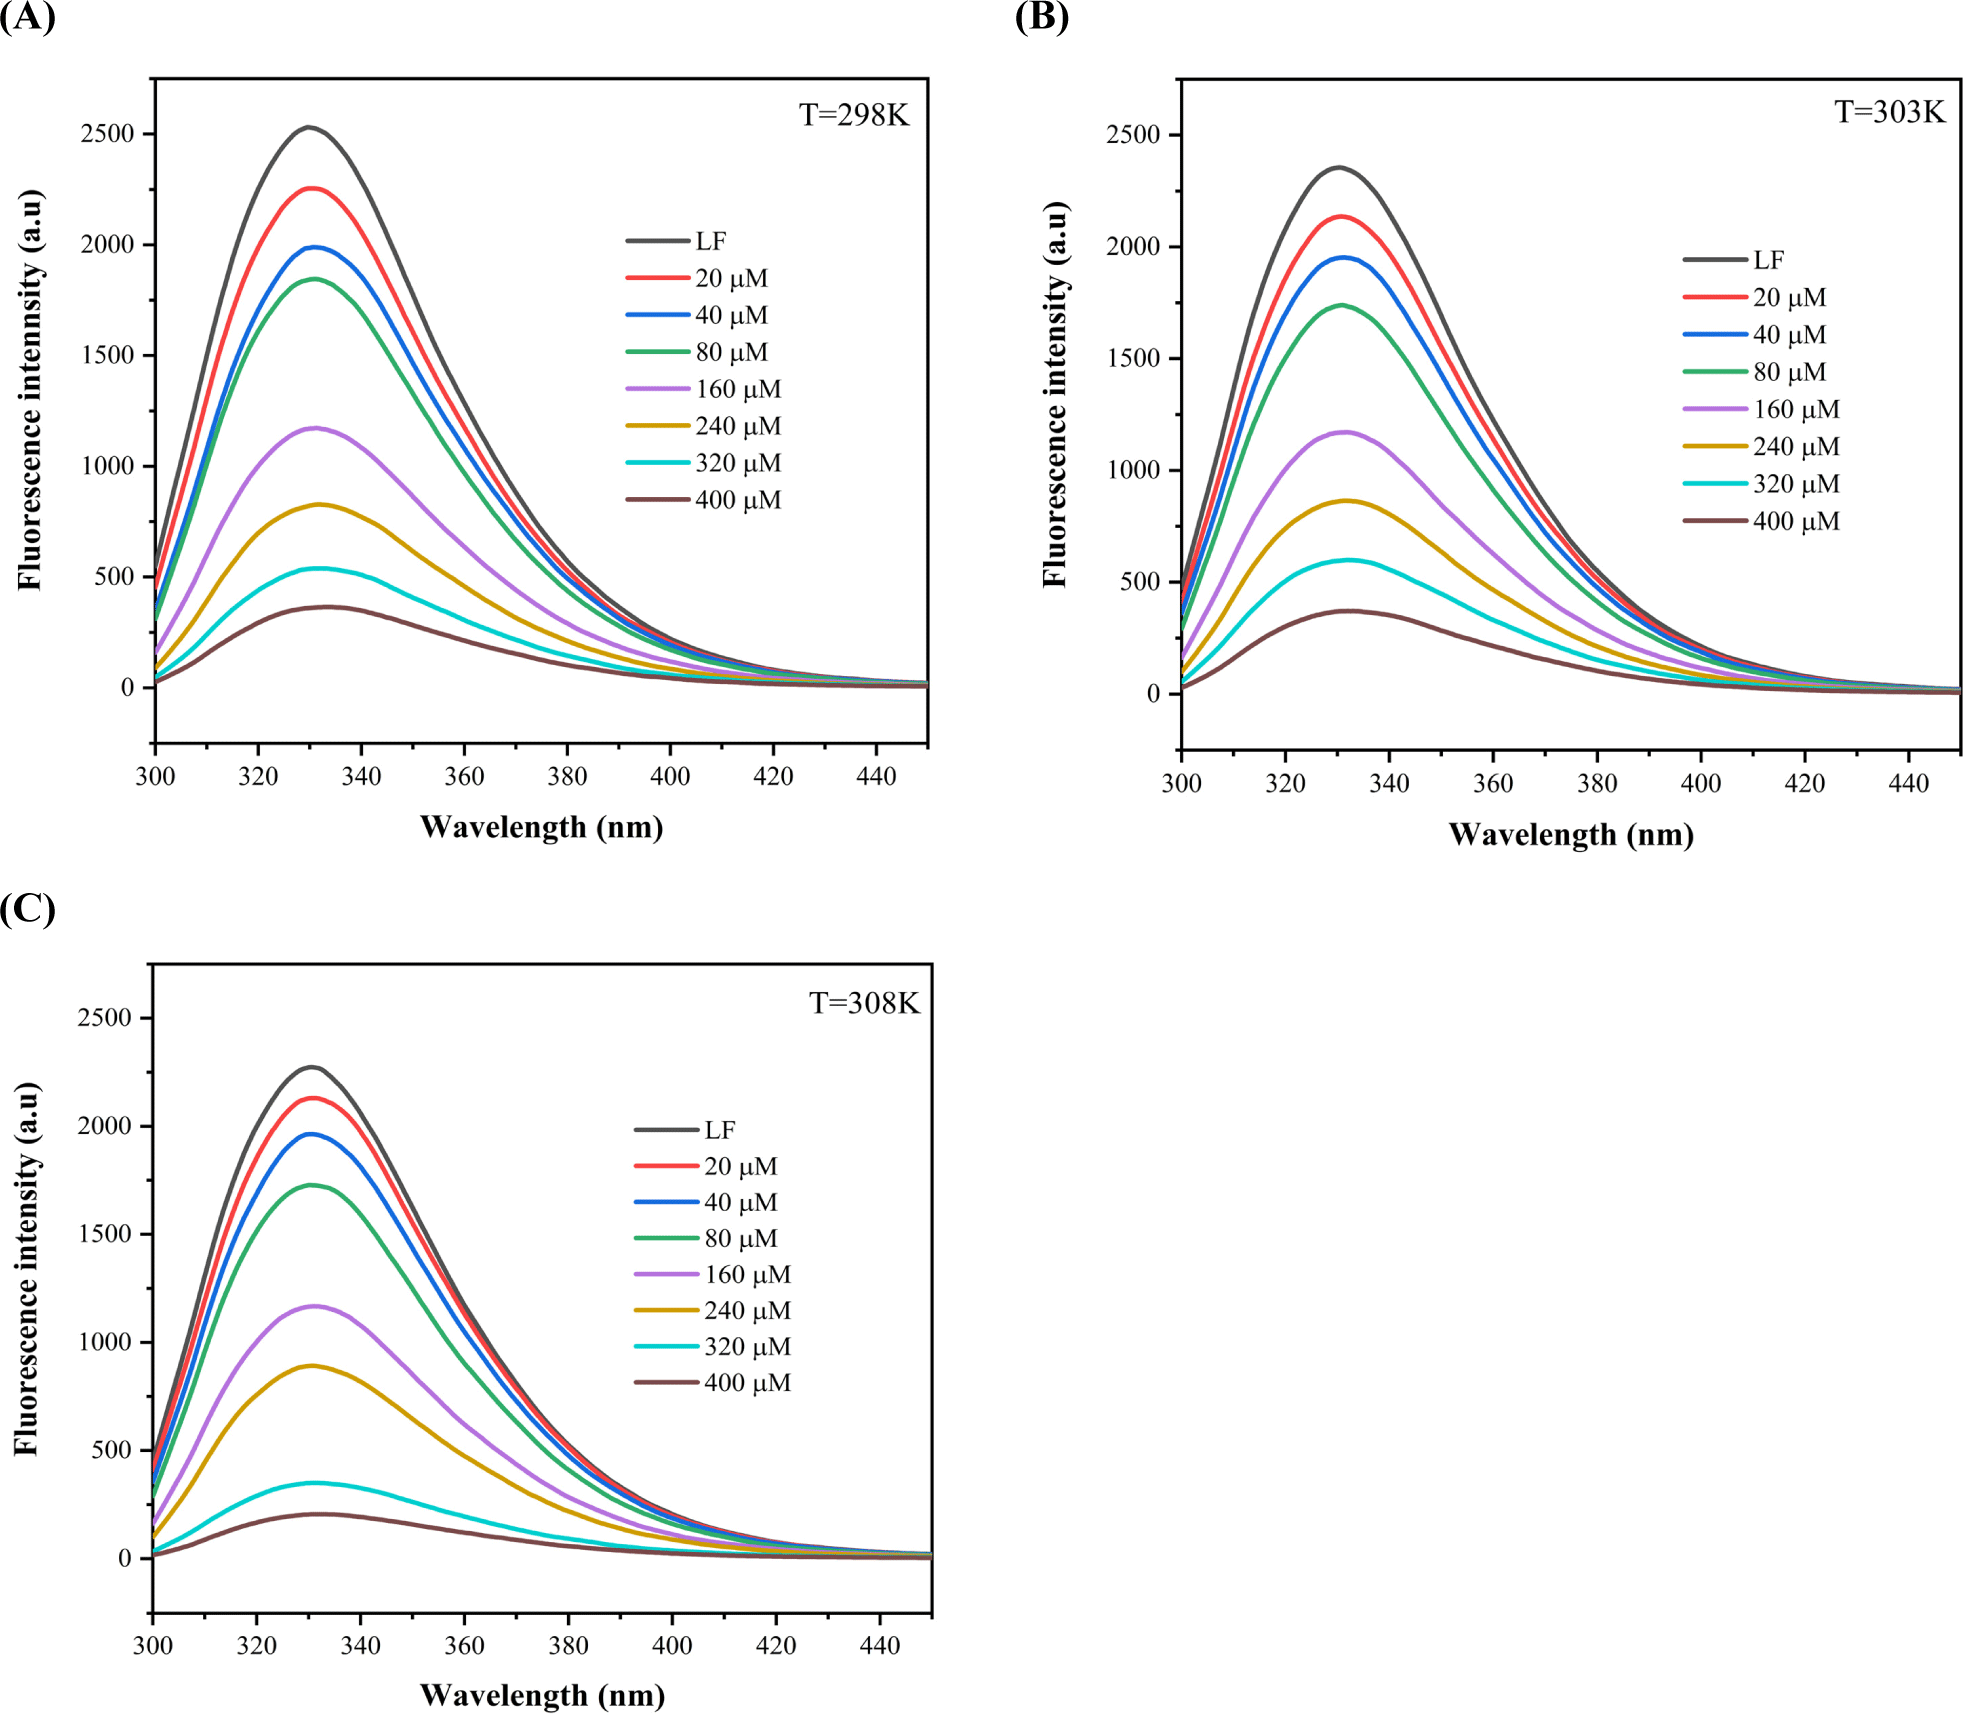
To elucidate the binding characteristics of the LF-RD complexes, the double logarithmic equation [Eq. (3)] was employed to determine the Ka and n, as outlined in Table 1. Analysis revealed a negative correlation between Ka values and temperature increase (298 K: 8.73×10⁴ L mol−1, 303 K: 8.22×10⁴ L mol−1, 308 K: 7.83×10⁴ L mol−1), implying that the high temperature is not conducive to the interaction between LF and RD. Interestingly, fluctuations in temperature had minimal impact on the value of n, which remained close to 1. A study by Yan et al. (2022) also reported similar results for n in cases where LF was non-covalently bound to Re/Rb1.
| T (K) | Ka (×104 M–1) | n | ΔG (KJ mol–1) | ΔH (KJ mol–1) | ΔS (J mol–1 K–1) |
|---|---|---|---|---|---|
| 298 | 8.73 | 1.282 | –28.49 | –8.49±0.33 | 66±2 |
| 303 | 8.22 | 1.272 | |||
| 308 | 7.83 | 1.247 |
Thermodynamic parameters were employed to elucidate the driving forces that govern the interaction between LF and RD. By applying the Van’t Hoff equation [Eqs. (4) and (5)], the values ΔG, ΔH, and ΔS were determined, with detailed information provided in Table 1. The negative value of ΔG implies the spontaneous occurrence of the LF-RD combination. Furthermore, the complex exhibited a ΔH of –8.49±0.33 KJ mol−1 and ΔS of 66±2 J mol−1 K−1. Based on the values of ΔG, ΔH, and ΔS, it can be inferred that electrostatic interaction serves as the main driving force behind the LF-RD complex formation (Zheng et al., 2020).
FTIR analysis was conducted to enhance the comprehension of the chemical structures of LF and RD, along with their chemical interactions in complex coacervation. Based on the findings presented in Fig. 3A, the LF spectrum displayed several characteristic peaks indicative of the protein structure. Notably, the peak at 3,280 cm−1 signified the presence of O–H groups in free amino acids, whereas the band observed at 2,931 cm−1 linked to the stretching vibration of C–H. Furthermore, the peaks found at 1,635, 1,516, and 1,390 cm−1 are associated with Amide I (stretching of CO and CN), Amide II (primarily bending of NH), and Amide III (stretching of CN), respectively (Bastos et al., 2018). For the RD spectrum, the peaks at 3,305 cm−1 and 2,922 cm−1 are characteristic absorption bands connected with O–H and C–H in polysaccharides, respectively (Qiu et al., 2022). Another band detected at 1,010 cm−1 was linked to the structure of saccharide (C–O–C; Yang et al., 2021). The asymmetric and symmetric stretching vibrations of the carboxylic group were exhibited as two peaks at 1,644 and 1,421 cm−1 (Chen et al., 2022).
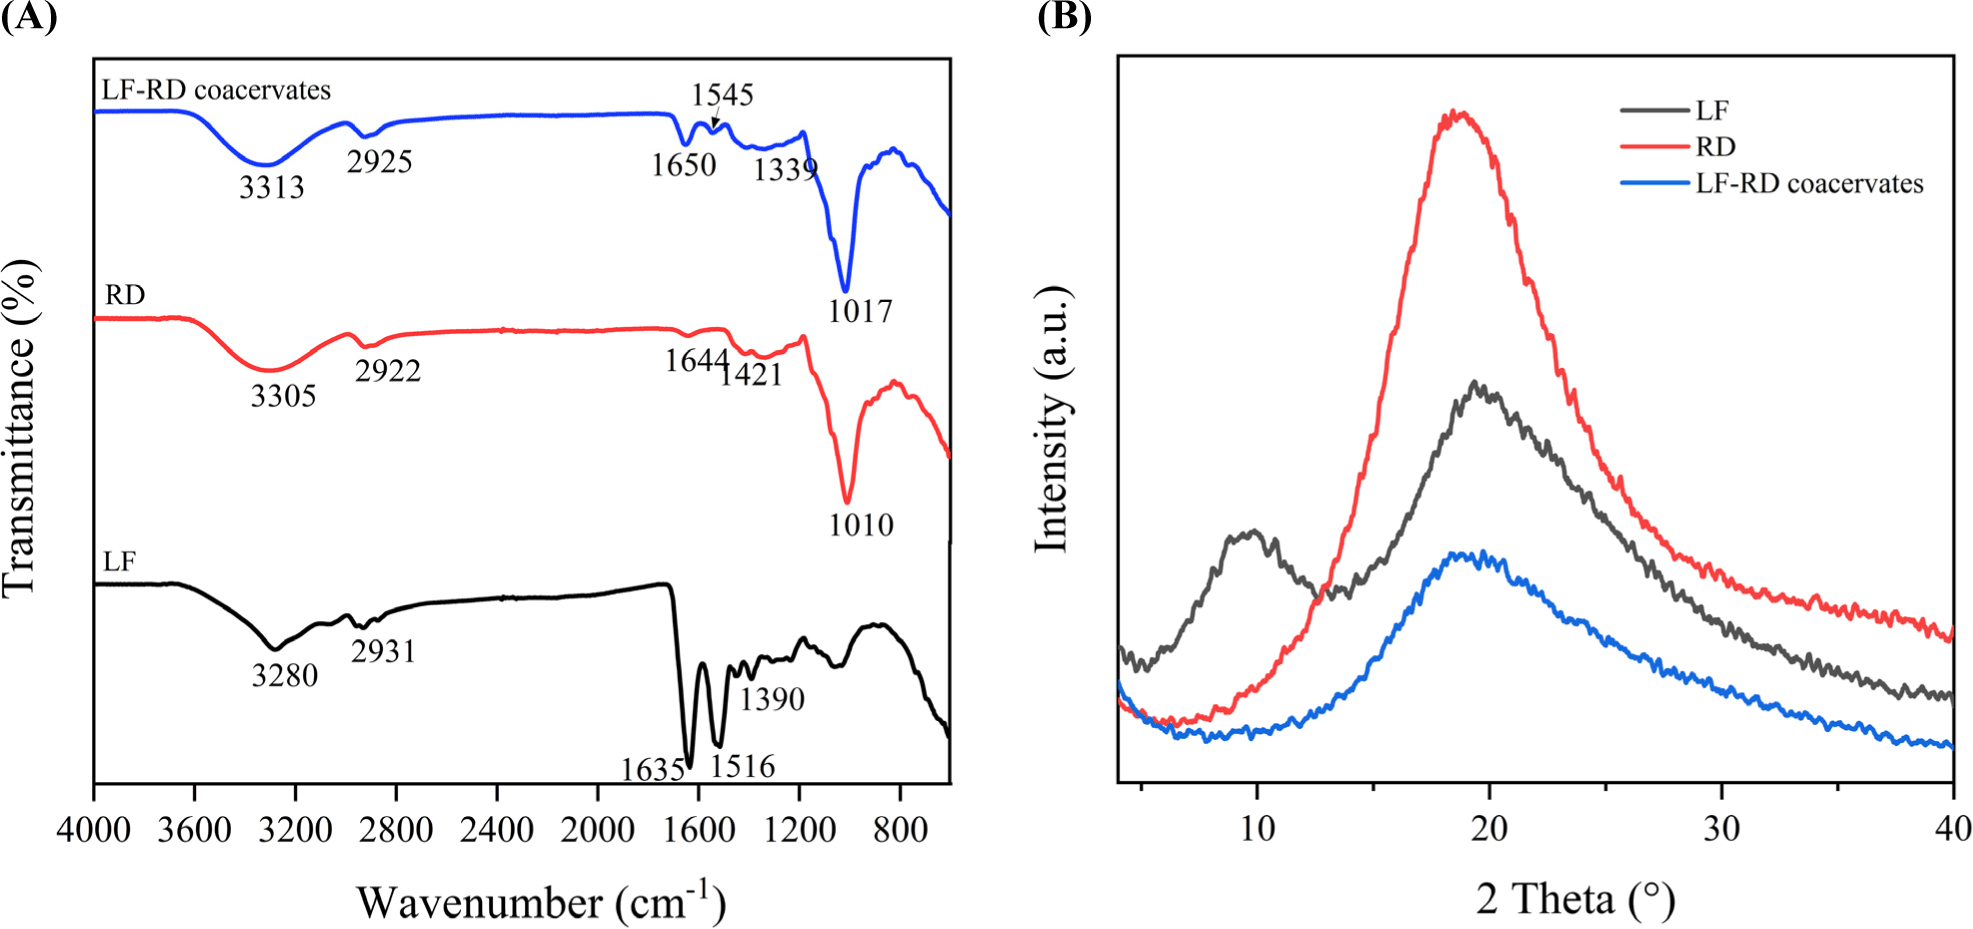
The spectrum of the LF-RD coacervates demonstrated a combination of characteristic peaks from LF and RD, even though with slight shifts compared to LF and RD individually. Specifically, the absorption bands at 1,644 and 1,421 cm−1, typical of RD molecules, disappeared in the LF-RD coacervate spectrum. Additionally, the peaks corresponding to Amide I (1,650 cm−1) and Amide II (1,545 cm−1) in LF-RD coacervate displayed shifts relative to those in LF (1,635 and 1,516 cm−1), indicating the occurrence of electrostatic interaction between the amino group of LF and the carboxylic group of RD (Constantino and Garcia-Rojas, 2023). Moreover, the band in LF at 3,280 cm−1 shifted to 3,313 cm−1 in LF-RD coacervate, suggesting the formation of a hydrogen bond (Sun et al., 2017). It is noteworthy that no new peaks emerged, signifying the absence of chemical bonds or chemical groups. Based on all of the findings from the FTIR analysis, it can be concluded that hydrogen bonding, in addition to electrostatic interactions, significantly contributes to the formation of complex coacervates.
X-ray diffraction was utilized to assess the crystallinity level and differentiate between amorphous and crystalline properties. The presence of sharp peaks in the X-ray diffractogram (XRD) indicated a crystalline arrangement, whereas broad peaks suggested an amorphous structure. As illustrated in Fig. 3B, LF exhibited two flat crystal peaks at diffraction angles 2θ of 9.9° and 19.3°, suggesting the protein’s amorphous characteristics. On the other hand, the RD diffractogram displayed a prominent peak at 19.2° (2θ), potentially enhancing electrostatic interactions owing to the existence of covalent bonds (Hasanvand and Rafe, 2018). Nevertheless, in the XRD curve of the LF-RD complex, the characteristic crystallization peak of LF at 9.9° nearly vanished, displaying a considerably reduced peak intensity compared to LF and RD individually. This suggests a transition of the molecular structure of the complex to a more amorphous state. Presumably, the LF molecule chains were closely absorbed by the RD molecules, resulting in the formation of an amorphous complex between LF and RD by intermolecular interaction (electrostatic attraction and hydrogen bonding). The XRD findings were in agreement with the FTIR data in this study, and similar conclusions have been documented by Li et al. (2021b).
The surface morphology of LF, RD, and LF-RD complex coacervates was visualized using SEM. As shown in Fig. 4A, the LF exhibited a smooth lamellar structure without any visible cracks on the surface. A comparison with LF-RD complex coacervates (Fig. 4C, red circles) revealed that the sheet-like structure of LF was thinner than that of the LF-RD complex coacervates. Moreover, the surface of LF-RD complex coacervate displays a porous texture, which is attributed to the ice crystals or bubbles evaporating during the freezing process. These pores on the surface act as conduits facilitating the diffusion of oxygen from the atmosphere into the interior of the particle (Xiao and Ahn, 2023). Meanwhile, Figs. 4D and E shows that the surface of the coacervate showcases a concave spherical morphology resembling RD particles (yellow circles), accompanied by distinct three-dimensional (3D) spatial arrangements (blue circles). It is postulated that the unique 3D microstructure contributes to the improved thermal stability observed in the LF-RD coacervate formation. These observations provide further evidence of strong interactions between LF and RD.
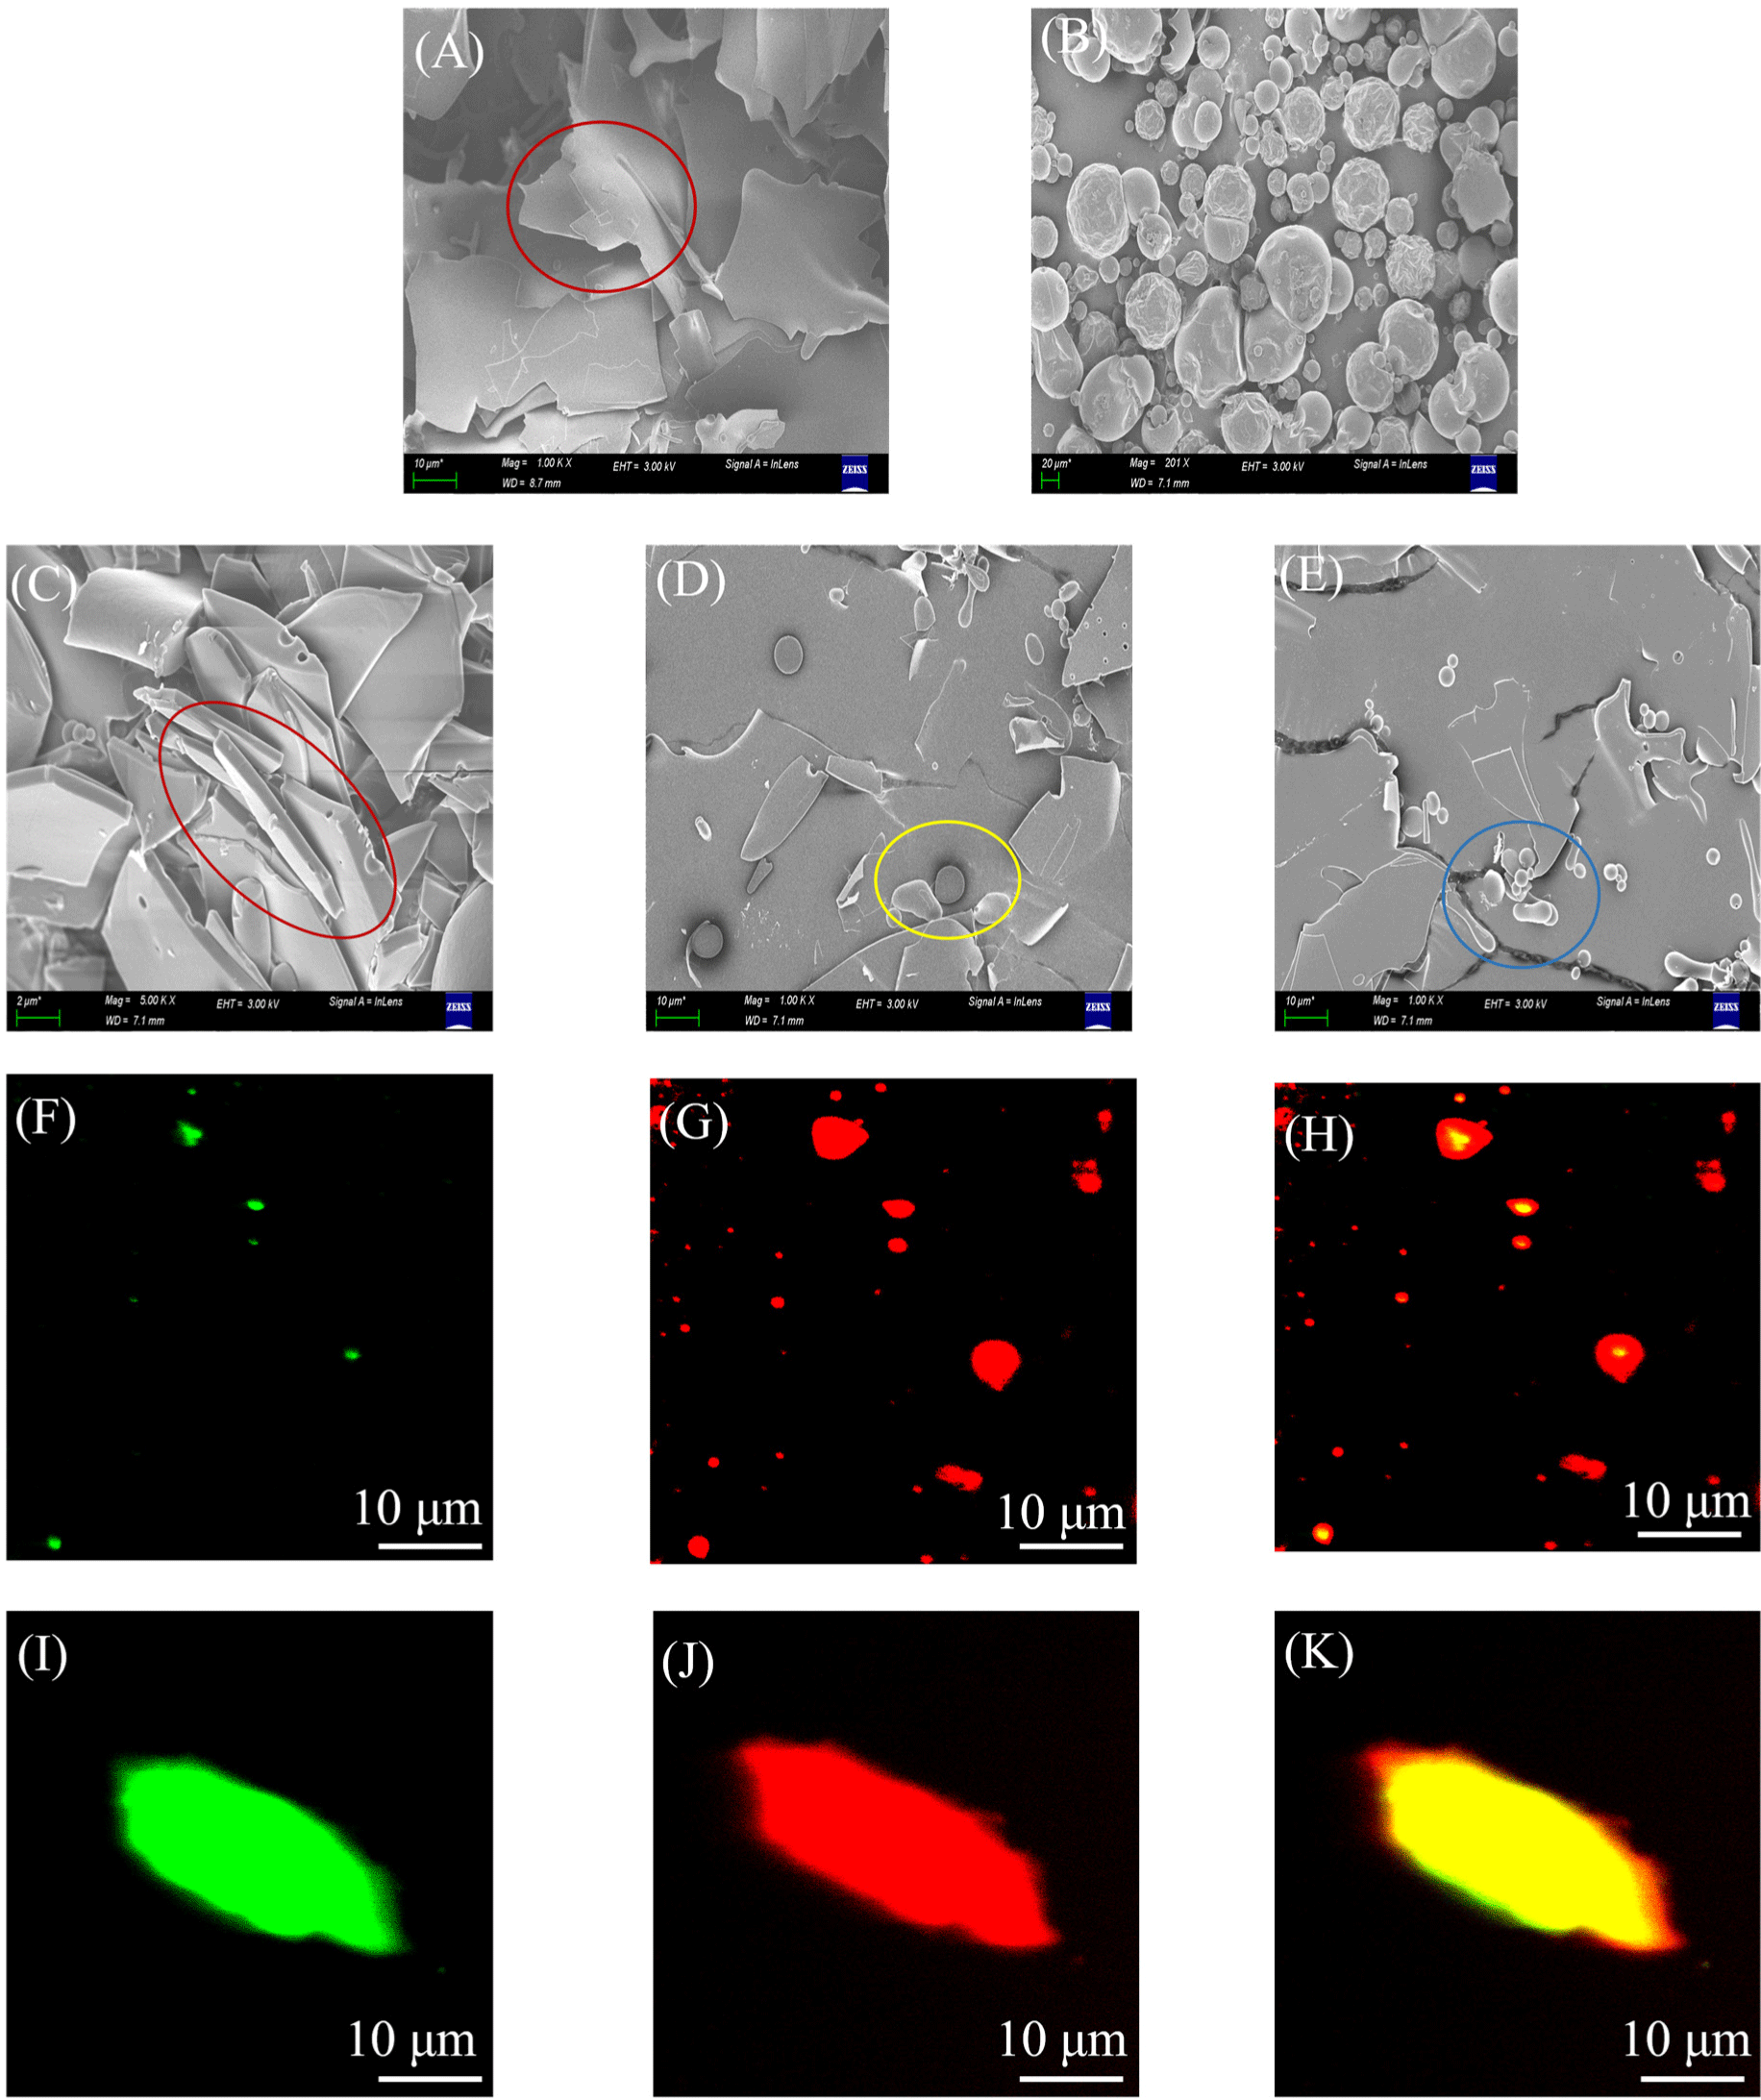
Using the label distribution of fluorescent colors, CLSM was employed to further analyze the microstructure of the LF-RD complex coacervates. Figs. 4F, G, and H shows the fluorescence images of the LF-RD complex observed at different emission wavelengths. Specifically, Fig. 5F shows Nile blue-labeled LF emitting green fluorescence, Fig. 4G displays 5-aminofluorescein-labeled RD emitting red fluorescence, and Fig. 5H presents LF-RD complexes under the effect of the two fluorescent dyes. The yellow fluorescence appearing in the field of view is attributed to RD being wrapped around the surface of aggregated LF through electrostatic and hydrogen bonding interactions, resulting in a core-shell structure with LF as the core and RD as the shell. At higher concentration of LF-RD complex solution (1%, w/v), both LF and RD underwent a large area of agglomeration, revealing a pronounced formation of a tight and continuous membrane by RD, completely enveloping LF within it (Figs. 4I, J, and K). These CLSM images validate the inferences drawn from the XRD curves. Consequently, on the basis of the aforementioned findings, it can be inferred that the LF-RD complex was effectively synthesized.
The surface hydrophobicity of LF exhibited a corresponding increase with rising concentration of RD, as illustrated in Fig. 5A. This observation can be attributed to the electrostatic complexation that occurs between LF and RD upon the introduction of RD, which facilitates the unfolding of LF molecules and the subsequent exposure of their hydrophobic regions. This exposure facilitates the occurrence of hydrophobic interactions. With increasing RD concentration, complexation became stronger, resulting in greater exposure of the hydrophobic regions and consequently stronger hydrophobic interactions, ultimately facilitating the formation of protein aggregates. This observation aligns with the findings obtained from the turbidity measurements. Moreover, during this process, LF exhibits a positive zeta potential, whereas ANS acts as an anion that can electrostatically interact with LF, thereby contributing to an elevated hydrophobicity. The schematic model for the interaction of LF and RD has been shown in Fig. 6. Naderi et al. (2020) similarly observed that the surface hydrophobicity of the complex formed by oak protein isolate and gum arabic was greater than that of the oak protein isolate solution.
The foaming properties of LF-RD complex coacervates were studied by preparing LF foams before and after combined with RD, and recording their appearance data. The findings presented in Fig. 5B demonstrate that the addition of RD notably enhanced both the foam ability and foam stability in comparison to LF alone. Specifically, the foam ability of LF increased from 51.2% to 63.5% upon incorporation of RD, representing an increase of 12.3%. The enhancement of LF foaming may be attributed to the rapid conformational alterations and rearrangement of LF at the air-water interface post-compounding with RD (Razi et al., 2019). This process results in the formation of a viscoelastic film through intermolecular interactions, enhancing the stability of the interface layer (Dickinson, 2011). Furthermore, the enhanced stability of the foam was linked to the interactions of proteins and polysaccharides, which could enhance the stability of the interfacial layer, resulting in a more stable foam to prevent bubble coalescence (He et al., 2021). Compared to the findings of Yan et al. (2022), the improvement of foaming properties was observed in this study following LF coacervation with RD. This finding is of great significance for promoting the development of all-natural functional foaming agents.
Similarly, the impact of RD on the emulsifying properties of LF was further analyzed. Fig. 5B shows that upon interaction with RD, the EAI and ESI of LF increased by around 14.1% and 147.0%, respectively. These notable enhancements in the emulsification properties stand in contrast to the findings of Li et al. (2021c), which indicated that the coacervation of hyaluronic acid with LF did not lead to a substantial enhancement in the emulsification properties (EAI and ESI) of LF. Zhu et al. (2017) pointed out that surface hydrophobicity is positively correlated with the EAI and ESI, aligning with the emulsification findings presented in this research. Data from external fluorescence spectroscopy indicated an increase in the hydrophobicity of LF with the addition of RD. Consequently, increasing the protein’s surface hydrophobicity is advantageous for enhancing its emulsification index. As reported by He et al. (2021), the mechanism of stable emulsion by polysaccharides involves two main aspects. Firstly, polysaccharides have the capability to attach to the droplet’s surface, forming a protective barrier that aids in stabilizing the oil droplet by means of steric hindrance. Secondly, polysaccharides may create a dense and substantial interface layer encasing the oil droplet, which not only enhances dimensional stability but also helps prevent protein aggregation and flocculation.
DSC thermograms were employed to analyze the thermal stability of the LF, RD, and LF-RD coacervates. As depicted in Fig. 7A, the RD thermogram revealed an endothermic peak at 94.99°C as a result of the free water release from the RD powder. In contrast, the DSC curve of LF displayed a wide endothermic peak at 85.57°C, which was attributed to the denaturation of LF. The thermal denaturation of LF is known to be affected by various environmental factors, including pH, ionic strength, and conformational state (Native, Holo, and Apo; Santos et al., 2021). In the complex coacervate, the first peak at 72.14°C was attributed to the evaporation of free water from the sample matrix, whereas the second peak at 154.43°C was related to the denaturation of the complex coacervates. The increased temperature for denaturation noted in the complex coacervates might result from the electrostatic interactions and hydrogen bonds between LF and RD, contributing to a more stable network structure (Dong et al., 2023).s This discovery aligns with previous reports that complex coacervation with polysaccharides can enhance the thermal stability of proteins (Li et al., 2024, Lin et al., 2022).
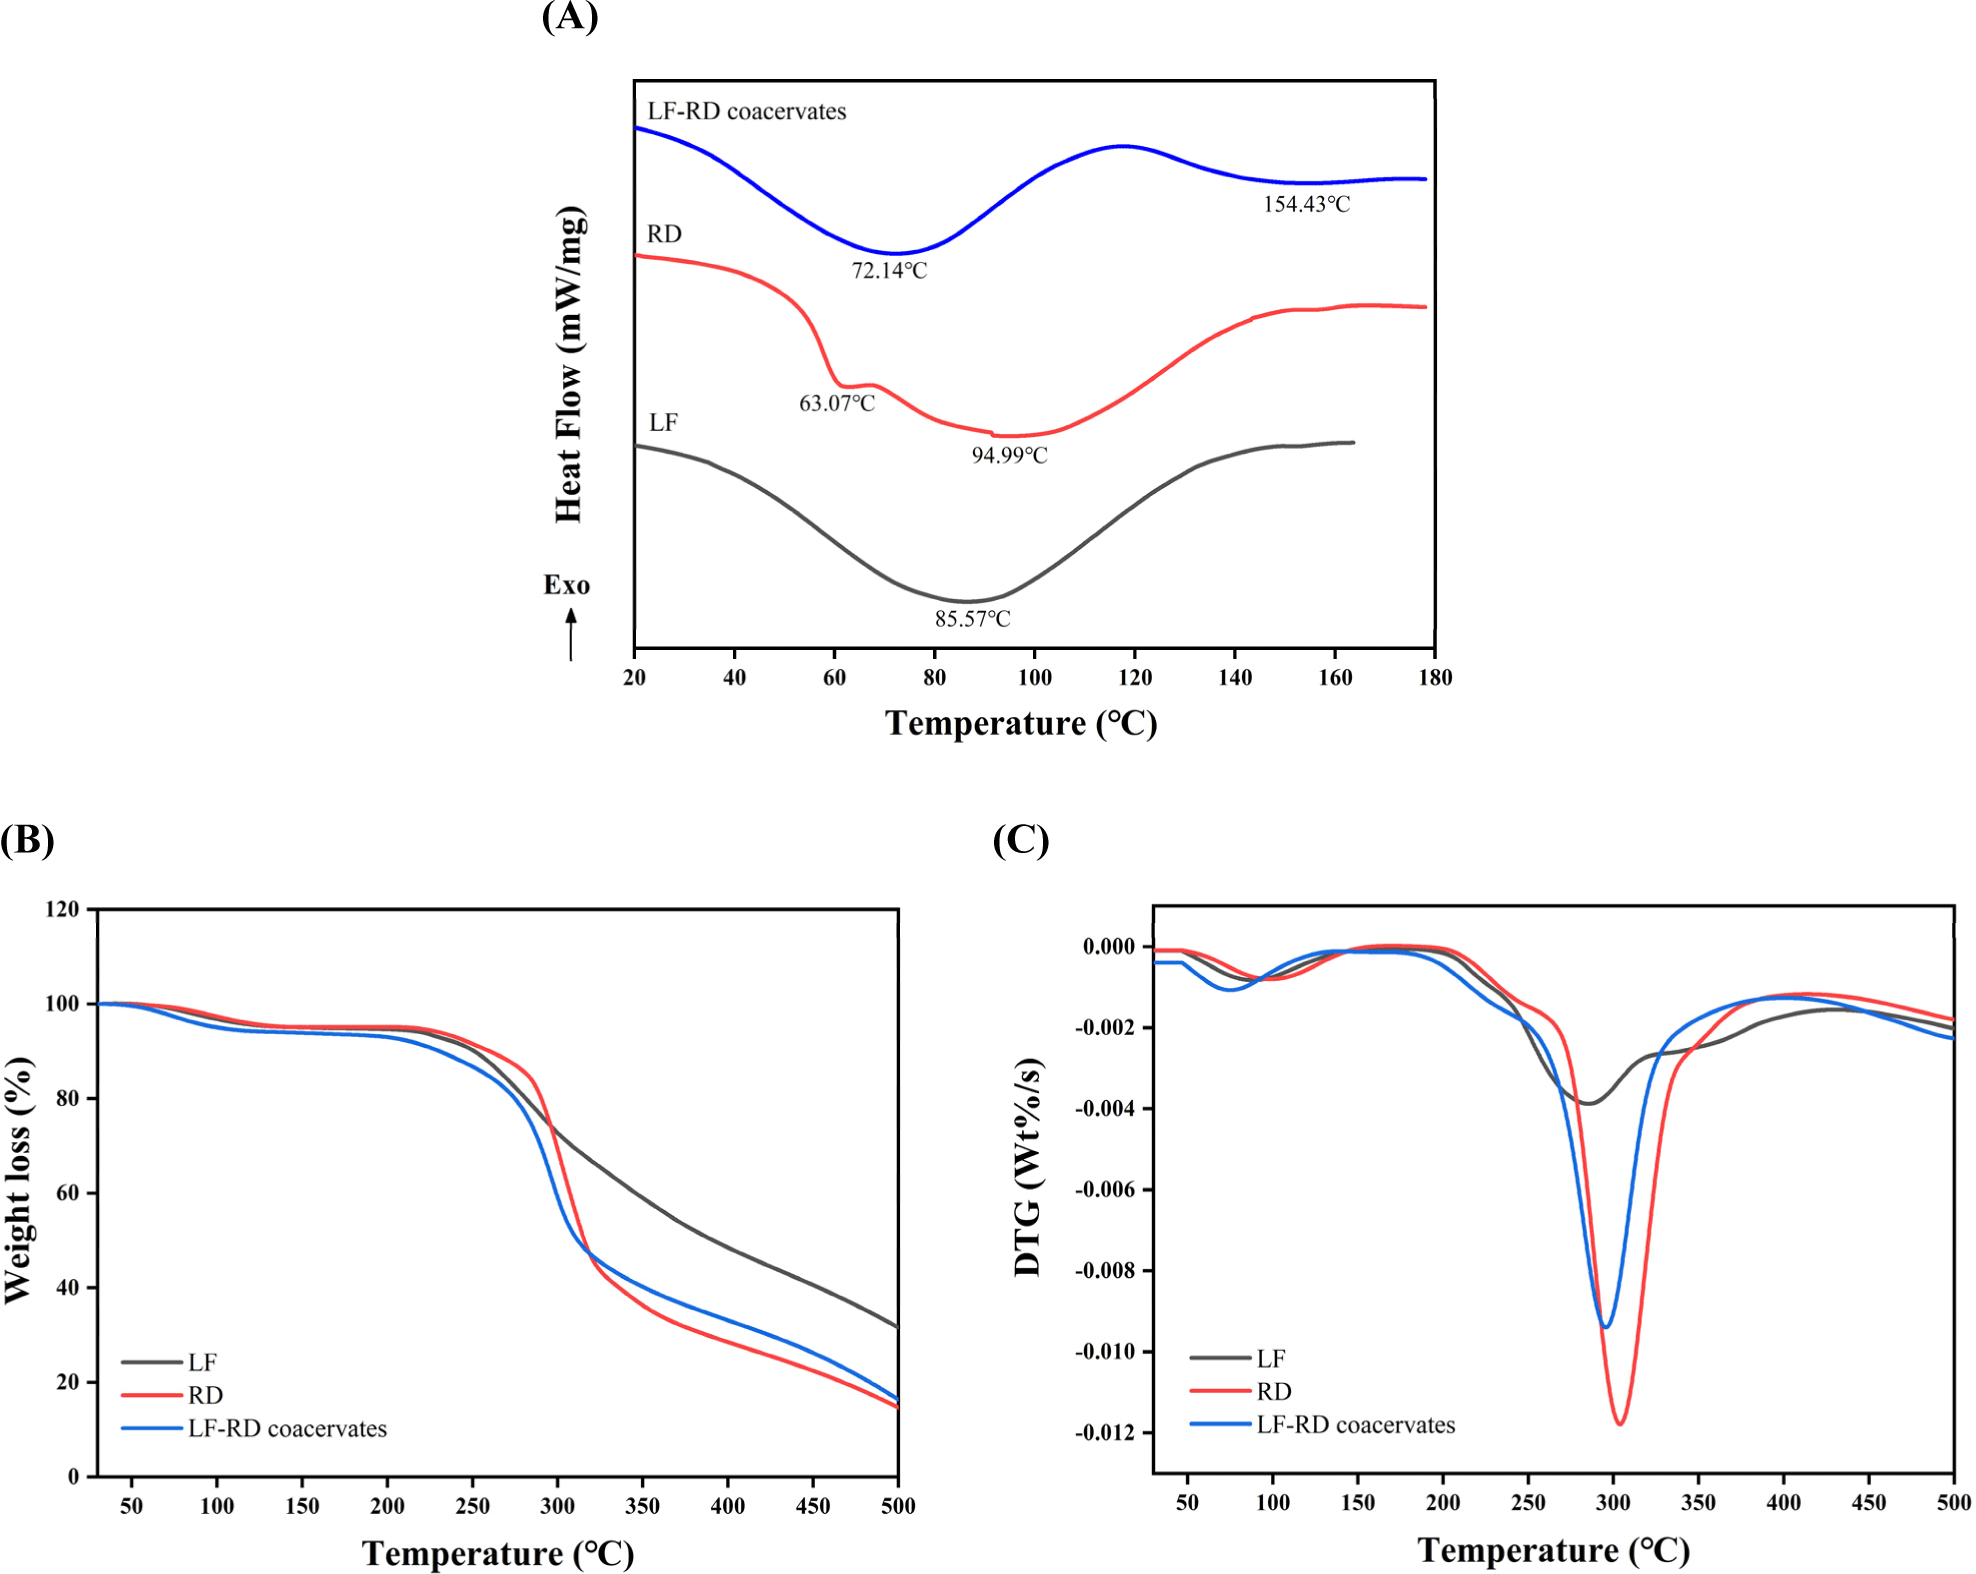
The TGA and derivative thermogravimetric curves presented in Figs. 7B and C delineated a two-stage decomposition process occurring within the temperature range of 30°C–600°C. The initial stage, spanning 30°C–150°C, was characterized by weight loss attributed to the discharge of remaining moisture within the samples. Subsequently, a significant and rapid weight loss was observed in the subsequent phase, commencing at approximately 200°C, indicating the breakdown of samples. The degradation of the coacervate is primarily attributed to the decomposition of LF and RD. In the case of LF, degradation occurs through the breakdown of non-covalent electrostatic bonds and hydrophobic interactions, followed by the disruption of the covalent bonds of amino acid residues with increasing temperature (Li et al., 2020). In addition, the temperature corresponds to the maximum weight loss rate (Tmax) that occurs for the LF and LF-RD complexes are 285°C and 296°C, respectively. The Tmax of the complex surpasses that of LF alone, aligning with the findings from the DSC analysis. Therefore, the LF-RD complex coacervate exhibits potential for encapsulating a wide range of heat-sensitive compounds including fragrances, essential oils, and bioactive compounds.
The antioxidant activity of LF can be attributed to the presence of sulfhydryl groups in its amino acid composition, particularly methionine and cysteine, which function as antioxidants through reduction reactions (Elias et al., 2008). As shown in Fig. 8A, the DPPH radical scavenging activities of GA, used as a standard control, exhibit a substantial capacity for radical scavenging. It is important to highlight that the DPPH scavenging activity of LF was observed to a significantly enhanced following coacervation with RD, indicating a potential synergistic effect between LF and RD. This synergistic interaction may facilitate the unfolding of the LF molecular structure, thereby exposing more hydrophobic groups that can interact with fat-soluble DPPH free radicals, ultimately improving its scavenging capacity (He et al., 2023). Furthermore, the complex coacervation of LF with RD introduced additional hydroxyl groups, which are conducive to terminating free radical chain reactions, thereby imparting the LF-RD complex with enhanced free radical scavenging activity. In alignment with the findings related to DPPH, the ABTS free radical scavenging rate of LF was recorded at 24.68±0.95%, whereas its radical scavenging capacity increased to 34.51±1.44% after complexation with RD, representing an enhancement of 39.8% (Fig. 8A). Furthermore, GAE was employed to estimate the antioxidant activity of the LF-RD complex coacervates. As depicted in Figs. 8C and D, a strong linear relationship was observed between the concentration of the GA standard and its absorbance. Within the examined concentration range, the linear regression equation for the DPPH assay is y=–0.01204x+1.0294 (r2=0.9954), and for the ABTS assay, it is y=–0.00244x+0.6486 (r2=0.9932). Consequently, the DPPH and ABTS free radical scavenging capacities of the samples can be quantified as GAE using the standard curve, thereby providing an indication of their antioxidant activity. As shown in Fig. 8B, LF exhibited a notable enhancement in antioxidant activity following complexation with RD, demonstrating a 35.9% increase in DPPH radical scavenging activity and a 38.7% increase in ABTS radical scavenging activity. And a similar trend is observed with the DPPH and ABTS scavenging rate in Fig. 8A. These findings indicate that the complex coacervates formed by the combination of LF and RD may function as effective carriers for the encapsulated delivery of unstable bioactive ingredients, such as omega-3, 6 fatty acids or curcumin.
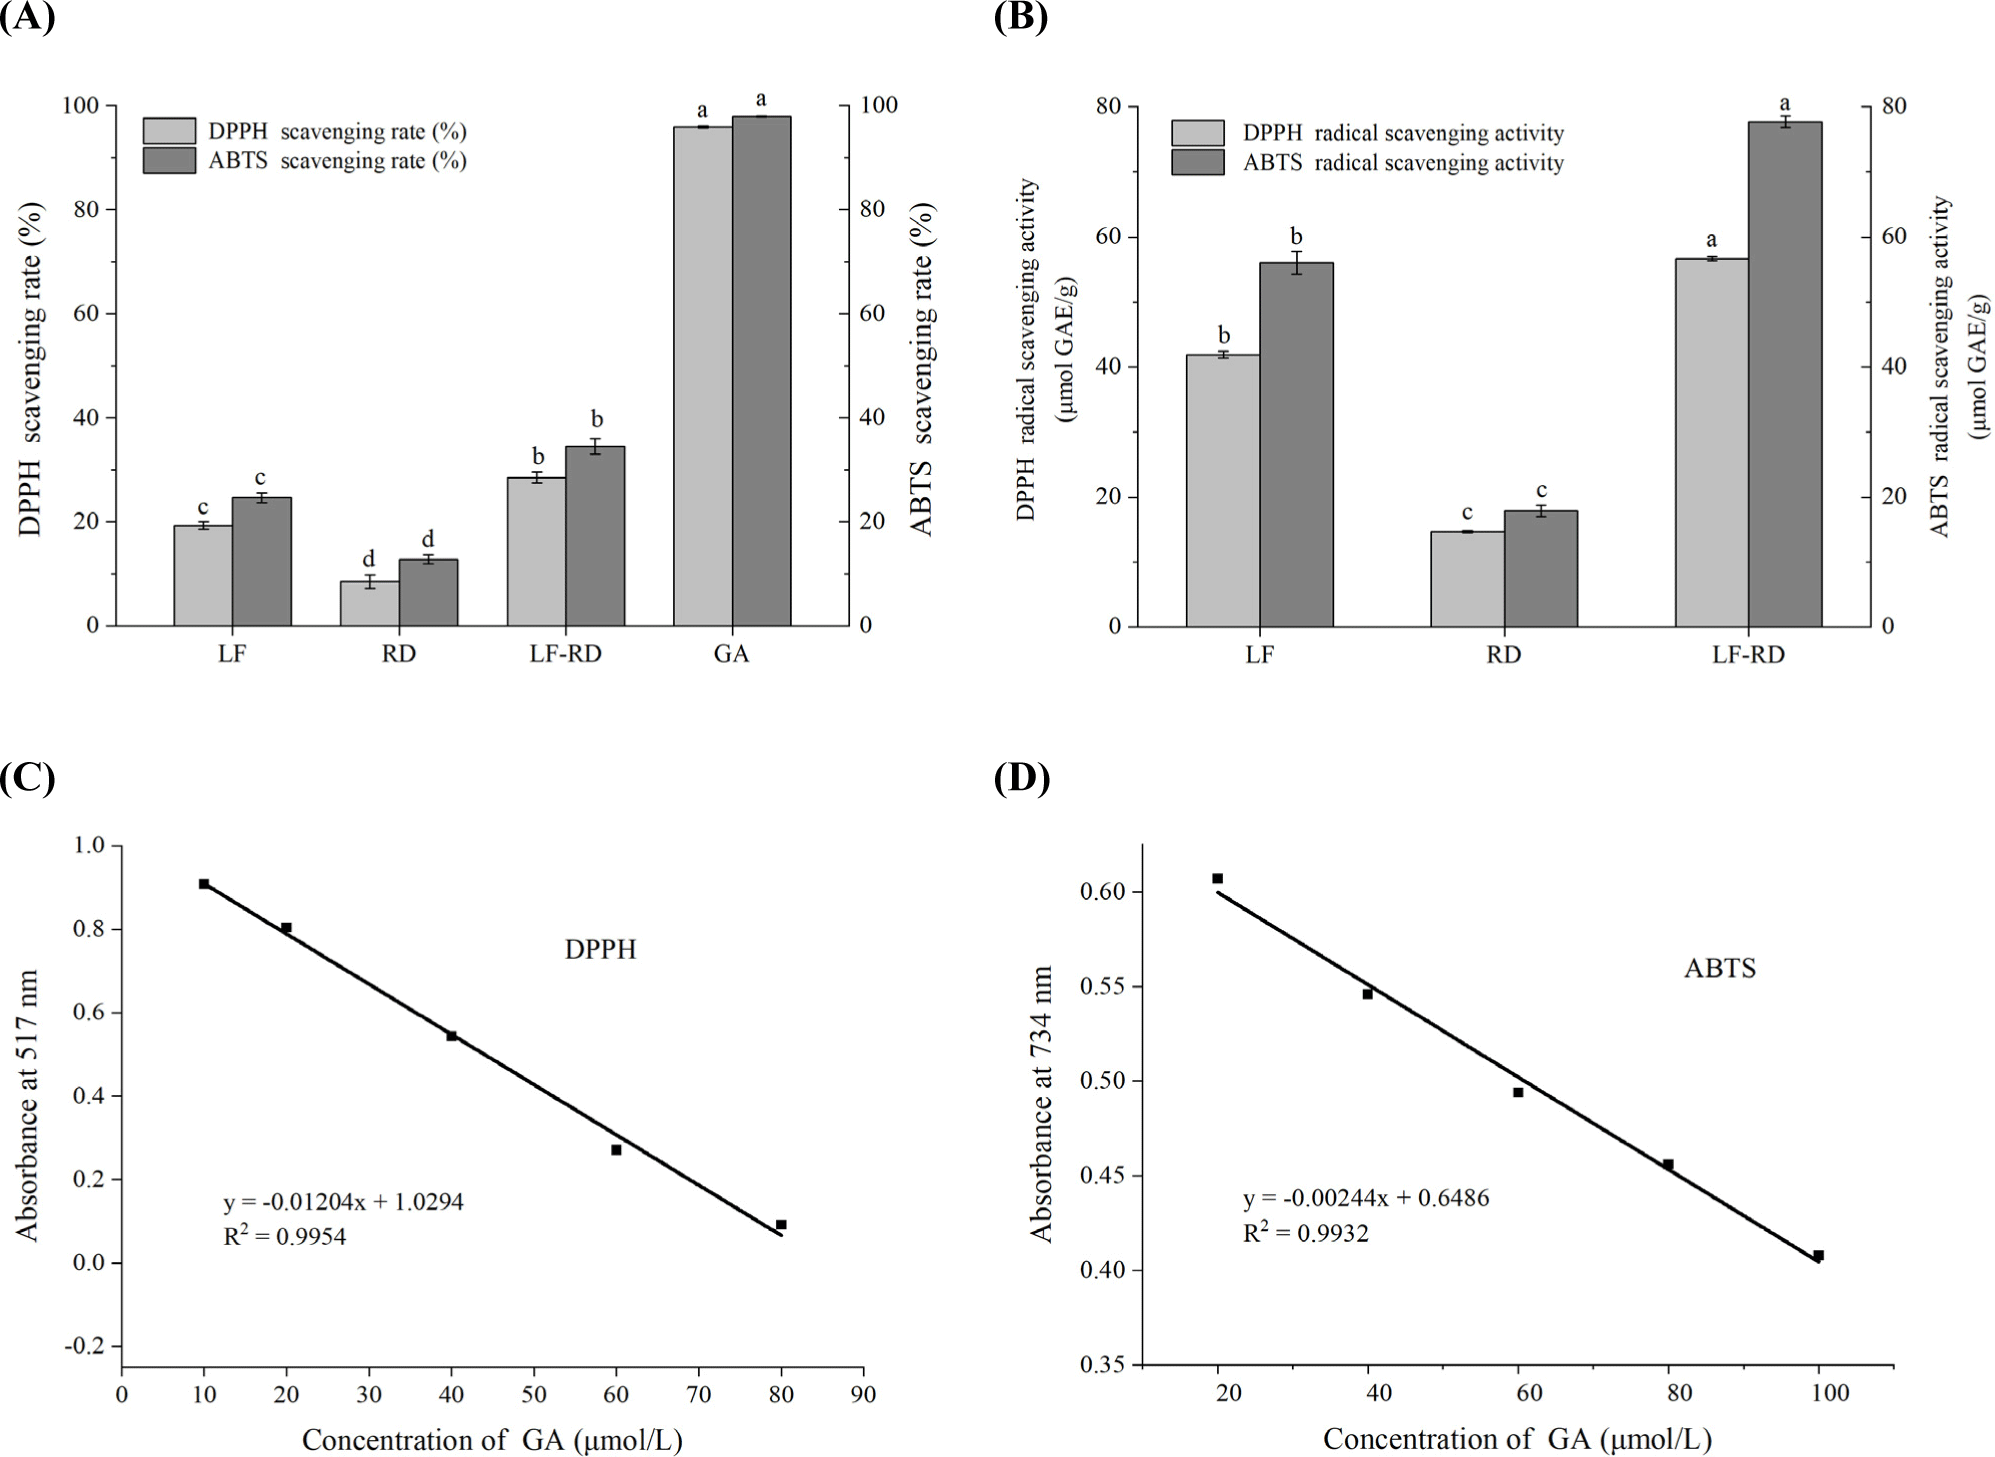
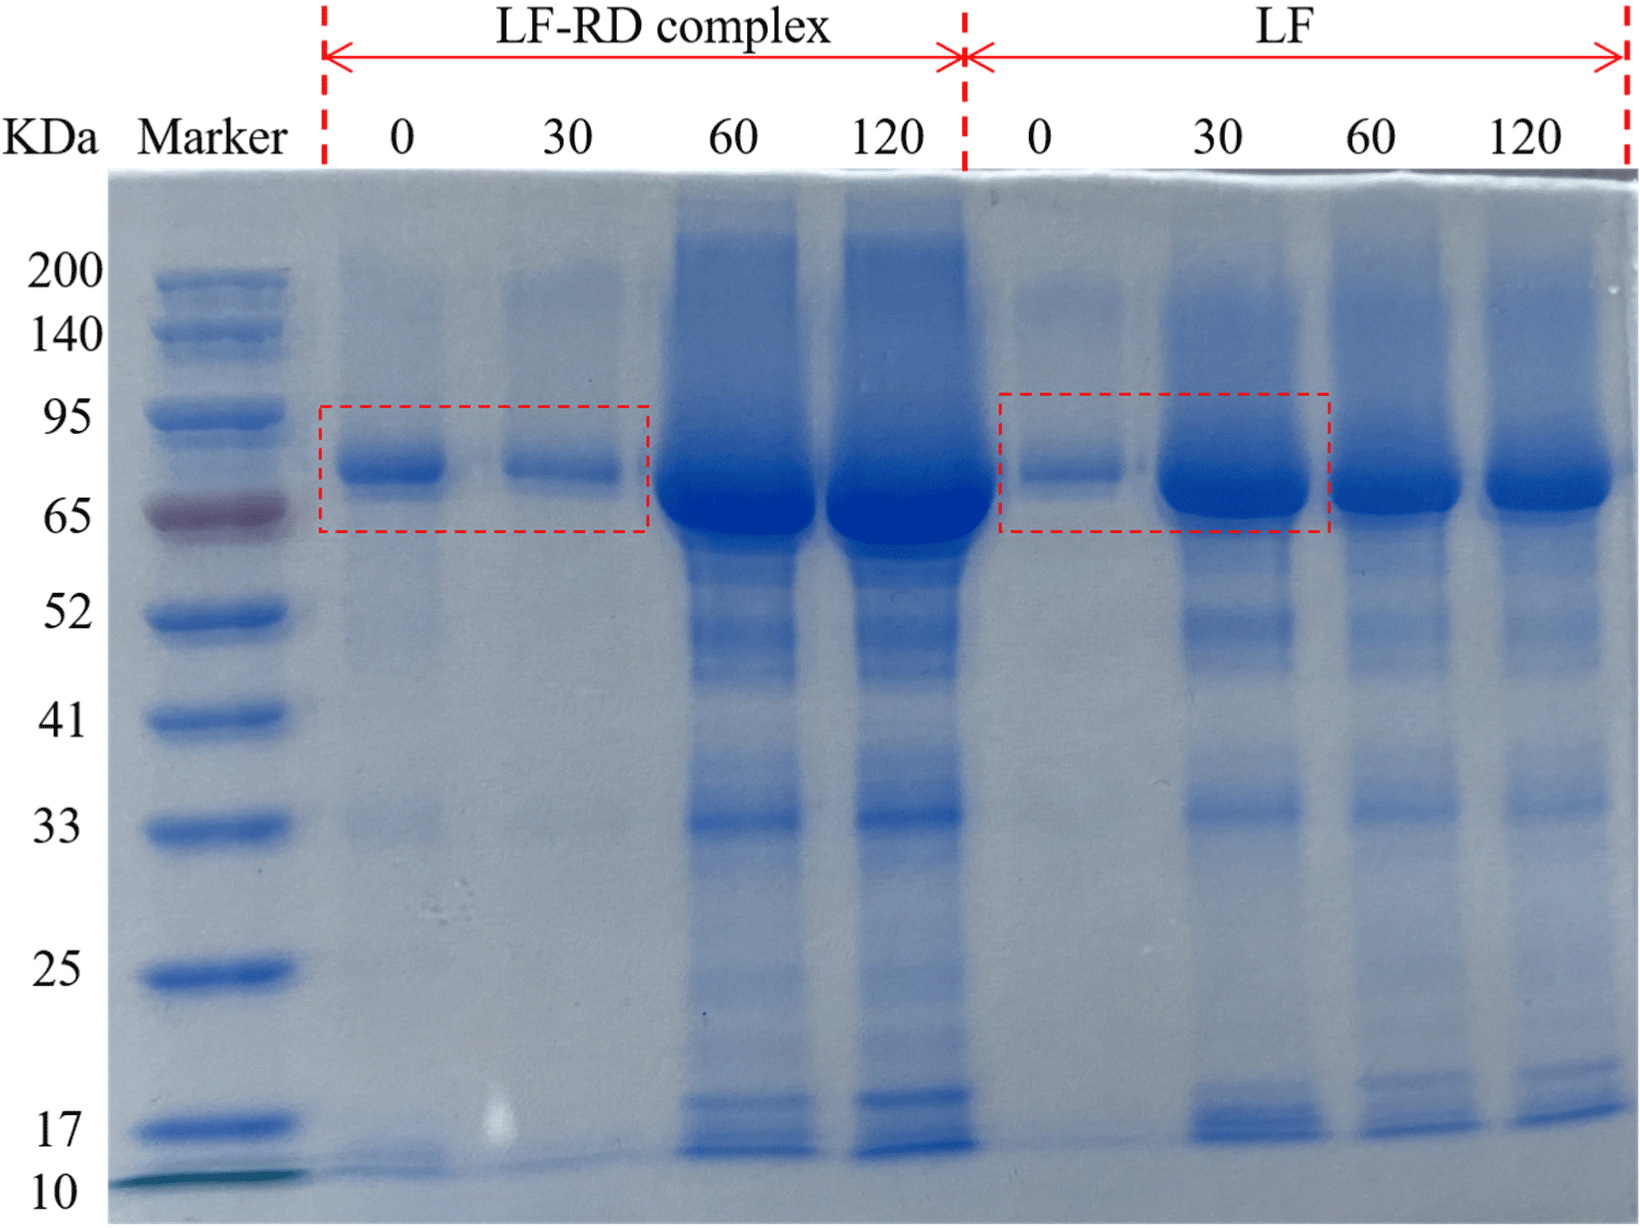
Fig. 9 illustrates the degradation patterns of LF and LF-RD complex coacervates during the gastric digestion phase. LF displayed a prominent band at around 80 kDa, while the band after LF complexed with RD showed a slight upward shift, indicating the formation of higher molecular weight complexes. Notably, after 30 min of gastric digestion, the complexes formed by LF and RD maintained intact LF bands (red dashed box), suggesting a degree of resistance to pepsin hydrolysis. This resistance may be attributed to the encapsulation of LF by certain RD molecules, which could partially shield the active sites of gastric proteases, thereby enhancing LF’s resistance to protein hydrolysis. However, this protective effect appeared to diminish over time, with the LF-RD complex coacervates eventually degrading similarly to LF alone. Similar findings by David-Birman et al. (2013) demonstrated that HMP-coated LF particles did not protect LF from immediate pepsin digestion, whereas LMP-coated LF particles still exhibited a complete LF signature band after 10 min of pepsin digestion. And, beyond this duration, no LF signature band was detectable, which is consistent with the results observed in the current study. Overall, the coacervation process involving LF and RD is expected to regulate the digestion rate of LF. This mechanism may prove to be a viable approach for managing LF digestion, thereby facilitating the delivery of intact LF to the upper gastrointestinal tract.
Optical microscopy images of DHA microcapsules encapsulation process are presented in Figs. 10A, B, anc C, with red circles indicating the presence of oil droplets. Following the emulsification process (Fig. 10A), numerous spherical particles characterized by well-defined walls and a singular core were observed. However, some of the LF-DHA droplets exhibited aggregation, resulting in irregular shapes. After complex coacervation, a denser wall formed around the oil droplets, attributable to the interaction between RD and LF. Concurrently, the droplets were uniformly dispersed within the emulsions, adopting a completely spherical shape. Notably, the size of the emulsion post-complex coacervation was marginally larger than that of LF-DHA, indicating a successful integration of LF and RD. This observation is consistent with previously obtained particle size results. Moreover, the presence of transglutaminase facilitates a tighter binding of the condensates through the cross-linking of LF, resulting in the formation of a denser wall around the oil droplets (as shown in Fig. 10C).
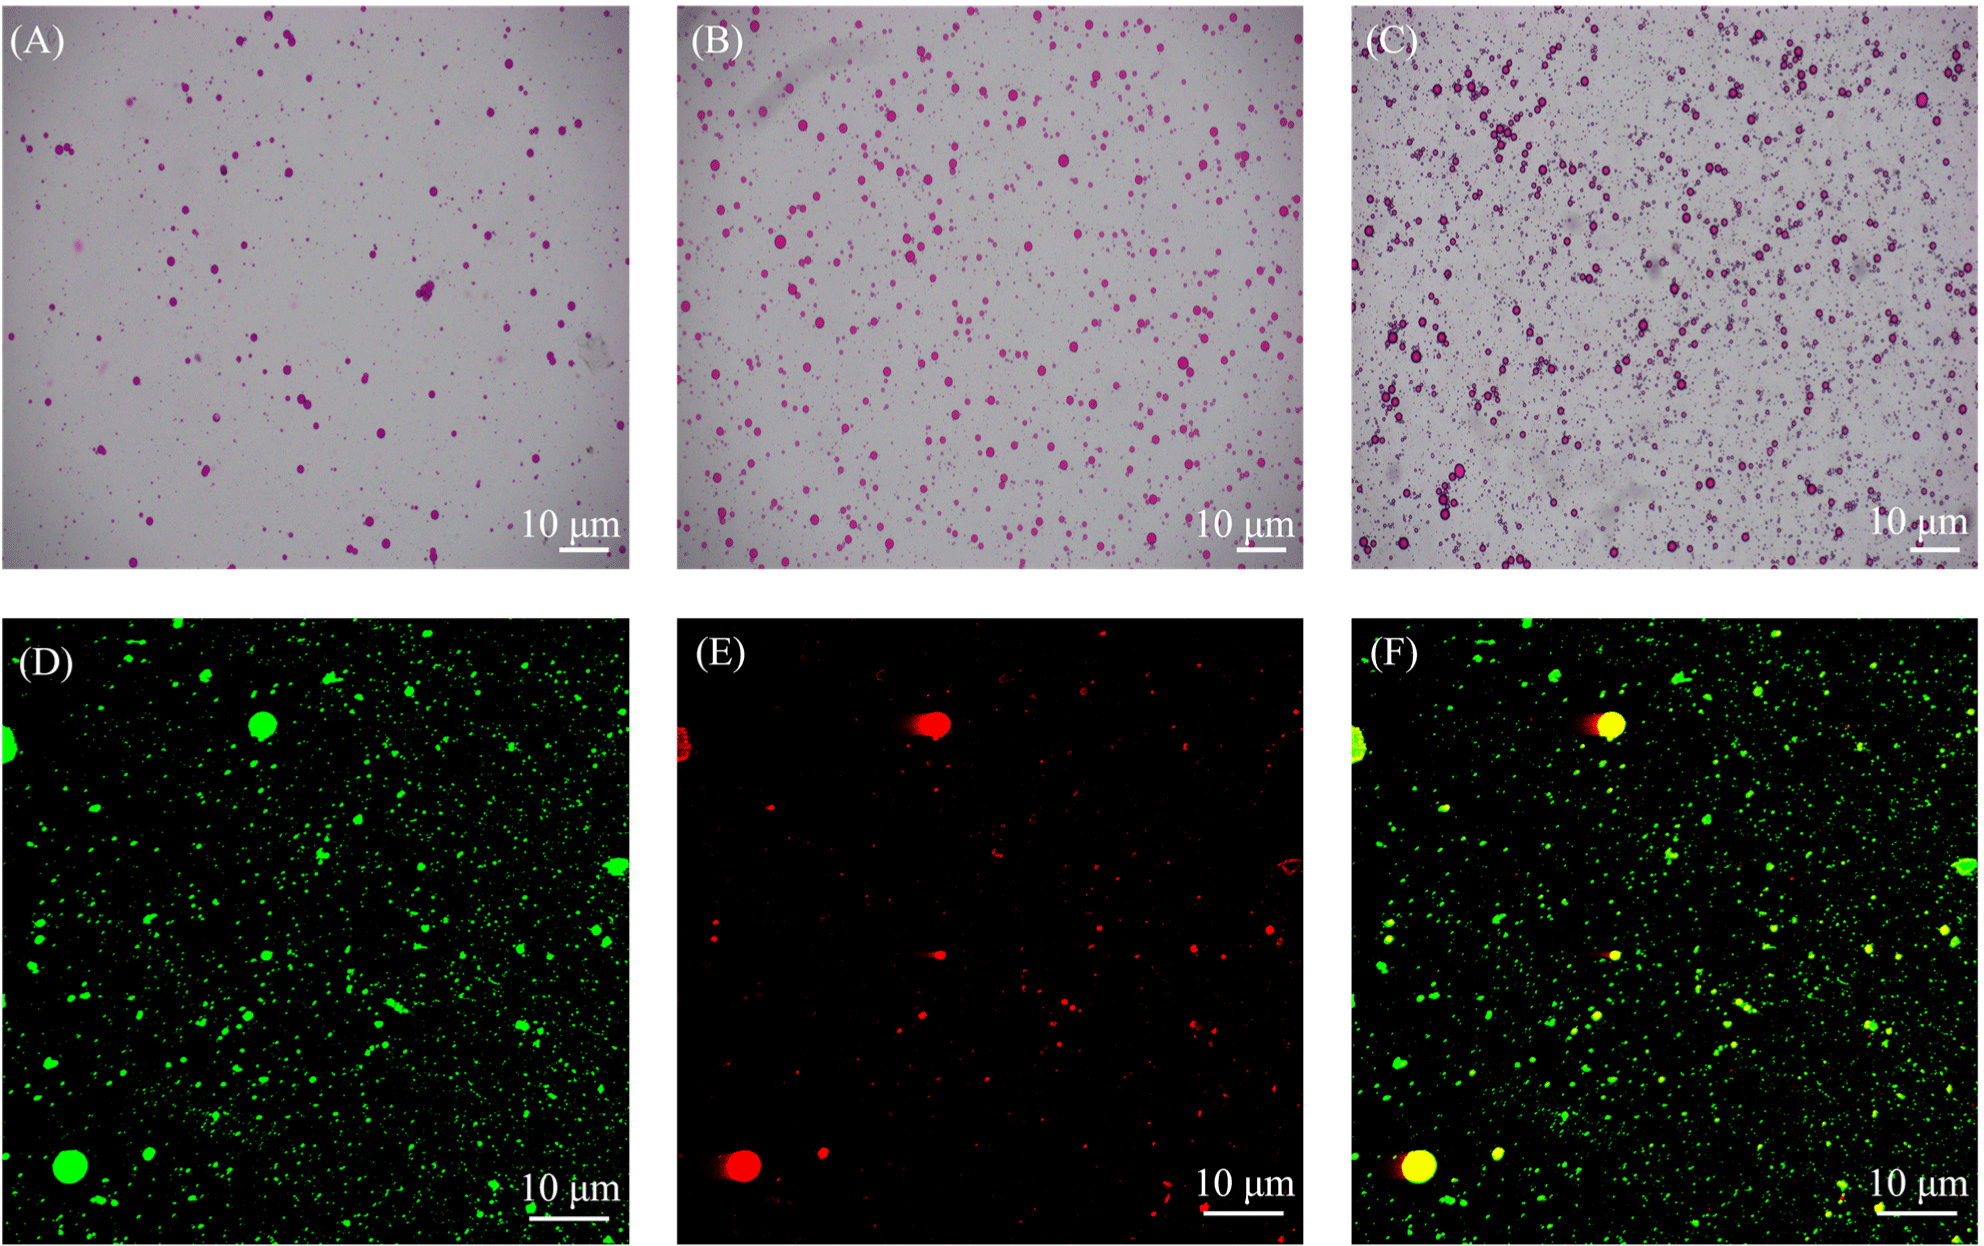
The fluorescence micrograph of DHA microcapsules is depicted in Figs. 10D, E, and F. Where the aqueous protein phase was shown in green and the oil phase was shown in red in the figure. It is evident that the DHA microcapsules were well dispersed in the emulsion without significant aggregation. The microstructural analysis revealed an inner oil phase encased by an outer protein phase, indicating that the LF-RD complex coacervates effectively functions as a carrier for the successful encapsulation of DHA. With favorable morphological characteristics, DHA microcapsules also demonstrated a notable encapsulation efficiency of 89±3.4%, surpassing the encapsulation efficiency of black pepper essential oil within LF-sodium alginate complex coacervates as reported by Bastos et al. (2020). Jensen et al. (2005) reported that maternal supplementation with DHA during pregnancy, breastfeeding, or the consumption of DHA-enriched formula can elevate DHA levels in infants, thereby facilitating improved visual and cognitive development. Consequently, the findings presented in this study hold considerable importance.
Conclusion
This study demonstrated that LF can form complex coacervates with RD, thereby enhancing the thermal stability and functional properties of LF, including its foaming and emulsifying capacities. It was observed that both the LF to RD ratio and pH significantly influenced the extent of coacervation. Notably, at a pH of 7.0 and an LF:RD ratio of 1:12, the LF-RD complex coacervate achieved a zeta potential close to zero, displaying maximum turbidity, particle size, and coacervate yield. Moreover, the binding process of LF and RD involved an increase in the hydrophobicity of the LF surface and a modification of LF conformation. The negative ΔG values suggested that the binding of LF to RD was spontaneous and thermodynamically favorable. In addition to electrostatic complexation, the formation of LF-RD complex coacervates was also facilitated by hydrophobic interactions and hydrogen bonding. Furthermore, following complex coacervation with RD, LF exhibited superior thermal stability, antioxidant properties, stability in the gastric environment, as well as improved foaming and emulsifying properties. Microscopic analysis of the LF-RD coacervate revealed distinct 3D spatial structures, with fluorescence co-localization confirming the formation of a complete core-shell architecture. Results from optical microscopy and CLSM showed that the LF-RD complex effectively encapsulated DHA. This study provides a theoretical framework for the potential application of microencapsulated DHA utilizing LF-RD complex coacervates in infant formula.