


Introduction
Sheep meat is an important and popular diet in meat food, which has lower fat and higher protein contents compared with other meat types. In recent years, sheep meat consumption has increased, and consumer demand for sheep meat has shifted from price to quality (Wuren, 2017; Zeng et al., 2016). Therefore, rapid detection of sheep meat quality is vitally important for the meat industry.
The pH, color, water holding capability (WHC), and tenderness are common quality parameters and the protein, fat, and moisture are major nutritional components, which are important factors affecting meat eating quality (Che et al., 2016). Traditional methods, such as the cooking method for WHC detection, the shear force method for tenderness evaluation, the Kjeldahl determination for crude protein content determination, the Soxhlet method for crude fat content determination, and the oven drying for moisture content evaluation, are high-cost and time-consuming (Khaleduzzaman and Salim, 2020; Song et al., 2000; Zhao et al., 2018). In addition, chemical agents used in the process of the above measurements contaminate and destruct meat samples.
Visible and near infrared spectroscopy (Vis/NIRS), a rapid, non-destructive, and safe spectroscopic technology, has become increasingly popular for quantitative meat quality analysis with advances in hardware and chemometrics, and especially has potential for simultaneous detection of multiple parameters in meat industry (Dixit et al., 2017; Furtado et al., 2019). The spectral information collected using a spectroscopic device could analyze the chemical substances in meat. Vis/NIRS technology has been commonly applied in meat industry for the routine analysis of the meat and meat products composition. Previous reports on the application of Vis/NIRS to meat quality detection have shown reasonable relevance between the obtained spectral information and various quality parameters (Balage et al., 2015; Barbin et al., 2013; Troy et al., 2016). However, the detection for quality indicators reported in most examples in the literature only used one part of meat. The meat quality varies with different meat cut types. Prediction models established for meat quality attributes reported in most literatures only using one meat cut type, which resulted in a poor applicability to other meat cut types and limited the commercial application of Vis/NIRS technology. Liu et al. (2018) established prediction models of the mutton protein, moisture, and fat contents by the partial least squares (PLS) method; the Rc values of the optimal models were 0.9312, 0.9200, and 0.9157, respectively, for the protein, moisture, and fat contents, but only the three nutritive quality indicators were studied, which resulted in extremely simple detection of meat quality. It is important to predict the quality indicators without manual identification of meat cut type, which improves the practical detection efficiency when used in an abattoir.
To summarize, this study aims at achieving the prediction of various quality indicators (pH, L*, a*, b*, cooking loss, shear force, protein, fat, and moisture values) of different sheep meat cut types for the meat processors. The main work was to establish models based on the corresponding relationship between the spectral information and the above quality measurements and analyze the effect of different spectral preprocessing methods to enhance the accuracy and robustness of the quantitative models established by the PLS regression algorithm.
Materials and Methods
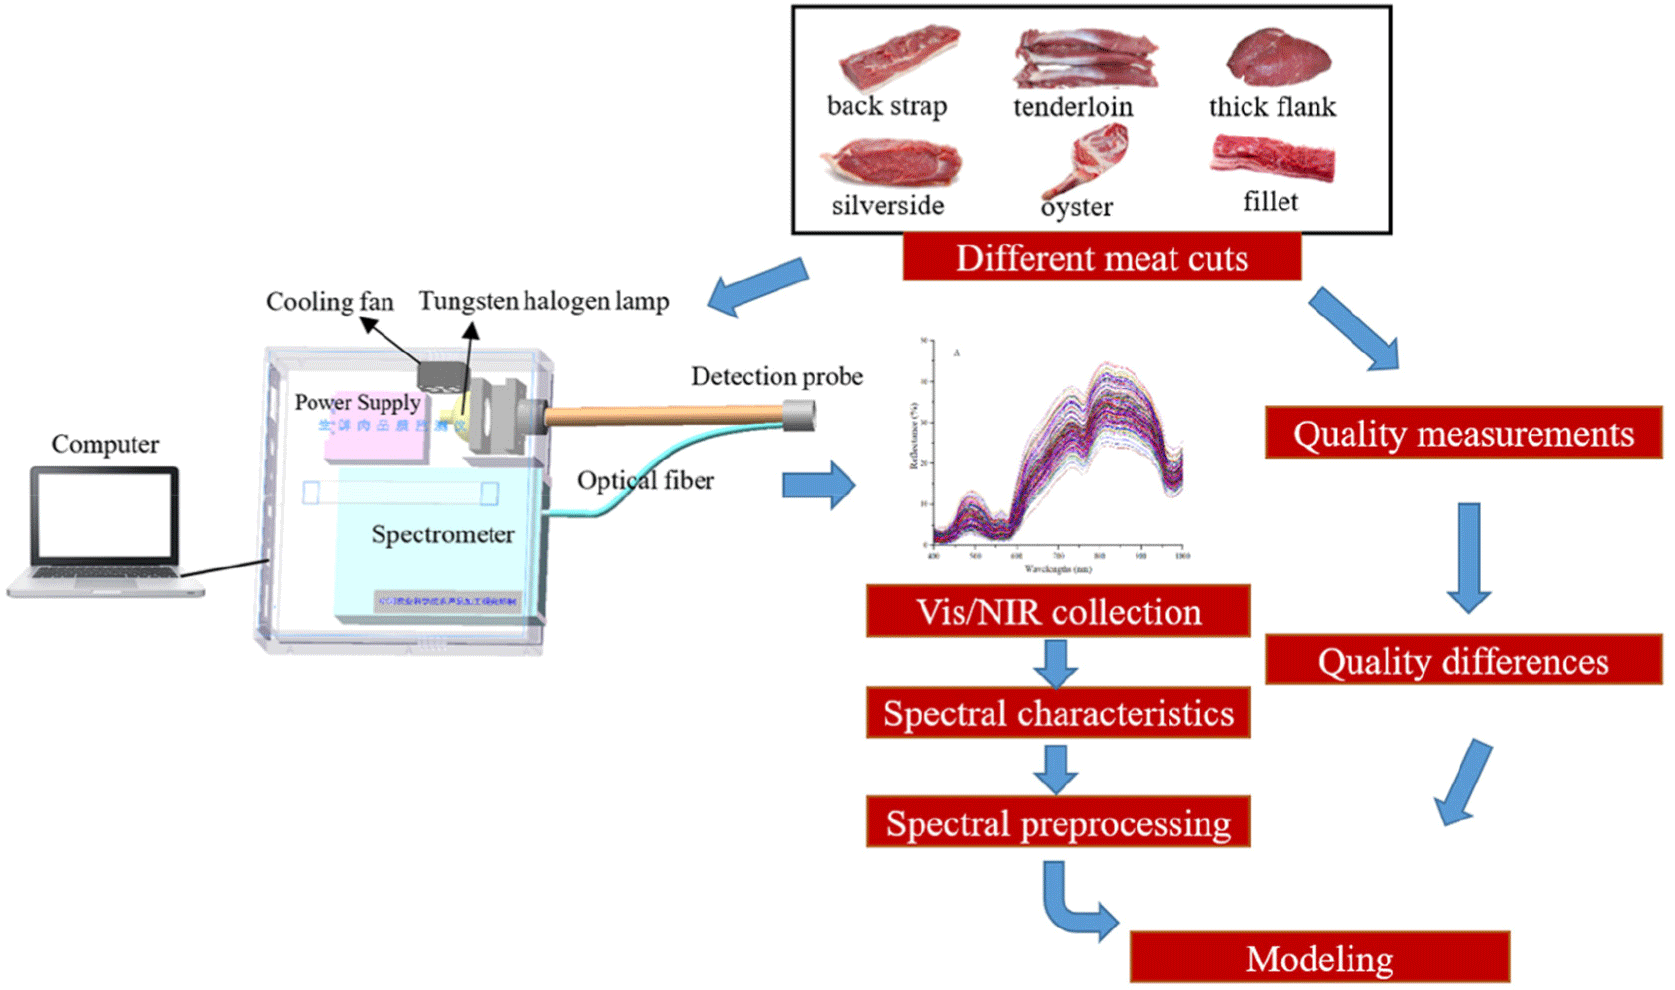
Six types of meat cut including silverside, back strap, oyster, fillet, thick flank, and tenderloin cuts were collected from Small-tailed Han sheep carcasses in an abattoir at Inner Mongolia on the basis of the cutting technical specifications standard for sheep meat (NY/T1564‐2007, China). The representative sheep carcasses with 8–12 mon old, carcass weight 27.00±3.15 kg, ram were selected to obtain more accuracy prediction models. Every day the operators segmented five sheep carcasses after chilling at 4°C for 24 h, then 30 meat cut samples (6 cut types×5 carcasses per day) were prepared. The experiment took 7 d and a total of 210 samples. Prior to the experiment, the samples were trimmed to approximately 5×5×3 cm3 using a scalpel, and the visible external tissue and fat were removed from the sample surface. The spectral information was first collected, then about 50 g sample was cut using a scalpel to determine the protein, fat, and moisture contents, and pH and color of each sample were measured. The sample was stored in a refrigerator at 4°C to keep quality stable. After the spectra, pH, and color of all the samples were determined, the shear force value and cooking loss were measured using the traditional methods. The following sections introduced the methods of measurement for the spectra and various quality parameters.
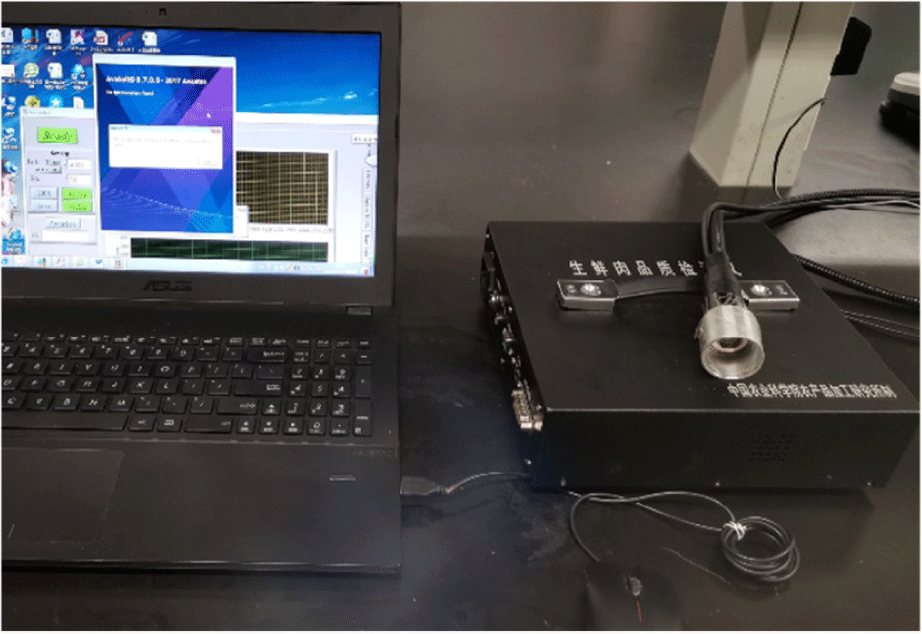
A stable Vis/NIR optical equipment (shown in Fig. 1) was used in this study to collect the spectra of meat samples. This whole system was convenient to carry due to its light weight of about 0.8 kg and the small size of only about 250 mm×200 mm×50 mm (length×width×height) and was suitable for the inadequate working condition of abattoir. Briefly, this equipment mainly consisted of a Vis/NIR spectrum collection module, a light source module, and a notebook computer. The Vis/NIR spectrum collection module was mainly made up of a spectrometer (AvaSpec-ULS2048CL-EVO-RS, Avantes, Apeldoorn, Netherlands), a detection probe, and an optical fiber. The distance from the probe to the sample is consistent due to the designed detection probe of 2 cm×2 cm size, ensuring the acquisition accuracy of the spectrum. In order to get enough optical information, the light source was selected with a 20 W stable tungsten halogen lamp. The wavelengths range used was from 400 to 1,000 nm.
Prior to collecting the spectral data, the Vis/NIR system was preheated for about 30 minutes by turning on the light source. This system applied the reflection mode and corrected black and white reference to decrease adverse interferences of the external circumstances on the spectral acquisition precision. The other parameters needed be set were average times of five and the integration time of 100 ms. The detection probe was then vertically put on the surface of the samples for subsequent spectral data collection. Ultimately, the spectra collection of each sample performed five different positions randomly, and the sample’s reflection spectrum was expressed by the average. Fig. 2 presented the detailed workflow.
A portable pH meter (Testo 205pH meter, Testo, Lenzkirch, Germany) was used to evaluate the pH, which was calibrated using pH standard buffers prior to the measurement. The pH probe was inserted into the sample about 1.5 cm deep from the surface to avoid the effect of the outside temperature change on pH. The measurement of each sample performed four replicates and expressed by the average.
The measurements of meat color attribute were carried out using a colorimeter (CM-600D, Konica Minolta Sensing, Osaka, Japan), which was calibrated before measurement. The values of L* (lightness), a* (redness), and b* (yellowness) were directly obtained from this colorimeter and were expressed as the means of four random points on the sample surface.
The method used to determine cooking loss was similar to the method used by Hopkins et al. (2010) with a slight modification. Each sample was trimmed and weighed to about 100 g. The samples were cooked in vacuum bags in a 70°C water bath for 30 min, cooled down to 4°C, wiped dry and then weighed again. The cooking loss value was calculated using the following Eq. (1).
Where X is cooking loss value of each meat cut (%); m1 is the weight of the tested sample before cooking (g); m2 is the weight after cooking (g).
The shear force value (tenderness) was measured using above cooked samples, which were cut into 1×1×2 cm3 cubes paralleling to the fiber direction. The measurements were conducted on a shear force meter (CL-M3, Nanjing Mingao Instrument Equipment, Nanjing, China), with a shear speed of 5.0 mm/s. At least five technical replicates per sample were tested and averaged.
The protein content was determined using a Kjeltec Analyzer Unit (2300, FOSS Scino, Copenhagen, Denmark) according to the automatic Kjeldahl nitrogen method from the standard GB 5009.5-2016. The fat content was determined using a fat analyzer (SOX406, Jinan Hanon Instruments, Jinan, China) according to the soxhlet extraction method from the standard GB 5009.6-2016. The moisture content was determined according to the direct drying method from the standard GB/T9695.15-2008. The average of two replicates per sample was used to ensure reliability of results.
Prior to the modeling, five spectral preprocessing algorithms, multiplicative scatter correction (MSC), standard normalized variate (SNV), Savitzky-Golay (S-G) smoothing, first derivate (1st Der), and second derivate (2nd Der) included, were used to decrease the variabilities produced by the scatter and optical interference. MSC separates the diffused light and the chemical absorption signal, and eliminates the direct reflex from the complex reflection spectra (Huang et al., 2016). SNV rectifies the baseline drift and remove the scattering of reflection spectra (Luypaert et al., 2004). S-G smoothing eliminates high frequency noise, enhance signal to noise ratio and smooth the spectra (Vidal and Amigo, 2012); 5-point S-G smoothing was used. The 1st Der modifies the baseline and the 2nd Der modifies the linear trend and baseline (Mao et al., 2015). The accuracy and robustness of models maybe improved using the five spectral preprocessing methods.
The one-way ANOVA method was implemented using SPSS software (version 19.0, SPSS, Chicago, IL, USA) to analyze the quality difference of different meat cut types. The p<0.05 was defined as the statistical significance. Due to the complexity of different meat cut types, this study used the partial least squares regression (PLSR), a classical and popular linear regression algorithm, to establish the quantitative prediction models for multiple quality parameters. The relationships between the spectral data (independent variables) and pH, color, cooking loss, shear force, protein, fat, and moisture (dependent variables) were exploited using the PLSR method, respectively. The modeling was implemented using Matlab software (R2014a, Mathworks, Natick, MA, USA).
The PLSR is popular for its better decomposition ability, especially when the number of variables is larger than the number of samples, which is widely used to develop mathematical models (Abdi, 2010). The PLSR seeks the essential linear relations between the spectral data and various quality parameters by eliminating large numbers of independent variable to the unrelated variables called latent variables (LVs). The LVs number was selected using the cross validation SE obtained by implementing the leave-one-out cross validation method.
Prior to the modeling, the spectral data of all the samples were arranged according to the quality indicator, then one sample was randomly chosen from every four meat cuts and added into the prediction set for evaluating the prediction model, and the remainders were added into the calibration set for establishing the prediction model. In general, the accuracy and robustness of the model were evaluated by these indicators, including the correlation coefficients of the calibration set (Rc) and the prediction set (Rp), and the root mean square errors of the calibration set (RMSEC) and the prediction set (RMSEP). A better model has higher Rc and Rp values, and lower RMSEC and RMSEP values and smaller differences between the Rc and Rp values and between the RMSEC and RMSEP values (Li et al., 2019).
Results and Discussion
The measurements of various quality attributes (pH, L*, a*, b*, cooking loss, shear force, protein, fat, and moisture) were analyzed in statistics for the six types of sheep meat cut, including silverside, back strap, oyster, fillet, thick flank and tenderloin cuts. Table 1 displays the variation ranges, average values, and SDs of all quality parameters.
As shown in Table 1, there were no obvious differences in pH ranges among the six types of meat cut, which might be because the pH differences between different types of meat cut and different carcasses were small (Qu et al., 2018). The fillet cut was significantly different (p<0.05) in pH from other cuts. The L* (lightness) results reveal that the lightness of back strap and silverside cuts were the lowest, whereas the lightness of the fillet was the highest than other cuts (p<0.05). This was consistent with their fat and fascial tissue contents. For a* (redness) the silverside cut had the most balanced redness distribution with a lowest SD of 0.89, which might be due to its largest amount of lean meat. For b*, the yellowness of the fillet cut was the highest than other cuts (p<0.05), which was because of its large amounts of residual connective tissues and fat. The yellowness of the tenderloin cut was the lowest (p<0.05), which might be because that it was all lean meat with the least fat. Table 1 shows that there were no significant differences (p>0.05) in the cooking loss between the silverside, thick flank, fillet and oyster cuts. The cooking loss values of the back strap and tenderloin cuts were significantly higher than the others (p<0.05). The average shear force of the tenderloin cut was the lowest, which indicates the highest tenderness, followed by the oyster cut and the back strap cut.
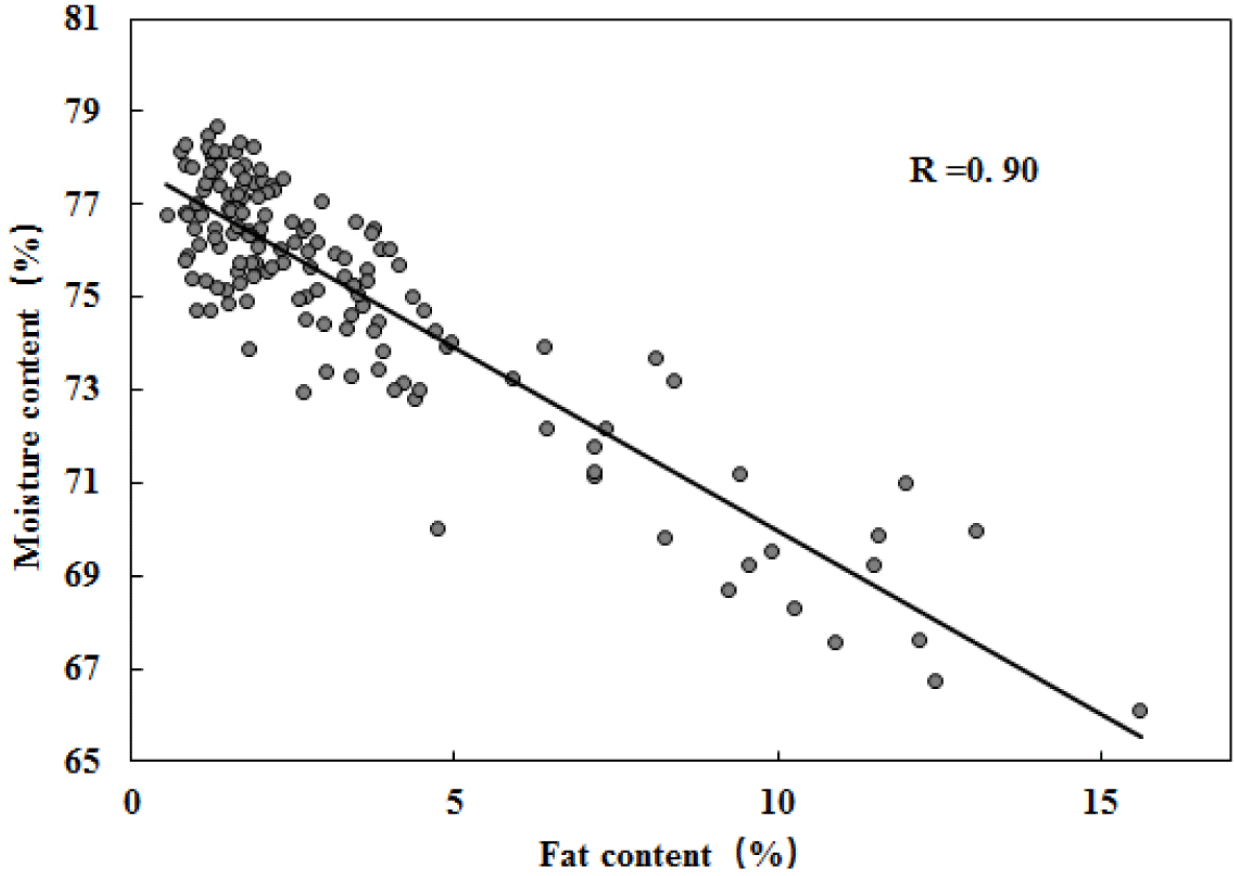
From protein content results shown in Table 1, the tenderloin, thick flank, and oyster cuts had significant differences (p<0.05) compared to the fillet, back strap and silverside cuts. The protein differences among the tender loin, thick flank, and oyster cuts were not significant (p>0.05). The back strap cut and silverside cut had obviously higher protein contents than other cuts, but the difference was not significant (p>0.05), which was due to their similar composition, more lean meat and less fat contents. The fillet cut had the least protein content because of its existing lots of connective tissue. Overall, there was great differences in the fat contents among the six meat cut types (Table 1). The back strap and tenderloin cuts were significantly different (p<0.05) from other cuts. The fillet cut had a higher mean of 9.46 g/100 g fat content, which significantly differed (p<0.05) from the others. The moisture value of the fillet cut was the lowest and had significant difference (p<0.05) from other cuts. To summarize, the fillet cut due to its large amounts of fat and fascial tissue differed significantly (p<0.05) in the protein, fat, and moisture contents from other cuts. In addition, the back strap cut differed significantly (p<0.05) in the moisture content from other cuts. Fig. 3 shows a high correlation between the fat content and moisture content with the R of 0.90, but there was no high correlation between the fat and the protein nor between the moisture and the protein. This might be because the protein change and the sum of the fat and moisture contents in meat cuts were relatively stable, as shown in Table 1.
To summarize, different sheep meat cut types had differences in quality attributes, such as pH, L*, a*, b*, cooking loss, shear force, protein, fat, and moisture contents, which implies that a prediction model established using one type of meat cut is not likely to be suitable for other types of meat cut. The quality difference analysis of different sheep meat cut types indicated that the modeling using the combined meat cuts is important for improving the practical applicability of the model. Different meat cut types have different tissues composition, for instance, there are obvious differences in tenderness and color between the meat parts with more connective tissue and those with less, as well as nutrients, such as protein, fat, and carbohydrates (Chen et al., 2016). Fowler et al. (2020) explored the potential for the prediction of the intramuscular fat (IMF) content of lamb loin and topside using NIR spectra collected on the topside in situ, and concluded that further research was needed to develop models for industry application based on more appropriate calibration data.
The wavelength range of the collected Vis/NIR reflectance spectra were from 170 to 1,100 nm, but due to a large amount of noise at 170–400 nm and 1,000–1,100 nm of the spectrum, the wavelengths of 400–1,000 nm were extracted to analyze the spectral features of different types of meat cut. Fig. 4A shows all original spectral curves at 400–1,000 nm wavelength of sheep meat cuts, which showed an obvious similar variation tendency of the six different meat cut types. There is an indirect correlation between the spectral information and quality attributes of meat. The spectral information of meat was sensitive to the molecular bonds in meat, such as C-H, O-H, S-H, and N-H, which related to various quality attributes. The vibration overtones and vibration combinations of the above molecular bonds are related to the absorption peaks of the spectra (Khaleduzzaman and Salim, 2020), and four significant absorption peaks at about 430 nm, 550 nm, 760 nm, and 980 nm wavelengths were shown in Fig. 4A. He et al. (2013), Cozzolino and Murray (2004) reported the characteristic wavelengths in the visible and near-infrared region, the 430 nm absorption peak is mainly connected with the Soret absorption bond, which is mainly related to the erythrocytes of hemoglobin. The 550 nm absorption peak also occurred in the visible region is mainly connected with the myoglobin in meat, and the absorption peak at 760 nm is connected with the deoxymyoglobin, which was produced by the O-H stretching third overtone involved in the pH, color, protein, moisture, and fat components. The absorption peak at 980 nm is related to O-H third stretch overtone, which is mainly related to the moisture content (Khaleduzzaman and Salim, 2020). Due to the shear force being a physical parameter, which was formed by much more factors, its characteristic peak was difficult to find for relating some single corresponding groups. The shear force is connected with some property indicators, such as meat color, cooking loss and nutritional composition. Thus, the characteristic wavelength of the shear force can be analyzed by investigating the spectral features of the related quality indicators affecting the shear force (Wang et al., 2016).
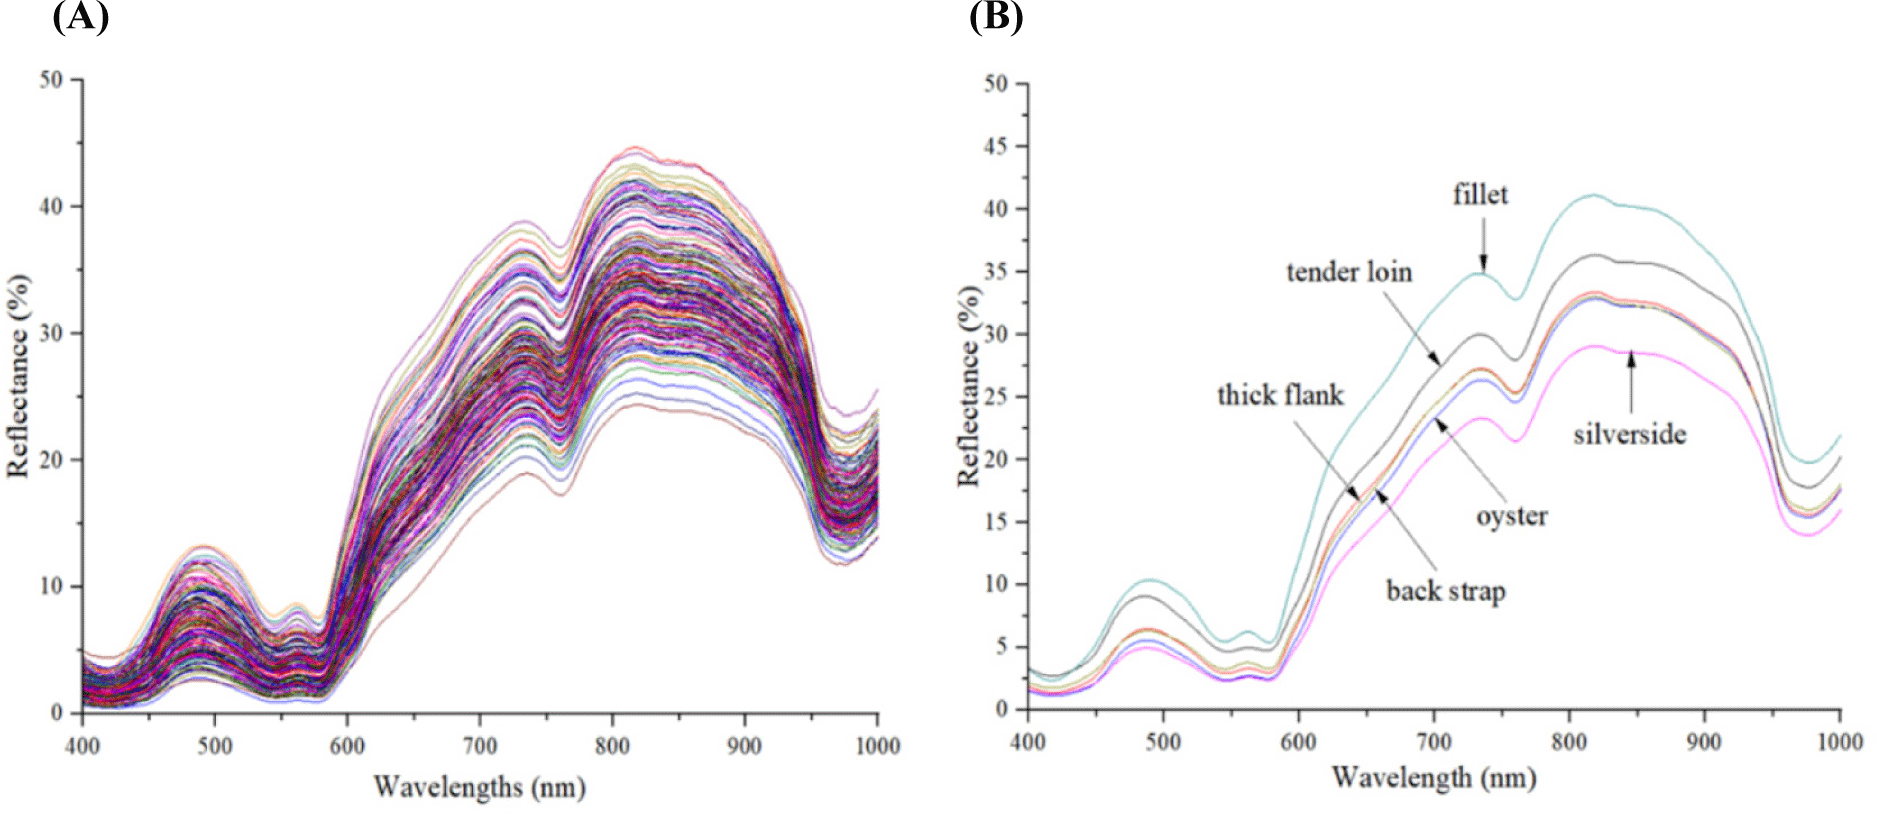
Fig. 4B shows the average spectral curves of the six sheep meat cut types, which revealed the different spectral characteristics of different meat cut types through the variation amplitudes of the spectral curves. The different spectral characteristics were attributed to the quality differences of different meat cut types. Fig. 4B reveals that the back strap, oyster, and thick flank cuts had the similar spectral variation amplitudes, which is expected due to their non-significant differences of a*, b*, shear force qualities, and fat content qualities, as shown in Table 1. The fillet cut had the highest spectral amplitude due to the higher reflectivity caused by more fat and fascial tissue, which was consistent with the above findings that the main qualities of the fillet cut, such as L*, b*, protein, fat, and moisture contents, significantly differed from those of other cuts (p<0.05). The back strap, thick flank, oyster, and silverside cuts had a relatively close spectral variation amplitude at the region of about 550 nm wavelength, whereas the silverside cut had the lowest reflectance at about 760 nm wavelength. This might be because that the silverside cut had the overall insignificant differences of a*, b*, cooling loss, shear force, and fat mainly related to the front region of the spectrum; and had significant differences in protein and moisture contents mainly related to the back region of the spectrum.
Table 2 displays the sample set division results according to the principle of 3:1. A total of 156 samples were included in the calibration set and 54 samples were included in the prediction set. The reference measurement ranges of most quality parameters in the calibration set were covered by the prediction set, which indicated that the distributions of the measurements of each quality indicator in the calibration and prediction sets were almost equal, and the bias of the two datasets could be avoided. The ranges of the protein and moisture contents in the prediction set were not covered by the calibration set, which could affect the accuracy of the models.
Prior to the modeling, five spectral preprocessing algorithms were used to eliminate the noise and baseline shift from the original spectra and improve the useful information related to quality attributes of sheep meat cuts. Throughout the collected Vis/NIR spectral data from 400 to 1,000 nm and the measured quality parameters of pH, L*, a*, b*, cooking loss, shear force, protein, fat, and moisture, the PLSR method was used to develop the models for predicting every quality indicator of the combined meat cuts, which were mixed by the six types of sheep meat cuts. To obtain a more accurate model for every quality attribute, the prediction models established using the original spectral data and above five preprocessing methods were comprehensively compared and analyzed.
Table 3 displays the PLSR modeling results of various quality attributes for the combined sheep meat cuts. For all quality parameters, different spectral preprocessing methods affected the prediction models’ performances in varying degrees, as evaluated by the values of Rc, RMSEC, Rp, and RMSEP shown in Table 3. During the generation of LVs in the process of the PLSR modeling, the matrix of the spectral data (independent variables) and the measured quality parameters (dependent variables), including pH, meat color (L*, a*, and b*), cooking loss value, shear force value, protein, fat, and moisture values was simultaneously decomposed. The number of LVs was determined by explaining the covariance between the spectral data and each quality parameter as much as possible followed with the regression procedure. Compared with the original spectral data, the five preprocessing methods improved the accuracy and robustness of the prediction models in varying degrees for every quality attribute. By contrast, the MSC, SNV and 1st Der methods provided the better modeling effects than S-G smoothing and 2nd Der methods. For all quality parameters, the MSC produced the similar modeling results with the SNV, which was due to their similar principles of reducing scatter light and correcting baseline variation.
PLSR, partial least squares regression; LVs, the number of latent variables; Rc, correlation coefficient of calibration set; RMSEC, the root mean squared error of calibration set; Rp, correlation coefficient of prediction set; RMSEP, the root mean squared error of prediction set; MSC, multiplicative scatter correction; SNV, standard normalized variate; 1st Der, first derivative; 2nd Der, second derivative; S-G, Savitzky-Golay.
It could be seen from Table 3, the best model performance for pH prediction was Rc=0.82, RMSEC=0.04, Rp=0.81, and RMSEP=0.06, respectively, with MSC preprocessing, which was slightly better than that after SNV preprocessing. Zhang et al. (2012) used Vis/NIRS of 350–1,100 nm wavelengths to predict the pH of pork meat and obtained the PLS models with Rpof 0.803 and RMSEP of 0.098, which was similar to the present result. Balage et al. (2015) used Vis/NIR spectroscopy to scan the longissimus dorsi samples from pigs and obtained satisfactory PLSR modeling performance of pH, which could be used in practical application. For lightness L* predictions shown in Table 3, the raw spectral data provided a good model, however, the accuracy of this model was slightly inferior to that preprocessed by the SNV, which indicated the model after SNV preprocessing could be better used. Therefore, the best prediction model was Rc=0.88 with an RMSEC=1.61, Rp=0.84 with an RMSEP of 1.87 after SNV preprocessing. The S-G smoothing obtained the satisfactory modeling performance, however, the predictive ability was relatively poor, indicating a model that is not recommended. From a* (redness) prediction results, both MSC and SNV preprocessing methods obviously enhanced the model ability and decreased LVs number, but the prediction performances were not good enough. The lager difference between the higher Rc value of 0.82 and lower Rp value of 0.55 signified that the model was overfitting, resulting in the limited practical predictive ability. The optimal prediction model of quality indicator a* was provided by S-G smoothing with Rc=0.83 and RMSEC=0.85, Rp=0.78 and RMSEP=1.35. For b* (yellowness) prediction, the original spectra provided the best model accuracy Rc of 0.88, however, S-G smoothing provided the most accurate predictive ability with minimum predictive error (Rp of 0.82 and RMSEP of 0.88). The optimal modeling result of b* prediction was Rc value of 0.83, RMSEC value of 0.83, Rp value of 0.82, and RMSEP value of 0.88. De Marchi et al. (2011) used 350–1,800 nm Vis/NIR spectroscopy to predict the quality of intact chicken breast, and reported good predictive performances of a* and b* and unreliable predictive result of L*. Balage et al. (2015) established barely satisfactory PLS regression model of L*, a*, and b* for longissimus dorsi meat of pig.
From the cooking loss results shown in Table 3, the prediction results were effectively improved by 1st Der preprocessing, which obtained the highest calibration accuracy (Rc of 0.94) and an appropriate number (7) of LVs. This indicated that the complexity of the model was effectively reduced. Thus, the optimal prediction model of the cooking loss was provided by 1st Der processing with Rc=0.94, RMSEC=1.62%, Rp=0.86, and RMSEP=1.80%. By comparison, De Marchi et al. (2011) and De Marchi et al. (2013) established less accurate prediction models of the cooking loss for beef and chicken meat.
For shear force (tenderness) predictions shown in Table 3, the optimal modeling results were displayed using the higher values of Rc and Rp and the lower values of RMSEC and RMSEP after MSC, SNV, and S-G smoothing preprocessing. The best model for predicting the shear force was obtained using SNV preprocessing, which was as high as Rc=0.90, RMSEC=2.36 N, Rp=0.88, RMSEP=3.41 N, and a reasonable LV number (10). Huge differences in the shear force exist between different types of meat cut and different carcasses. The huge shear force differences between different types of meat cut benefitted the above better prediction results, that is, the huge difference would have a positive effect on the accuracy of model (He et al., 2019). Knight et al. (2019) predicted the tenderness of the topside and loin muscles of Australian lamb, r2 values of only 0.13 and 0.12 were acquired, which indicated that the models could not be used in practice. Wang et al. (2016) used visible near infrared hyperspectral technology to establish the prediction models of tenderness of Tan lamb, and obtained optimal PLSR model with Rp=0.89. Balage et al. (2015) obtained PLSR model of shear force with Rc2=0.48. De Marchi et al. (2013) obtained moderate prediction (Rc2=0.34) for shear force of beef samples. Most studies have not reported the best prediction for meat tenderness indicator by Vis/NIRS technology. The meat cuts used in the study were obtained from different parts of sheep carcasses with differences in tenderness, which enables the better predictions for shear force value (Prieto et al., 2017).
For the protein content prediction, the PLSR model with MSC preprocessing provided the best result for the combination meat cuts, with Rc of 0.84, RMSEC of 0.65%, Rp of 0.83, and RMSEP of 0.80%. The SNV preprocessing also obtained an available model, the Rp value of which was slightly worse than that of MSC preprocessing. Protein had absorption in NIR band, but it was weaker than moisture absorption, and its absorption information was covered by moisture information (He et al., 2019). Fan et al. (2021) selected the characteristic wavelength in the range of 473–814 nm as the sensitive wavelength for protein detection of chilled mutton, and obtained the LS-SVM model using the Box-Behnken method, with an Rp value of 0.8604 and RMSEP of 0.57%. It is necessary to apply more appropriate chemometrics algorithm to mine data relevant to protein, which may improve the accuracy of the protein content prediction.
Fat content in meat, an important factor affecting meat quality, is closely related to the color, tenderness, texture, water holding capacity, and flavor (Hua et al., 2017). For the fat content prediction, the model after 1st Der preprocessing obtained a slightly worse Rp value than those of using the original spectra, MSC, and SNV. However, 1st Der preprocessing provided the highest model accuracy with Rc of 0.93, the lowest predictive error with RMSEP of 1.68% and an appropriate LV number (7), which meant that the complexity of prediction model was reduced. Fowler et al. (2020) used lamb loin and topside cuts to explore the potential of NIRS technology for predicting the IMF content. The obtained models showed a predictive ability of Rp2=0.58 and RMSEP=0.85 for topside cut and Rp2=0.50 and RMSEP=0.91 for loin cut. They suggested that it is necessary to improve the model’s applicability using more calibration data.
Moisture is the main component of meat, and one of the nutrients. The moisture content in meat not only affects its quality, but also affects its shelf life. Therefore, the detection of moisture content was one of the important items in quality analysis of sheep meat cuts (Lanza, 1983). For the moisture content prediction, the MSC preprocessing provided the best modeling performance with higher Rc and Rp values of 0.92 and 0.87, lower RMSEC and RMSEP values of 1.05% and 1.54%. Liu et al. (2018) used NIR spectroscopy technology and the quantitative PLSR models to predict the contents of moisture, protein, and fat in 100-chilled mutton sold in the market. The Rc values of the established models were all above 0.9, which met the practical detection requirements. Yuan et al. (2020) predicted chicken moisture content using the Vis/NIR spectroscopy combined with three-step hybrid variable selection strategy, and obtained optimal PLSR model with higher Rp value of 0.9435 and lower RMSEP value of 0.6123%. NIRS achieved good results in predicting moisture content in meat as reported by the previous studies, which might be due to the more absorption of moisture in NIR band.
To summarize, all quality attributes of the combined sheep meat cuts obtained satisfactory prediction models in the present study, which proved that it is feasible to establish quantitative models of multiple quality indicators for different types of meat cut. The findings indicate that the spectroscopy technology and chemometrics has practical applicability for simultaneous prediction of multiple quality parameters for different meat cuts without identifying meat types. The results indicated that the PLSR combined with the spectral preprocessing methods provided satisfactory prediction models in detecting various quality attributes for different types of meat cut. For the practical application of the established models, only one Vis/NIR spectrum of a meat cut needs to be collected to simultaneously get the prediction results of nine quality parameters, including pH, L*, a*, b*, cooking loss, shear force, protein, fat, and moisture contents. To improve the practical applicability, the prediction models can be optimized in future with inclusion of more types of commercial sheep meat cut or more samples into the calibration dataset to cover a larger spectral data range.
Conclusion
In this study, a quantitative simultaneous prediction of multiple quality attributes for different commercial meat cut types (silverside, back strap, oyster, fillet, thick flank, and tenderloin cuts) was implemented using a portable Vis/NIRS device combined with chemometrics. From the analysis of quality difference and spectral characteristic, it could be found that all quality parameters of different sheep meat cuts had overall significant differences (p<0.05), and there was different spectral characteristic between different types of meat cut. This proved that the quality prediction model established using one type of meat cut was not suitable for other types. The modeling results showed that using the appropriate data processing algorithms could effectively enhance the accuracy of the models. The PLSR model established by the original or the preprocessed spectra is presented as a vector in practical applications, which can be multiplied by the spectral vector to obtain the prediction results for different traits. In the follow-up application process, we can collect one spectral curve of the sample and substitute the data into the prediction models differently for different traits; then, the nine quality attributes of this sample can be calculated to quantitatively detect the unknown sample quality index. This study indicated that Vis/NIR spectroscopy technology and chemometrics can rapidly and nondestructively predict quality attributes for the combined meat cuts. In the lack of studies on multiple attribute prediction for different meat cut types, this study provided valuable theory and method for the practical application of Vis/NIR spectroscopy combined with chemometrics to quality detection of different commercial meat cut types.