


Introduction
Kefir originates in the Caucasus Mountains and it is manufactured in many countries in the region between Eastern Europe and Mongolia (Tratnik et al., 2006; Wroblewska et al., 2009). Kefir is a fermented milk beverage, which contains lactic acid bacteria, acetic acid bacteria and yeasts (Bensmira et al., 2010). Its specific flavor is derived from lactic acid, carbon dioxide, ethanol and other flavor products, such as acetoin and acetaldehyde (Güzel-Seydim et al., 2000). The consumption of kefir has been recommended for lowering the risk of gastrointestinal and cardiovascular diseases as well as of hypertension and allergy (Chen et al., 2008). In addition, it has been observed that kefir has positive effects on human health by increasing the beneficial bacteria in the gut region and thus improving lactose digestion.
Soy protein reduces the risk of heart disease and harmful low-density lipoprotein cholesterol, and also prevents colon, prostate and breast cancer, as well as osteoporosis. Other components of soybean products, such as isoflavones, phytosterols, lignans, saponins coumestans, and phytates have antioxidant properties (Rosenthal et al., 2003) and may reduce estrogen production in the ovaries; as a result of that, menopausal symptoms may be relieved (Li et al., 2013) and it may also reduce the risk of cancer (Toro-Funes et al., 2012).
Using different methods for production of kefir can affect physicochemical and sensory properties of products (Bensmira and Jiang, 2012). The most important physical properties of fermented products are the rheological properties and these properties vary by milk composition, heating process, cooling homogenization and incubation temperature (Bensmira et al., 2010).
Microbial transglutaminase (m-TGs) (EC 2.3.2.13 have been used in different kind of foods, including dairy products to improve their stability and viscosity (Al-Saadi et al., 2014; Tang et al., 2013; Wroblewska et al., 2009). m-TGs catalyze the covalent cross-linking of proteins by γ-carboxamide groups of peptide-bound glutamine residues and the ε-amino groups of lysine residues and cross-linked protein polymers are formed (Farnsworth et al., 2006). These polymers change functional, rheological, sensorial properties of the products and the immunoreactivity of the casein fraction (Gauche et al., 2009; Jaros et al., 2010; Wroblewska et al., 2009).
The objective of this research is to determine the common physicochemical, microbial and sensorial properties, and the volatile aromatic compositions of kefir produced using m-TGs and soy milk at different rates during storage.
Materials and Methods
Soybeans were soaked overnight in distilled water at 4°C of temperature. Unabsorbed water was drained off and the soybeans were rubbed to remove the hulls. Then the soybeans were grounded 14 times distilled water (95°C) in a Warring Blender (Waring Commercial Blender, Warring, USA) at high speed for 2 min. The slurry was filtered through two layers of cheesecloth, the filtrate was boiled for 15 min in the water batch and cooled to 20°C. Soymilk was also subjected to a total solid, protein and fat analysis.
Raw cow’s milk was purchased from a dairy farm and it was heated at 90°C for 15 s, and then it was cooled to 25°C. Cow’s milk without both m-TGs and without soy milk was control. Pasteurized cow’s milk and soymilk (75% cow’s milk, 25% soymilk) were mixed together and then the mixture was divided into four portions which were 10 L each. Mixed milk was heated to 50°C in a water batch and then the microbial transglutaminase (100 U per g transglutaminase activity ACTİVA WM, Ajinomoto Foods Europe S.A.S, France) was added to the milk at 0 U per g milk protein (1st batch, MS), 0.5 U per g milk protein (2nd batch, MS1), 1 U per g milk protein (3rd batch, MS2) and 1.5 U per g milk protein (4th batch, MS3) levels. The composition of each batch and control samples were standardized to 8% dry matter, 3% protein and 2% fat using the mass balance. All batches were incubated at 50°C for 1 h, and then heated to 80°C for 1 min to stop the enzymatic reaction and was cooled in an icewater container to 25°C. The fermentation of milk was carried out by adding the freeze-dried starter culture 0.02 g per L milk, “Kefir Culture type DC1 500 I” (Danisco Biolacta sp.z o.o. ul. Tuwima I A: 10-747 Olsztyn-Poland), at 25°C. The starter culture contained the following microbial species in unknown proportions: Lactococcus lactis subsp., Leuconostoc sp., Streptococcus thermophilus, Lactobacillus sp., kefir yeast and kefir grains microflora. Fermentation was stopped at pH 4.6 (approximately 18 h), and then each batch was separately divided between glass containers. Each batch was prepared twice on various days and were stored at 4°C until analyzed. Analyses were carried out on the 1st, 10th, 20th and 30th d of storage.
The contents of total solid, protein, ash and fat were measured according to the methods reported by the AOAC (1995). The pH values were recorded by using a digital pH-meter (Cyberscan PC 510, Singapore), and the measurement of titratable acidity was expressed as percent lactic acid (LA%) (AOAC, 1990). Viscosity measurements of the kefir were taken at 15°C and 30 rpm (spindle number 2) using a Brookfield viscometer (Model DV-1+; Brookfield Engineering Laboratories, Inc., USA). Each measurement was repeated three times. In order to determine syneresis (%), 5 g of kefir was centrifuged (Sigma Model 3K30, Osterodeam Harz, Germany) at 2,500 g for 10 min at 4°C and then, supernatant was weighed and syneresis was calculated according to the following equation:
Analysis of volatile aromatic compounds was conducted using a slightly-modified method of Plessas et al. (2008). Briefly, 5 mL kefir sample was placed in a vial (15 mL), sealed by a septum type cap and held in a water container. A SPME fiber (2 cm-50/30 mm DVD/Carboxen/PDMS Stable Flex Supelco, USA) was inserted in the vial for the sampling process. The vials were heated to 55°C for 50 min. Then, the SPME fiber was transferred to the GC-MS (Mode GC-2010; Shimadzu Corporation, Japan) with a chromatographic column, 60 m, 0.32 mm i.d., 0.25 μm film thickness (Restek Stabilewax, Polyethylene glycol, USA) with helium as carrier gas, at a flow rate of 3 mL/min, at a pressure value of 124.2 kPa and the injector port was heated to 250°C. The split was 10.0. The temperature of the column was held at 40°C for 1 min, then increased by 7°C/min to 100 °C, held at that state for 5 min, increased by 4°C/min to 130 °C, held at that state for 1 min, increased by 2°C/min to 180°C held for 1 min and then, increased by 15 °C/min to 250°C and held at that state for 4 min. Total run time was 57.74 min. The interface temperature was 230°C the mass range was m/z 35-450. The identification of volatiles was performed by comparison of data than those of in WILEY 229, NIST and FFNSCN (Flavor and Fragrance Natural and Synthetic Compounds) libraries. Volatile aromatic compounds were determined the 1st and the 30th day of storage. Each sample was analyzed three times and the mean data were presented. The final concentrations were reported as the percentage of total volatile aroma compounds.
1 mL of kefir sample was prepared with 9 mL 0.1% peptone (Merck Darmstadt, Germany) water in a Stomacher. Decimal dilutions were prepared with values of 10−2 to 10−6 for each sample. Lactic streptococci was (LAB 92, UK) incubated at 37°C for 48 h on M17 agar, Lactobacilli (Merck Darmstadt, Germany) at 37°C 48 h on MRS agar, yeasts at 28°C for 96 h on potato dextrose agar (PDA, Merck Darmstadt, Germany) and mesophilic aerobic bacteria was incubated at 30-32°C for 48 h on plate count agar (PCA, Merck Darmstadt, Germany). All analyses were carried out in duplicate and if necessary they were repeated.
Sensorial assessments of kefir were performed by a panel consisting of 12 members from the university staff. Prior to their assessments, panelists were trained with samples purchased from local supermarkets. Kefir samples were filled into the cups, which were approximately 50 mL in volume and they were marked with random three-digit numbers. Samples were presented to panelists at 10°C. Panelists were asked to score on the basis of their flavor, odor, body and texture. For evaluation, the panelists used a scale with the worst option rated as 1 and the best option rated as 10. The overall acceptability was presented as the sum of the scores of samples evaluated.
Data were analyzed using SPSS Statistical Software (2000) (SPSS Inc., USA), and the results were offered as mean ± standard deviation. Significance differences (p<0.05) among the different type of kefir and the effect of storage were analyzed using ANOVA, followed by Duncan’s multiple range tests. All measurements were conducted in duplicate.
Results and Discussion
Total solid and fat measurements of kefir samples were basically similar regardless of varieties; total solid for kefir samples was measured between 7.93-8.15%, while fat rates varied between 1.8-2.4%. No significant difference was detected in total solid and fat contents of the kefir samples (dates not shown here).
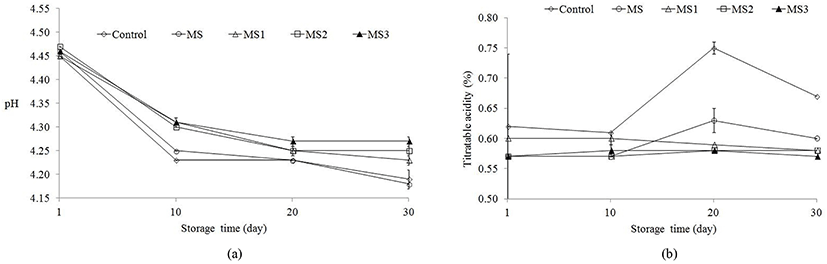
pH values of kefir samples varied between 4.18-4.47. The effect of the treatments and storage time on pH value of kefir samples are shown in Fig. 1a. As seen, treatments and storage time had a significant (p<0.05) effect on pH. pH of the samples prepared with m-TGs treated milk was higher than those of m-TGs untreated milk (p<0.05). It was concluded that the acidification of milk proteins which are added with m-TGs have caused a demand of more time for microorganism activity than the acidification without m-TGs. Similar effects were also reported by Wroblewnska et al. (2009) and Tsevdou et al. (2013). pH values of the samples significantly decreased at all the samples until the 10th day of storage, but after 10th d of storage this reduction at m-TGs added samples got slower as compared to the control and MS samples. pH value of MS3 samples decreased from 4.46 to 4.27, while pH value of control samples decreased from 4.45 to 4.19 between 1 and 30 d of storage (Fig. 1a). In some researches it was reported that pH value decreased during the storage time (Grønnevik et al., 2011; Irigoyen et al., (2005) and these results are agreement with our findings.
Titratable acidity values varied between 0.57-0.75%, and the control samples had significantly higher (p<0.05) values than that of m-TGs added kefir (Fig. 1b). The addition of m-TGs prevented development of titratable acidity and therefore as a result lower titratable acidity values were observed in the MS2 and MS3 samples. The results were found to be in accordance with the results by Özer et al. (2007). During storage, titratable acidity of the samples increased generally (p<0.05) and all the samples showed similarity until the 10th d of storage, and the most distinct changes were observed on the 20th d of storage (p<0.05). Titratable acidity of the control samples reached to the highest level compared to with m-TGs added kefir samples at the end of storage (Fig. 1b). Although our results did not confirm the results by Tratnik et al. (2006), Grønnevik et al. (2011) and Kök-Taş et al. (2013), who reported that the acidity value of kefir samples remained unchanged during storage, similar changes in titratable acidity in kefir were also observed by Witthuhn et al. (2005).
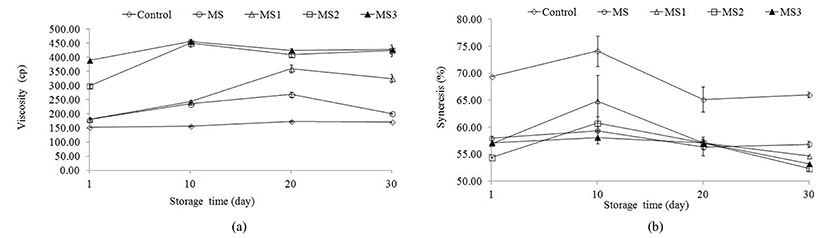
Viscosity values varied between 150.25-457.00 cP. The lowest viscosity value was found in the control group kefir, while 1.5 U per g protein m-TGs added kefir samples produced the highest value. The viscosities of the MS samples were higher than the control samples. It is clear that soymilk positively affected viscosity as compared to the control samples. It may be concluded that soy protein dispersions increase viscosity after heating and undergo an irreversible change to the progel state, and the changes of soy proteins in soymilk have been modified to form colloidal phase. Tratnik et al. (2006) reported that m-TGs added kefir samples had greater amounts of protein particles, and increased number of particles that bind water molecules and increased viscosity due to a greater water-binding capacity. As shown in Fig. 2a, the viscosity of kefir increased advancing m-TGs levels. This phenomenon may be associated with enzyme-induced cross-linking that the breaking strength of kefir was increased. During storage, it was observed that viscosity of all the samples fluctuated and increased up to 20th d of storage except for the control samples after then while it was determined slightly decrease in MS and MS1 samples, no significant change was determined in the MS2 and MS3 samples up to the end of storage period (Fig. 2a). Wroblewska et al. (2009) reported that adding m-TGs slightly increased the viscosity of the kefir samples as compared to those without m-TGs.
The means of syneresis rates of the samples varied between 52.35-74.10% and results are shown in Fig. 2b. As seen, treatment (p<0.05) and storage time (p<0.05) were found to have significant effects on syneresis. Higher values were obtained in the control samples as compared to in MS2 and MS3 samples. Syneresis value of the kefir samples treated with m-TGs was lower than that of untreated samples, but no significant difference between MS2 and MS3 samples were observed (p>0.05; Fig. 2b). The addition of transglutaminase improved water holding capacities with cross-linking and therefore, syneresis was prevented (Farnsworth et al., 2006). As seen, syneresis rates of all the samples increased until the 10th d, after then decreased the most rapidly for control and MS1 samples compared to the other samples up to 20th d of storage. After 20th d of the storage, syneresis rates unchanged for control and MS while the syneresis rates of samples with m-TGs decreased slightly up to at the end of storage.
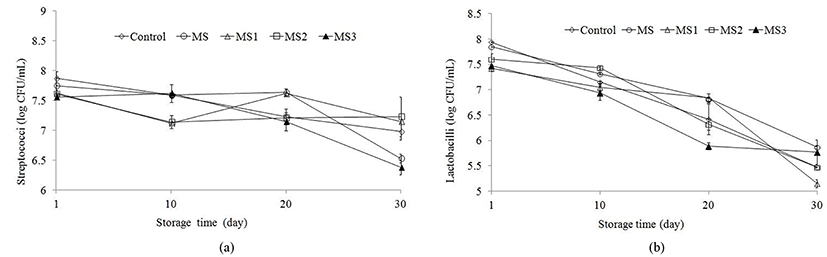
Streptococci counts reduced from 7.87 to 6.53 Log CFU/mL during storage (Fig. 3a). Streptococci counts in MS1 and MS2 samples decreased, but remained unchanged for another treatment until the 10th d of storage. Thereafter, Streptococci counts quickly decreased until the end of storage but remained relatively constant in MS2 sample. The lowest streptococci counts were in MS3 samples at the end of storage time (Fig. 3a).
Lactobacilli counts of kefir were significantly (p<0.05) affected by treatment and storage time (Fig. 3b) and varied between 5.15- 7.94 Log CFU/mL. The samples with m-TGs have statistically lower Lactobacilli counts than samples without m-TGs. But no significant difference between m-TGs added samples were observed (p>0.05). During storage, the means Lactobacilli counts for kefir samples decreased steadily from 7.66 Log CFU/mL to 5.54 Log CFU/mL at the end of storage period. There was a decreased in Lactobacilli counts and this pattern of behavior was observed for all the samples, but the most important changes were determined on the 20th d and 30th d of the storage period (Fig. 3b). Except MS3 sample Lactobacilli counts of other samples decreased steadily during the storage, but MS3 sample had similar Lactobacilli counts on 20th d and 30th d of storage. Similar data were also offered by Irigoyen et al. (2005), Grønnevik et al. (2011), Güzel-Seydim et al. (2011) and Kök-Taş et al. (2013).
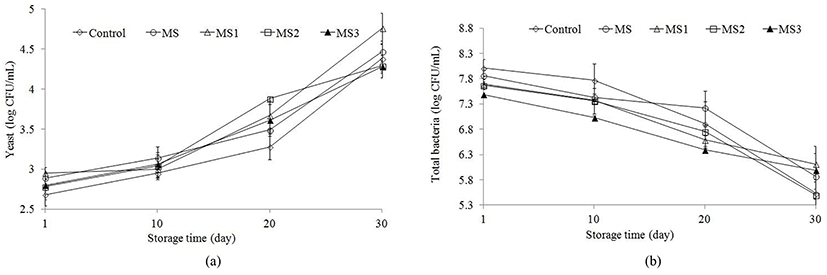
Yeasts are primarily responsible for ethanol production in kefir. However, heterofermentative Lactobacillus kefir is capable of producing ethanol (Ertekin and Guzel-Seydim, 2010). Yeast counts of the kefir samples exhibited significant differences during storage (p<0.05) and varied between 2.82-4.44 Log CFU/mL (Fig. 4a). Yeast counts did not significantly change until the 10th d and after then the count increased until the end of the storage period. Similarly by Grønnevik et al. (2011) reported that yeast numbers continuously increased during storage. But, yeast levels of our results were lower than those declared by Irigoyen et al. (2005), Zajsek and Görsek (2010) and Kök-Taş et al. (2013).
Total bacteria counts revealed significant differences (p<0.05) in all the samples during storage and varied between 5.50-8.01 Log CFU/mL (Fig. 4b). No significant difference was detected in the samples, with m-TGs and without m-TGs. The similar results were reported by Wroblewska et al. (2009) in m-TGs added kefir during 14 d of storage.
The results of sensory analysis of kefir are shown in Table 1. It was found that storage time had only a significant effect at 1st and 20th d on the flavour scores, while MS samples from treatments a significantly affected upon flavour scores. Odour and, body and texture scores were not significantly affect from both treatments and during storage (p>0.05). In this study, control and MS samples had lower overall acceptability scores as compared to the other samples. A higher score of overall acceptability was obtained in MS2 and MS3 samples by panelists (Table 1). Similar results were obtained by Wroblewska et al. (2009) in kefir with m-TGs during 14 d of storage.
Values are means ± standard deviation of three replicates. Control; Cow’s milk without both m-TGs and without soy milk, MS; 75% cow milk + 25% soymilk without m-TGs, MS1; 75% cow milk + 25% soymilk + 0.5 U m-TGs/per g milk protein, MS2; 75% cow milk + 25% soymilk + 1 U m-TGs/per g milk protein and MS3; 75% cow milk + 25% soymilk 1.5 U m-TGs/per g milk protein.. Small letters (a, b, c) indicate significant differences between means within row. Capital letters (A, B, C) indicate significant differences (p<0.05) between means within column.
The changes in the aroma volatiles of all kefirs were determined using SPME-GC-MS, on the 1st d and 30th d of production. 54 volatile compounds known to contribute to kefir aroma were determined (Table 2). The results indicated that m-TGs added kefir has more complex profiles of volatile compounds as compared to the control and MS kefir samples. The total percentage of alcohols, carbonyl compounds and organic acids on total volatiles varied between 2.12-24.91%, 6.49-26.66% and 53.71-68.62%, respectively. Total alcohol contents increased during storage in all the samples. The lowest total alcohol rates were determined on the 1st day of the control sample (2.12%), while higher total alcohol rates were determined on the 30th d in MS sample (25.24%). Carbonyl compounds decreased during storage for all samples and the lowest carbonyl rates were determined on the 30th d in MS2 (6.49%), while higher alcohol rates were determined on the 1st day in MS3 sample (28.99%). As for organic acids, all the samples, excluding the control, were observed to increase in terms of organic acid content during storage (Table 2). In kefir, the most abundant volatile components were tetradecanoic acid (CAS) myristic acid, dodecanoic acid (CAS) lauric acid, benzoic acid (CAS), capric acid, octanoic acid (CAS) caprylic acid, hexanoic acid (CAS) n-hexanoic acid, acetic acid, 1-octen-3-ol (CAS), Hexanol, 2-butanone, 3-hydroxy- (CAS) acetoin, hexanal (CAS) n-hexanal, 2,3-butanedione (diacetyl) and carbon dioxide (CAS). Results of the statistical analysis revealed that both treatment and storage time significantly affected the content of all volatile compounds except for 2-penten-1-ol, (Z) and propanoic acid (p<0.05). Some volatile compounds decreased, while some volatile compounds increased during storage; in retrospect some volatile compounds were lost. The most important changes were determined in 2,3-Butanedione (diacthyl), 2,3-pentanedione (CAS) 2,3-pentadione, 2-nonanone (CAS) methyl heptyl ketone and 2-butanone 3-hydroxy- (CAS) acetoin. Those compounds were determined on the 1st d, but they disappeared in all the tested types of kefir except for the control sample during 30th d of storage. Carbonyl compounds had a significant effect on aroma in fermented milk products. Especially, acetaldehyde, diacetyl, acetoin and acetone synthesis had importance in the kefir samples (Güzel-Seydim et al., 2000). Acetaldehyde takes place during the first day of the fermentation and can be converted to ethanol by alcohol dehydrogenase. Determination of the lower amount of acetaldehyde in the kefir samples may be attributed to this phenomenon. Higher acetaldehyde content was determined in the MS1 kefir sample on the 30th d of storage and at all samples exhibited an increase during storage. On the contrary of some researches (Özer et al., 2007), in this study we observed that acetaldehyde contents in m-TGs added samples were higher as compared to the control samples. It can be speculated that m-TGs might encourage acetaldehyde formation in kefir samples. Similar results were also reported by Şanlı et al. (2011) for yogurt samples. Diacetyl, a product of glucose catabolism, had the highest similar rate in control and MS3 samples on the 1st d of storage and it disappeared in all samples at the end of storage. Similar results were also determined for acetoin rates. Our results confirm the results by Beshkova et al. (2003). CO2 and ethanol are the cause of the specific aroma and exotic refreshing flavor of kefir (Zajšek and Goršek 2010). Ethanol and CO2 concentrations increased in all the samples during storage and varied between 0.18-1.67%, 1.27-2.80%, respectively, as observed by Beshkova et al. (2003), Garcia Fontan et al. (2006) and Özer et al. (2007).
Values are means ± standard deviation of three replicates. Control; Cow’s milk without both m-TGs and without soy milk, MS; 75% cow milk + 25% soymilk without m-TGs, MS1; 75% cow milk + 25% soymilk + 0.5 U m-TGs/per g milk protein, MS2; 75% cow milk + 25% soymilk + 1 U m-TGs/per g milk protein and MS3; 75% cow milk + 25% soymilk 1.5 U m-TGs/per g milk protein. a-h indicate significant differences between means within row (p<0.05).
Conclusions
The results indicated that enzymatic cross-linking of milk proteins by m-TGs improved the properties of kefir. Syneresis could be decreased and viscosity could be increased by adding m-TGs. Microbiological analysis showed that adding m-TGs does not have a negative role on the microbial activity. The differences in the content of volatile aroma compounds were determined for treatments and during storage. The highest content of alcohols, carbonyl compounds and acids were detected in MS2, MS3 and control samples, respectively. The sensorial properties of the m-TGs added kefir were significantly higher than those without m-TGs. It can be concluded that this type of kefir could be accepted by the consumer. The data obtained in this study, clearly indicated that soymilk and m-TGs might be used more effectively in the production of kefir.