Introduction
Cheese consumption has been increasing gradually in Korea since the 1990s (KDC, 2016), but the cases of contamination with Listeria monocytogenes, Staphylococcus aureus, and Escherichia coli have been reported (Jo et al., 2007; Tekinsen and Özdemir, 2006; Thayer et al., 1998). Especially, E. coli has been isolated from various cheeses in many countries (Haran et al., 2011; Zinke et al., 2012).
E. coli, a facultative anaerobic Gram-negative bacillus, is commonly found in the intestinal flora of humans and animals, and certain strains are pathogenic (MFDS, 2010; Olsvik et al., 1991). According to infection symptoms and pathogenesis, pathogenic E. coli strains are classified e.g., enteropathogenic E. coli (EPEC), enteroinvasive E. coli (EIEC), enterotoxigenic E. coli (ETEC), enterohemorrhagic E. coli (EHEC), and enteroaggregative E. coli (EAEC) (Nataro and Kaper, 1998; Yoon, 2009). Among the pathogenic E. coli strains, E. coli O157:H7 is one of the major concerns in the dairy industry, and the survival of the pathogens in various cheeses has been well documented (Griffin and Tauxe, 1991; Reitsma and Henning, 1996). Thus, several countries (EU, USA, and Canada) have a quantitative standard or “zero tolerance” policy for control of the pathogens in cheese (EC, 2005; FDA, 2009; Health Canada, 2008); several microbiological risk assessments for E. coli O157:H7 in cheese have also been conducted (FSANZ, 2009; Perrin et al., 2015). However, microbial risk assessment for non-EHEC E. coli in cheese has not been conducted. Hence, there is a lack of scientific evidence to determine microbial risk of non-EHEC E. coli.
EPA (2012) recommends microbiological risk assessment to evaluate the risk posed by bacteria, to prevent foodborne illnesses, and to identify environmental factors influencing microbial growth. The microbiological risk assessment should include hazard identification, exposure assessment, hazard characterization, and risk characterization (Codex, 1999).
The objective of this study was to conduct microbial risk assessment for non-EHEC E. coli in natural cheese which is manufactured from milk fermentation by adding start culture enzyme, and salt and processed cheeses which are manufactured from natural cheese using emulsifiers in Korea.
Materials and Methods
To identify the hazards of E. coli, the general characteristics and foodborne-illness outbreaks linked to E. coli in cheese were collected from other studies.
To evaluate non-EHEC E. coli prevalence and the contamination level, natural- (n=90) and processed-cheese samples (n=308) were collected from various cheese factories and markets. At two factories, samples were collected throughout the manufacturing process from raw milk to packaged cheese. Natural-cheese samples were collected from raw milk, pasteurized milk, cheese before ripening, cheese after packaging, cheese before shipping, and markets. Processed-cheese samples were also collected after packaging, before shipping, and in markets. In addition, distributed cheeses were collected from local markets in five cities in Korea. Cheese samples were evaluated in both summer and winter to reduce the effect of external environmental factors such as temperature, humidity and contamination levels of the pathogen. The collected samples were placed in an ice cooler and were transported to a laboratory. One-milliliter samples of raw milk and pasteurized milk were serially diluted with 0.1% buffered peptone water (BPW; Becton, Dickinson, and Company, USA). The diluents were then surface-plated on tryptic soy agar (TSA; Becto, Dickinson, and Company) and E. coli /Coliform Count petrifilm (3M™, USA) to quantify total bacteria, and non-EHEC E. coli and coliform counts, respectively. In addition, 25 g or 1 slice of cheese was aseptically transferred into a sample bag (3M™), and 25 mL of BPW was added, and the mixture was homogenized for 120 s with a pummeler (Bag-Mixer®, Interscience, France). One milliliter of the homogenate was serially diluted with BPW, and 0.1-mL diluents for TSA and 1-mL diluents for non-EHEC E. coli / Coliform Count petrifilm (3M™) were then surface-plated, respectively. The plates and petrifilms were incubated at 35°C for 24 h, and then the colonies were manually counted.
Beta distribution is a continuous probability distribution parametrized by two shape parameters (α1 and α2), and the interval of the distribution is zero to one (Johnson et al., 1995). When the number of positive samples is low, beta distribution can be used to estimate bacterial prevalence. The data on non-EHEC E. coli prevalence in cheese were fitted to a Beta distribution (α1, α2), where α1 is the number of positive samples + 1, and α2 is the number of all tested samples - positive samples + 1 (Vose, 1998). Uniform distribution is also a continuous probability distribution defined by the two parameters (a and b), and the distribution indicates equal probability in the range of two parameters. Because non-EHEC E. coli were detected under detection limit, initial concentration was assumed in the range of zero to detection limit. Thus, the data on the non-EHEC E. coli contamination level in cheese from cheese factory storage were fitted to a Uniform distribution (a, b), where a is the minimal contamination level, and b is the maximal contamination level. Finally, the initial contamination level (Log CFU/g) was calculated by prevalence × contamination level using the @RISK software, version 5.7 (Palisade Corp., USA).
To calculate non-EHEC E. coli growth during distribution and storage, predictive models for natural and processed cheeses from a study by MFDS (2013) were used as follows.
<Natural cheese>
<Processed cheese>
The μmax (Log CFU/g) is the maximum specific growth rate, LPD (h) is lag phase duration, and T (°C) is temperature. In addition, to simulate non-EHEC E. coli growth under changing temperature and time, probabilistic distributions for temperature and time from a study by Lee et al. (2015) were used.
Data on cheese consumption and intake frequency of cheese were taken from the study of Lee et al. (2015) to calculate the non-EHEC E. coli risk as a result of cheese consumption in Korea. According to a study by Lee et al. (2015), the mean consumption amounts of natural cheese and processed cheese are 12.40±19.43 g/d (95% confidence interval: 0.915−34.90 g/d) and 19.46±14.39 g/d (95% confidence interval: 2.6−40.0 g/d), respectively, and the consumption frequencies of cheese are 0.0389 and 0.0232 for natural and processed cheese, respectively. The ratios were fitted to the Discrete distribution{(0,1), [1 − (daily frequency of consumption), daily frequency of consumption]} (Lee et al., 2015). Finally, ingested E. coli cell counts were calculated as a result of consuming natural or processed cheese from the final concentration at the time of consumption taking into account the consumption amount and frequency.
Twenty-eight dose-response models for E. coli infection were surveyed from other studies. Because about 90% of E. coli foodborne illness in Korea occurred by EPEC (Hong et al., 2005), the following dose-response model developed by Powell et al. (2000) for EPEC was used in this study.
Where P is the probability of illness, D is the ingested E. coli cell number (CFU/serving), N50 is the dose infecting 50% of the population with E. coli, and α is a coefficient.
The results of the exposure assessment, dose-response model, and cheese consumption amount and frequency were used to estimate the risk of non-EHEC E. coli in cheese by means of a simulation in software @RISK according to the scheme of the simulation model in Fig. 1. In the simulation for risk characterization, the sampling type was Median Latin Hypercube, and the generator seed was random with settings for 10,000 iterations. Tables 1 and 2 show simulation models and formulas for calculating the risk of non-EHEC E. coli in natural and processed cheeses by means of @RISK. Sensitivity analysis to determine factors influencing the risk was also conducted in @RISK.
| Input Model | Unit | Code | Formula | References |
|---|---|---|---|---|
| PRODUCT | ||||
| Product | ||||
| Pathogen Contamination | ||||
| level | ||||
| Non-EHEC E. coli | PR | =RiskBeta(1,91) | Vose (1998) | |
| prevalence | ||||
| Concentration | CFU/g | C | =RiskUniform(0,2) | Vose (1998) |
| Initial contamination level | CFU/g | IC | =PR×C | Vose (1998) |
| Log CFU/g | log(IC) | =log(PR×C) | ||
| TRANSPORTATION | ||||
| Transportation time | h | timetrans | =RiskPert(1,3,6) | Personal communicationa |
| Food temperature | °C | temptrans | =RiskPert(0,4,10) | Personal communicationa |
| during transportation | ||||
| Input Model | Unit | Code | Formula | References |
|---|---|---|---|---|
| Growth | ||||
| h0 | Log CFU/g | h0 | =average(growth rate×lag time), Fixed 2.26 | MFDS (2013), |
| Baranyi and Roberts (1994) | ||||
| Y0 | Log CFU/g | Y0 | =average(Y0i), Fixed 3.36 | MFDS (2013), |
| Baranyi and Roberts (1994) | ||||
| Yend | Log CFU/g | Yend | =average(Yendi), Fixed 9.04 | MFDS (2013), |
| Baranyi and Roberts (1994) | ||||
| ln(q) | ln(q) | =LN{1/[EXP(h0)−1]} | MFDS (2013), | |
| Baranyi and Roberts (1994) | ||||
| Lag time | h | TransLt | =IF{Temptrans>4, | MFDS (2013) |
| [1/(−0.0522+0.0142×Temptrans)]2, 1320} | ||||
| Growth rate | Log CFU/g/h | TransGr | =IF{Temptrans>5.4235, | MFDS (2013) |
| [0.0268×(Temptrans−5.4235)]2, 0} | Ratkowsky et al. (1982) | |||
| Non-EHEC | Log CFU/g | C1 | =IC+1/{1+EXP[−ln(q)]}× | MFDS (2013) |
| E. coli growth | [1−10−|Y0−Yend|/LN(10)]×TransGr×timetrans | Baranyi and Roberts (1994) | ||
| MARKET | ||||
| Market storage | ||||
| Storage time | h | Mark-timest | =RiskPert(0,2,48) | Personal communicationb |
| Food temperature | °C | Mark-Tempst | =RiskUniform(2,4) | Personal communicationb |
| during storage | ||||
| Growth | ||||
| h0 | Log CFU/g | h0 | =average(growth rate×lag time), Fixed 2.26 | MFDS (2013), |
| Baranyi and Roberts (1994) | ||||
| Y0 | Log CFU/g | Y0 | =average(Y0i), Fixed 3.36 | MFDS (2013), |
| Baranyi and Roberts (1994) | ||||
| Yend | Log CFU/g | Yend | =average(Yendi), Fixed 9.04 | MFDS (2013), |
| Baranyi and Roberts (1994) | ||||
| ln(q) | ln(q) | =LN{1/[EXP(h0)−1]} | MFDS (2013), | |
| Baranyi and Roberts (1994) | ||||
| Lag time | h | Markst−TimeLt | =IF{Mark−Tempst>4, | MFDS (2013) |
| [1/(−0.0522+0.0142×Mark−Tempst)]2, 1320} | ||||
| Growth rate | Log CFU/g/h | Markst−RGr | =IF{Mark−Tempst>5.4235, | MFDS (2013) |
| [0.0268×(Mark−Tempst−5.4235)]2, 0} | Ratkowsky et al. (1982) | |||
| Non-EHEC | Log CFU/g | C2−1 | =C1+1/{1+EXP[−ln(q)]}×[1−10−|Y0−end|/ | MFDS (2013) |
| E. coli growth | LN(10)]×Markst−RGr×Mark−timest | Baranyi and Roberts (1994) | ||
| Market display | ||||
| Storage time | h | Mark-timedis | =RiskPert(0,48,168) | Personal communicationb |
| Food temperature | °C | Mark-Tempdis | =RiskTriang(0.60703,4.1000,15.18) | Lee et al. (2015) |
| during storage | ||||
| Growth | ||||
| h0 | Log CFU/g | h0 | =average(growth rate×lag time), Fixed 2.26 | MFDS (2013), |
| Baranyi and Roberts (1994) | ||||
| Y0 | Log CFU/g | Y0 | =average(Y0i), Fixed 3.36 | MFDS (2013), |
| Baranyi and Roberts (1994) | ||||
| Yend | Log CFU/g | Yend | =average(Yendi), Fixed 9.04 | MFDS (2013), |
| Baranyi and Roberts (1994) | ||||
| ln(q) | ln(q) | =LN{1/[EXP(h0)−1]} | MFDS (2013), | |
| Baranyi and Roberts (1994) | ||||
| Lag time | h | Markdis−TimeLt | =IF{Mark−Tempdis>4, | MFDS (2013) |
| [1/(−0.0522+0.0142×Mark−Tempdis)]2, 1320} | ||||
| Growth rate | Log CFU/g/h | Markdis−RGr | =IF{Mark−Tempdis>5.4235, | MFDS (2013) |
| [0.0268×(Mark−Tempdis−5.4235)]2, 0} | Ratkowsky et al. (1982) | |||
| Non-EHEC | Log CFU/g | C2 | =(C2−1)+1/{1+EXP[−ln(q)]}×[1−10−|Y0−end|/ | MFDS (2013) |
| E. coli growth | LN(10)]×Markdis−RGr×Mark−timedis | Baranyi and Roberts (1994) | ||
| Input Model | Unit | Code | Formula | References |
|---|---|---|---|---|
| TRANSPORTATION (CAR) | ||||
| Transportation | ||||
| (CAR) storage | ||||
| Transportation time | h | timecar | =RiskPert(0.325,0.984,1.643) | Jung (2011) |
| Food temperature | °C | Tempcar | =RiskPert(10,18,25) | Jung (2011) |
| during transportation | ||||
| Growth | ||||
| h0 | Log CFU/g | h0 | =average(growth rate×lag time), Fixed 2.26 | MFDS (2013), |
| Baranyi and Roberts (1994) | ||||
| Y0 | Log CFU/g | Y0 | =average(Y0i), Fixed 3.36 | MFDS (2013), |
| Baranyi and Roberts (1994) | ||||
| Yend | Log CFU/g | Yend | =average(Yendi), Fixed 9.04 | MFDS (2013), |
| Baranyi and Roberts (1994) | ||||
| ln(q) | ln(q) | =LN{1/[EXP(h0)−1]} | MFDS (2013), | |
| Baranyi and Roberts (1994) | ||||
| Lag time | h | Car-TimeLt | =IF{Tempcar>4, | MFDS (2013) |
| [1/(−0.0522+0.0142×Tempcar)]2, 1320} | ||||
| Growth rate | Log CFU/g/h | Car−RGr | =IF{Tempcar>5.4235, | MFDS (2013) |
| [0.0268×(Tempcar−5.4235)]2, 0} | Ratkowsky et al. (1982) | |||
| Non-EHEC | Log CFU/g | C3 | =C2+1/{1+EXP[−ln(q)]}×[1−10−|Y0−Yend|/ | MFDS (2013) |
| E. coli growth | LN(10)]×Car−RGr×timecar | Baranyi and Roberts (1994) | ||
| HOME | ||||
| Home storage | ||||
| Storage time | h | Home-timest | RiskNormal[250.1742, 176.0175, | Lee et al. (2015) |
| RiskTruncate(0,4320)] | ||||
| Food temperature | °C | Home-Tempst | =RiskLogLogistic[-29.283, 33.227, 26.666, | Lee et al. (2015) |
| during storage | RiskTruncate(−5,20)] | |||
| Growth | ||||
| h0 | Log CFU/g | h0 | =average(growth rate×lag time), Fixed 2.26 | MFDS (2013), |
| Baranyi and Roberts (1994) | ||||
| Y0 | Log CFU/g | Y0 | =average(Y0i), Fixed 3.36 | MFDS (2013), |
| Baranyi and Roberts (1994) | ||||
| Yend | Log CFU/g | Yend | =average(Yendi), Fixed 9.04 | MFDS (2013), |
| Baranyi and Roberts (1994) | ||||
| ln(q) | ln(q) | =LN{1/[EXP(h0)−1]} | MFDS (2013), | |
| Baranyi and Roberts (1994) | ||||
| Lag time | h | Home−TimeLt | =IF{Home−Tempst>4, | MFDS (2013) |
| [1/(−0.0522+0.0142×Home−Tempst)]2, 1320} | ||||
| Growth rate | Log CFU/g/h | Home−RGr | =IF{Home−Tempst>5.4235, | MFDS (2013) |
| [0.0268×(Home−Tempst−5.4235)]2, 0} | Ratkowsky et al. (1982) | |||
| Non-EHEC | Log CFU/g | C4 | =C3+1/{1+EXP[−ln(q)]}×[1−10−|Y0−Yend|/ | MFDS (2013) |
| E. coli growth | LN(10)]×Home−RGr×Home−timest | Baranyi and Roberts (1994) | ||
| CONSUMPTION | ||||
| Daily consumption | g | Consump | =RiskPearson5[2.6488, 25.81, | MFDS (2013) |
| average amount | RiskTruncate(0,100),RiskShift(-3.2572)] | |||
| Daily consumption | % | ConFre | Fixed 3.894 | MFDS (2013) |
| frequency | ||||
| CF(0) | =1−3.894/100 | MFDS (2013), | ||
| CF(1) | =3.894/100 | MFDS (2013), | ||
| CF | =RiskDiscrete[{0,1},{CF(0),CF(1)}] | MFDS (2013), | ||
| ConFre | =IF(CF=0,0,Consump) | MFDS (2013), | ||
| DOSE-RESPONSE | ||||
| Non-EHEC E. coli amount | D | =10C4×ConFre | ||
| Parameter of α | α | =Fixed 2.21×10⁻¹ | Powell (2000) | |
| Parameter of N50 | N50 | =Fixed 6.85×10⁷ | Powell (2000) | |
| RISK | ||||
| Probability of | Risk | =1−(1+{D×[(21/α)−1]/N50})−α | Powell (2000) | |
| illness/person/day | ||||
aWith a supervisor of a cheese manufacturing plant
bWith a manager in charge of cheese products at markets
| Input Model | Unit | Code | Formula | References |
|---|---|---|---|---|
| PRODUCT | ||||
| Product | ||||
| Pathogen Contamination | ||||
| level | ||||
| Non-EHEC E. coli | PR | =RiskBeta(1,309) | Vose (1998) | |
| prevalence | ||||
| Concentration | CFU/g | C | =RiskUniform(0,2.8) | Vose (1998) |
| Initial contamination level | CFU/g | IC | =PR×C | Vose (1998) |
| Log CFU/g | log(IC) | =log(PR×C) | ||
| TRANSPORTATION | ||||
| Transportation time | h | timetrans | =RiskPert(1,3,6) | Personal communicationa |
| Food temperature | °C | Temptrans | =RiskPert(0,4,10) | Personal communicationa |
| during transportation | ||||
| Growth | ||||
| h0 | Log CFU/g | h0 | =average(growth rate×lag time), Fixed 0.65 | MFDS (2013), |
| Baranyi and Roberts (1994) | ||||
| Y0 | Log CFU/g | Y0 | =average(Y0i), Fixed 3.11 | MFDS (2013), |
| Baranyi and Roberts (1994) | ||||
| Yend | Log CFU/g | Yend | =average(Yendi), Fixed 7.32 | MFDS (2013), |
| Baranyi and Roberts (1994) | ||||
| ln(q) | ln(q) | =LN{1/[EXP(h0)−1]} | MFDS (2013), | |
| Baranyi and Roberts (1994) | ||||
| Lag time | h | TransLt | =IF{Temptrans>4, | MFDS (2013) |
| [1/(−0.0826+0.0275×Tempcar)]2, 1320} | ||||
| Growth rate | Log CFU/g/h | TransGr | =IF(Temptrans>8.6,0.0036−0.0030×Temptrans+ | MFDS (2013) |
| 0.0004×Temptrans2, 0) | Ratkowsky et al. (1982) | |||
| Non-EHEC | Log CFU/g | C1 | =IC+1/{1+EXP[−ln(q)]}×[1−10−|Y0−Yend|/ | MFDS (2013) |
| E. coli growth | LN(10)]×TransGr×timetrans | Baranyi and Roberts (1994) | ||
| MARKET | ||||
| Market storage | ||||
| Storage time | h | Market-timest | =RiskPert(0,2,48) | Personal communicationb |
| Food temperature | °C | Mark-Tempst | =RiskUniform(2,4) | Personal communicationb |
| during storage | ||||
| Growth | ||||
| h0 | Log CFU/g | h0 | =average(growth rate×lag time), Fixed 0.65 | MFDS (2013), |
| Baranyi and Roberts (1994) | ||||
| Y0 | Log CFU/g | Y0 | =average(Y0i), Fixed 3.11 | MFDS (2013), |
| Baranyi and Roberts (1994) | ||||
| Yend | Log CFU/g | Yend | =average(Yendi), Fixed 7.32 | MFDS (2013), |
| Baranyi and Roberts (1994) | ||||
| ln(q) | ln(q) | =LN{1/[EXP(h0)−1]} | MFDS (2013), | |
| Baranyi and Roberts (1994) | ||||
| Lag time | h | Markst−TimeLt | =IF{Mark−Tempst>4, | MFDS (2013) |
| [1/(−0.0826+0.0275×Mark−Tempst)]2, 1320} | ||||
| Growth rate | Log CFU/g/h | Markst−RGr | =IF(Mark−Tempst>8.6,0.0036−0.0030× | MFDS (2013) |
| Mark−Tempst+0.0004×Mark−Tempst2, 0) | Ratkowsky et al. (1982) | |||
| Non-EHEC | Log CFU/g | C2−1 | =C1+1/{1+EXP[−ln(q)]}×[1−10−|Y0−Yend|/ | MFDS (2013) |
| E. coli growth | LN(10)]×Mark−RGr×Mark−timest | Baranyi and Roberts (1994) | ||
| Market display | ||||
| Storage time | h | Mark−timedis | =RiskPert(0,48,168) | Personal communicationb |
| Food temperature | °C | Mark−Tempdis | =RiskTriang(0.60703,4.1000,15.18) | Lee et al. (2015) |
| during storage | ||||
| Growth | ||||
| h0 | Log CFU/g | h0 | =average(growth rate×lag time), Fixed 0.65 | MFDS (2013), |
| Baranyi and Roberts (1994) | ||||
| Input Model | Unit | Code | Formula | References |
|---|---|---|---|---|
| Y0 | Log CFU/g | Y0 | =average(Y0i), Fixed 3.11 | MFDS (2013), |
| Baranyi and Roberts (1994) | ||||
| Yend | Log CFU/g | Yend | =average(Yendi), Fixed 7.32 | MFDS (2013), |
| Baranyi and Roberts (1994) | ||||
| ln(q) | ln(q) | =LN{1/[EXP(h0)−1]} | MFDS (2013), | |
| Baranyi and Roberts (1994) | ||||
| Lag time | h | Markdis−TimeLt | =IF{Mark−Tempdis>4, | MFDS (2013) |
| [1/(−0.0826+0.0275×Mark−Tempdis)]2, 1320} | ||||
| Growth rate | Log CFU/g/h | Markdis−RGr | =IF(Mark−Tempdis>8.6,0.0036−0.0030× | MFDS (2013) |
| Mark−Tempdis+0.0004×Mark−Tempdis2, 0) | Ratkowsky et al. (1982) | |||
| Non-EHEC | Log CFU/g | C2 | =(C2−1)+1/{1+EXP[−ln(q)]}×[1−10−|Y0−Yend|/ | MFDS (2013) |
| E. coli growth | LN(10)]×Markdis−RGr×Mark−timedis | Baranyi and Roberts (1994) | ||
| TRANSPORTATION (CAR) | ||||
| Transportation | ||||
| (CAR) storage | ||||
| Transportation time | h | timecar | =RiskPert(0.325,0.984,1.643) | Jung (2011) |
| Food temperature | °C | Tempcar | =RiskPert(10,18,25) | Jung (2011) |
| during transportation | ||||
| Growth | ||||
| h0 | Log CFU/g | h0 | =average(growth rate×lag time), Fixed 0.65 | MFDS (2013), |
| Baranyi and Roberts (1994) | ||||
| Y0 | Log CFU/g | Y0 | =average(Y0i), Fixed 3.11 | MFDS (2013), |
| Baranyi and Roberts (1994) | ||||
| Yend | Log CFU/g | Yend | =average(Yendi), Fixed 7.32 | MFDS (2013), |
| Baranyi and Roberts (1994) | ||||
| ln(q) | ln(q) | =LN{1/[EXP(h0)−1]} | MFDS (2013), | |
| Baranyi and Roberts (1994) | ||||
| Lag time | h | Car−TimeLt | =IF{Tempcar>4, | MFDS (2013) |
| [1/(−0.0826+0.0275×Tempcar)]2, 1320} | ||||
| Growth rate | Log CFU/g/h | Car−RGr | =IF(Tempcar>8.6, | MFDS (2013) |
| 0.0036−0.0030×Tempcar+0.0004×Tempcar2, 0) | Ratkowsky et al. (1982) | |||
| Non-EHEC | Log CFU/g | C3 | =C2+1/{1+EXP[−ln(q)]}×[1−10−|Y0−Yend|/ | MFDS (2013) |
| E. coli growth | LN(10)]×Car−RGr×timecar | Baranyi and Roberts (1994) | ||
| HOME | ||||
| Home storage | ||||
| Storage time | h | Home−timest | =RiskNormal[250.1742, 176.0175, | Lee et al. (2015) |
| RiskTruncate(0,4320)] | ||||
| Food temperature | °C | Home−Tempst | =RiskLogLogistic[-29.283, 33.227, 26.666, | Lee et al. (2015) |
| during storage | RiskTruncate(−5,20)] | |||
| Growth | ||||
| h0 | Log CFU/g | h0 | =average(growth rate×lag time), Fixed 0.65 | MFDS (2013), |
| Baranyi and Roberts (1994) | ||||
| Y0 | Log CFU/g | Y0 | =average(Y0i), Fixed 3.11 | MFDS (2013), |
| Baranyi and Roberts (1994) | ||||
| Yend | Log CFU/g | Yend | =average(Yendi), Fixed 7.32 | MFDS (2013), |
| Baranyi and Roberts (1994) | ||||
| ln(q) | ln(q) | =LN{1/[EXP(h0)−1]} | MFDS (2013), | |
| Baranyi and Roberts (1994) | ||||
| Lag time | h | Home−TimeLt | =IF{Home−Tempst>4, | MFDS (2013) |
| [1/(−0.0826+0.0275×Home−Tempst)]2, 1320} | ||||
| Growth rate | Log CFU/g/h | Home−RGr | =IF(Home−Tempst>8.6,0.0036−0.0030× | MFDS (2013) |
| Home−Tempst+0.0004×Home−Tempst2,0) | Ratkowsky et al. (1982) | |||
| Non-EHEC | Log CFU/g | C4 | =C3+1/{1+EXP[−ln(q)]}×[1−10−|Y0−Yend|/ | MFDS (2013) |
| E. coli growth | LN(10)]×Home−RGr×Home−timest | Baranyi and Roberts (1994) | ||
| Input Model | Unit | Code | Formula | References |
|---|---|---|---|---|
| CONSUMPTION | ||||
| Daily consumption | g | Consump | =RiskWeibull[1.3482, 20.932, | MFDS (2013), |
| average amount | RiskShift(0.26384),RiskTruncate(0,100)] | |||
| Daily consumption | % | ConFre | Fixed 2.323 | MFDS (2013) |
| frequency | ||||
| CF(0) | =1−2.323/100 | MFDS (2013) | ||
| CF(1) | =2.323/100 | MFDS (2013) | ||
| CF | =RiskDiscrete{[0,1],[CF(0),CF(1)]} | MFDS (2013) | ||
| ConFre | =IF(CF=0,0,Consump) | MFDS (2013) | ||
| DOSE-RESPONSE | ||||
| Non-EHEC E. coli amount | D | =10C4×ConFre | ||
| Parameter of α | α | =Fixed 2.21×10⁻¹ | Powell (2000) | |
| Parameter of N50 | N50 | =Fixed 6.85×10⁷ | Powell (2000) | |
| RISK | ||||
| Probability of | Risk | =1−(1+{D×[(21/α)−1]/N50})−α | Powell (2000) | |
| illness/person/day | ||||
aWith a supervisor of a cheese manufacturing plant
bWith a manager in charge of cheese products at markets
Results and Discussion
Pathogenic E. coli causes diarrhea in infants or acute enteritis in adults (MFDS, 2010). Although ground beef and fresh vegetables are considered major vectors for pathogenic E. coli (MFDS, 2010), there are several reports about E. coli isolated from various cheeses in many countries. The most frequently isolated E. coli serotype in cheese is E. coli O157:H7 in many countries (BCCDC, 2013; CDC, 2010; Honish et al., 2005), but other pathotypes such as EPEC, ETEC, and EAEC were also isolated from various cheeses (Baranceli et al., 2014; Bonyadian et al., 2014; Najand and Ghanbarpour, 2006). In addition, the most frequently isolated pathotype in Korea in various foods is EPEC (Hong et al., 2015). Thus, after non-EHEC E. coli was identified as a hazard in cheese, subsequent quantitative microbial risk assessment for natural and processed cheeses was conducted.
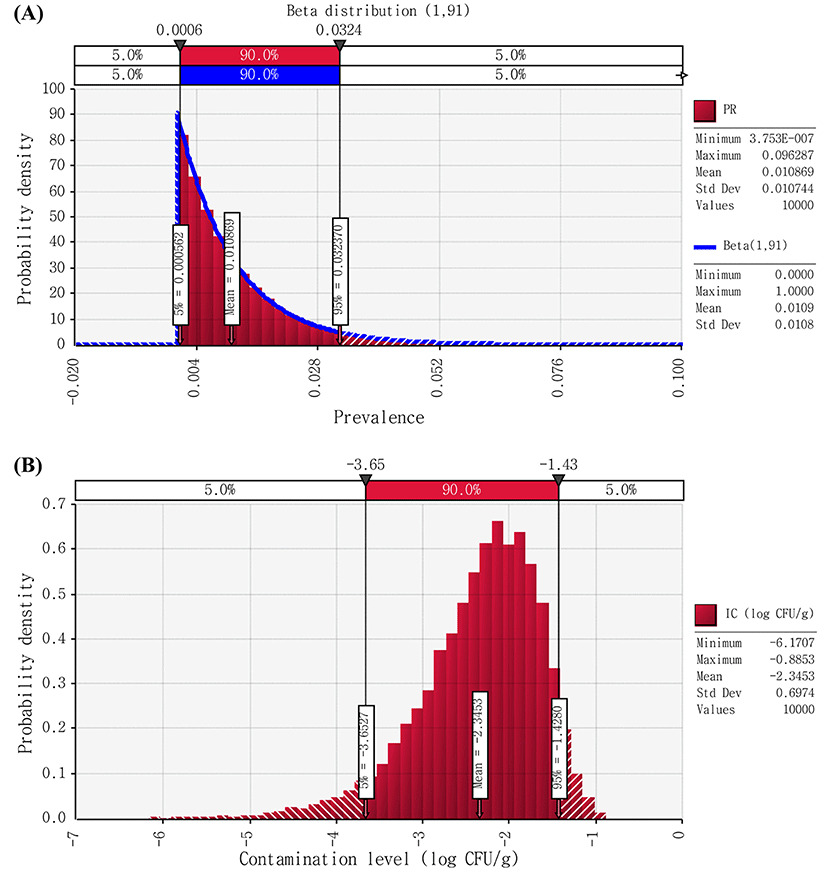
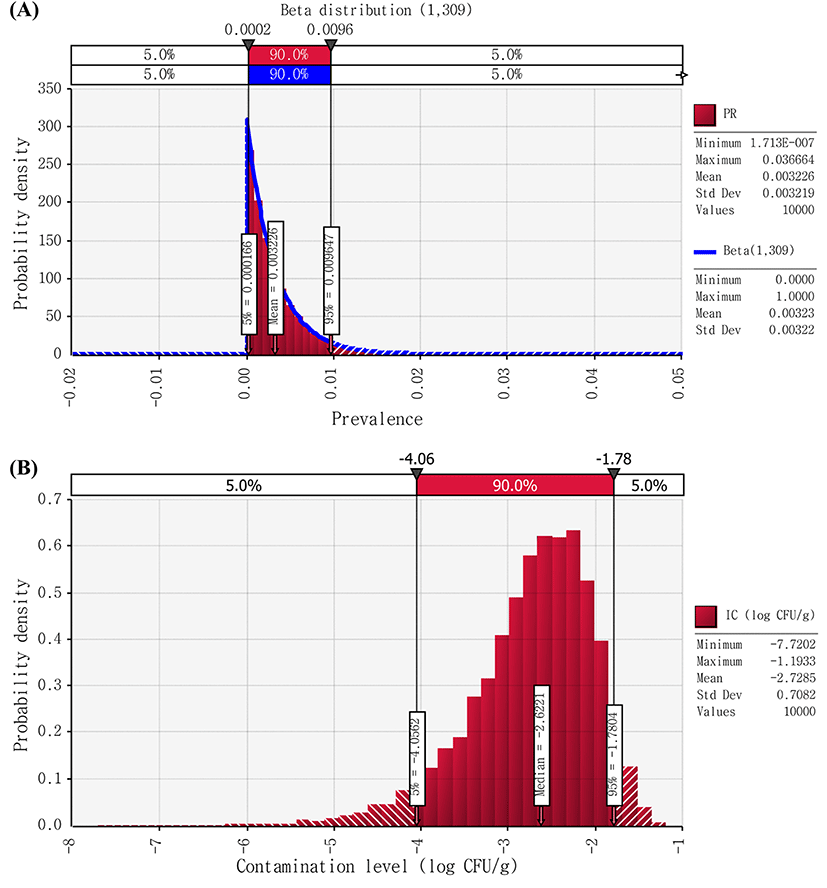
Non-EHEC E. coli cell counts were found to be below the detection limit (natural cheese: 2 CFU/g; processed cheese: 2.8 CFU/g) in all samples. Thus, it was assumed that non-EHEC E. coli cell counts in cheese to be above 0 CFU/g, but below the detection limit (2 CFU/g), and then we described contamination levels of the pathogen with Uniform distribution (0,2) and Uniform distribution (0,2.8) for natural and processed cheese, respectively (Figs. 2 and 3). Therefore, using the @RISK software, the initial contamination level of non-EHEC E. coli were calculated by Beta distribution(1,91) × Uniform distribution(0,2), and Beta distribution(1,309) × Uniform distribution(0,2.8) for natural and processed cheese, respectively. As a result of the simulation, the initial level of contamination with non-EHEC E. coli in cheese was 2.35 and −2.73 Log CFU/g for natural and processed cheese, respectively (Figs. 2 and 3).
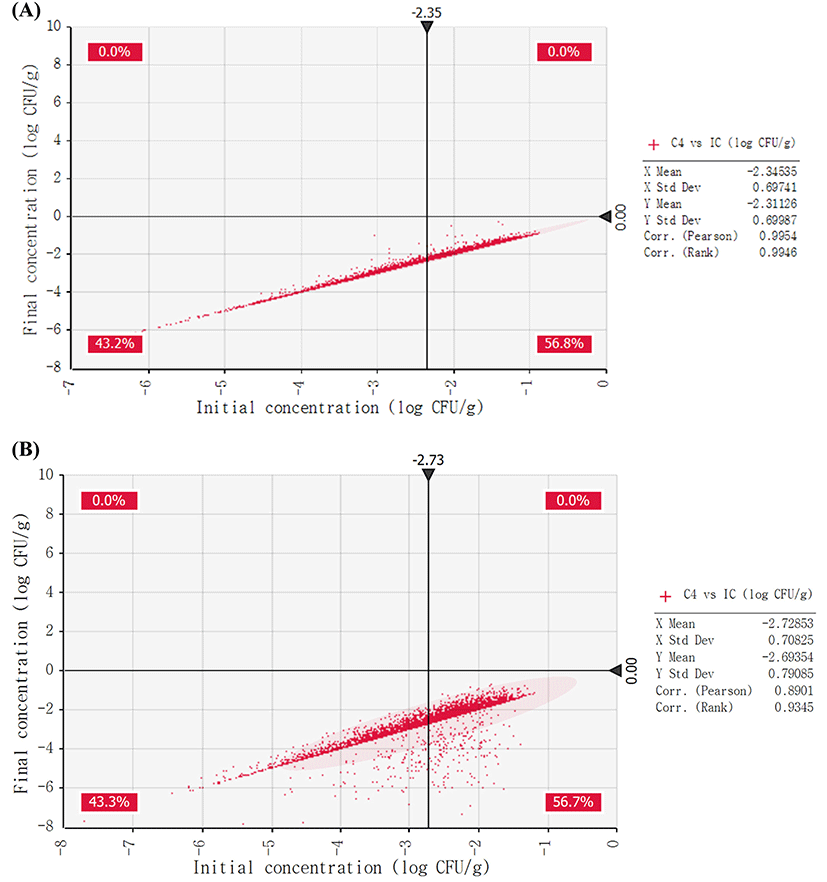
The cumulative distributions of non-EHEC E. coli growth during distribution and storage (initial concentration, concentration after transportation, concentration after storage in a market, concentration at the time of purchase, concentration when at home, and concentration at the time of consumption) were analyzed. As a result of the simulation, in natural cheese, the initial concentration was −2.35 Log CFU/g, and concentration at the final stage (at the time of consumption) was −2.31 Log CFU/g (data not shown). This result indicates that non-EHEC E. coli in natural cheese may not grow during distribution and storage under the conditions in Korea. In addition, non-EHEC E. coli growth probability in processed cheese was similar to that in natural cheese (data not shown). Moreover, the results of comparison of the initial concentration with final concentration indicate that none of the 10,000 iterations could yield more than 0 Log CFU/g at the point of final concentration (Fig. 4).
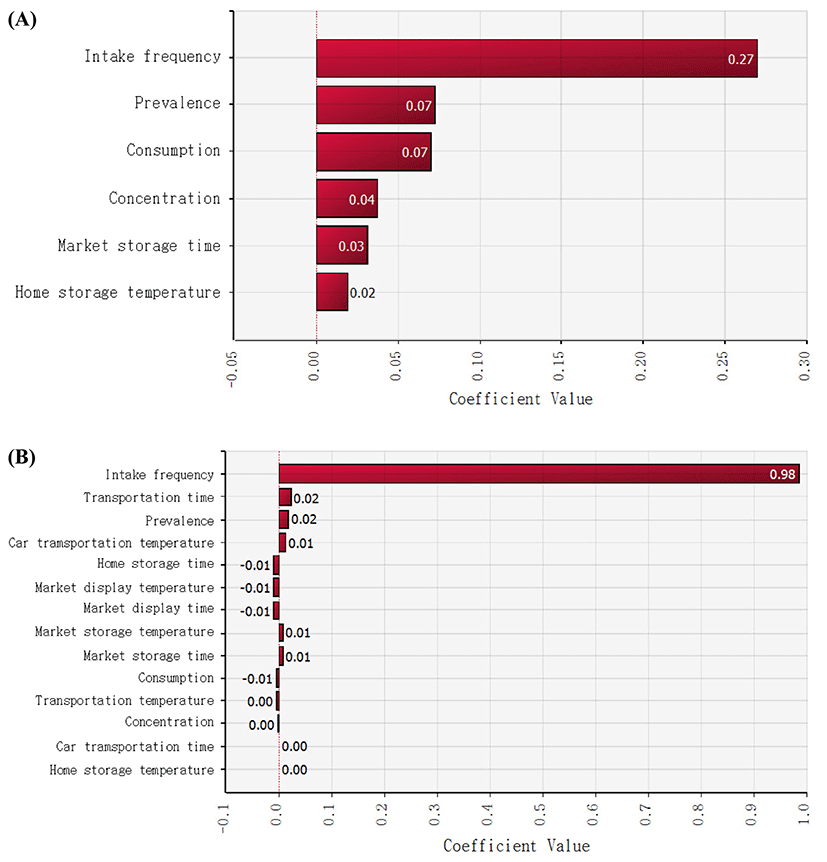
After cheese consumption, to estimate the probability of non-EHEC E. coli foodborne illness, the Beta-Poisson model (α = 2.21×10⁻¹, N50 = 6.85×10⁷) was used (Powell et al., 2000). Subsequently, the simulation model was prepared with the values of input variables such as non-EHEC E. coli prevalence, temperature, and time for distribution and display in markets, and home storage, the amount of cheese consumption, and intake frequency as presented Tables 1 and 2. The simulations were conducted by random sampling from the distribution described above for 10,000 iterations, and the mean probabilities of a non-EHEC E. coli outbreak as a result of cheese consumption per person per day in Korea were 1.36×10⁻⁷ and 2.12×10⁻¹⁰ for natural and processed cheese, respectively (Table 3), which are higher than the risk (7.84×10¹⁰) of S. aureus foodborne illness per person per day as a result of natural cheese consumption and the risk (3.64×10⁻⁹ to 1.30×10⁻⁷) of listeriosis per person per day as a result of eating lettuce at a restaurant in Korea (Ding et al., 2013; Lee et al., 2015). These results indicate that natural cheese poses a high risk of a non-EHEC E. coli outbreak as compared to processed-cheese-related and S. aureus-related foodborne illnesses as a result of natural cheese consumption and listeriosis as a result of lettuce consumption in Korea. In addition, sensitivity analysis revealed that intake frequency was the most influential factor for this risk, whereas the other factors such as storage temperature and time were not obviously related (Fig. 5).
| Probability of illness/(person·d) | 5% | 25% | 50% | 95% | 99% | Maximum | Mean |
|---|---|---|---|---|---|---|---|
| Natural cheese | 0 | 0 | 0 | 0 | 3.34×10⁻⁶ | 2.26×10⁻⁴ | 1.36×10⁻⁷ |
| Processed cheese | 0 | 0 | 0 | 0 | 4.59×10⁻⁹ | 1.20×10⁻⁷ | 2.12×10⁻¹⁰ |
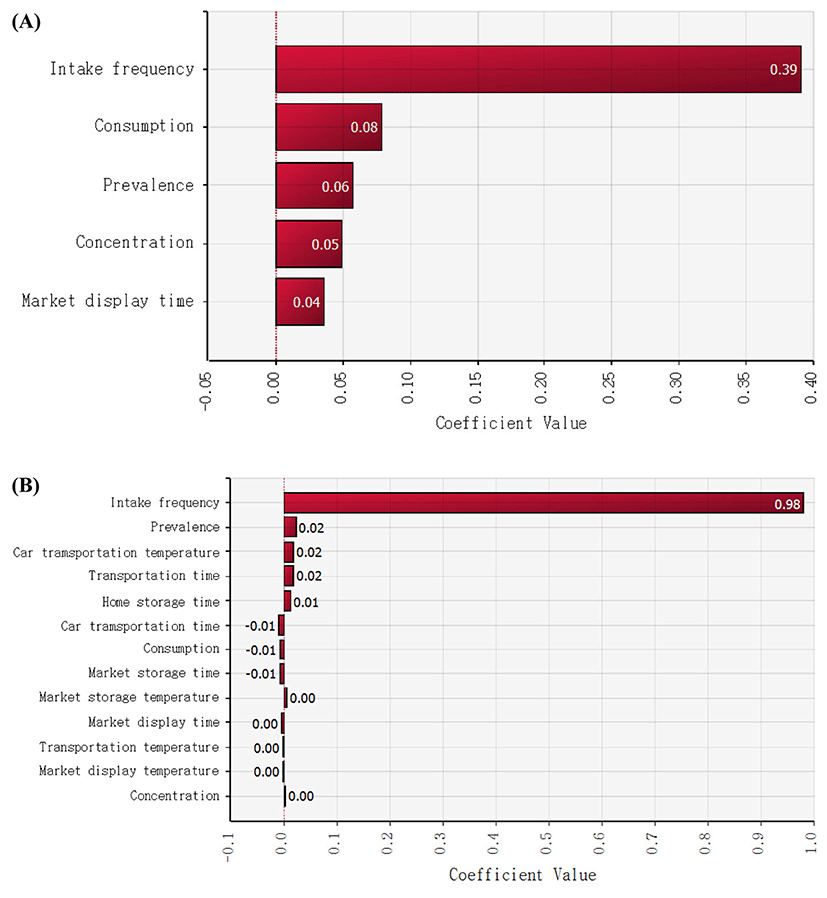
Thus, our results indicate that non-EHEC E. coli cannot grow in natural and processed cheeses under the present distribution and storage conditions, and that a different factor is more important for the risk of illness. Consumption frequency of processed cheese is lower than that of natural cheese, if we assume that the consumption amount of natural and processed cheese is similar. Accordingly, processed cheese poses a lower risk than natural cheese for non-EHEC E. coli.
Conclusion
The risk of a non-EHEC E. coli outbreak via cheese consumption seems to be low for natural and processed cheese in Korea, and the intake frequency of cheese is the most influential factor for this risk. In addition, the microbial risk assessment model that we developed in this study can be useful for quantitative risk assessment.


