Introduction
Meat and meat products are excellent sources of protein, iron, zinc, niacin, and vitamins B6 and B12. Furthermore, they are important components of the modern diet (Brewer, 2012). In Korea, the meat processing industry has progressively developed since the 1980s, especially with regard to sausages, which are the most produced and highly preferred processed meat products among consumers (Kim and Chin, 2018).
The most processed meat products are ham and sausages containing fat, which possess a relatively high proportion of saturated fatty acids compared with other fat sources (Grasso et al., 2014). Currently, consumers favor the consumption of healthy foods (Lim and Chin, 2018) and tend to prefer low-fat foods for the sake of health (Resurreccion, 2004).
However, the pork back fat used in the manufacture of meat product affects the flavor and texture of the final meat product (Domínguez et al., 2017; Kwon et al., 2021) and plays an important role in the product’s rheological and structural properties (Barbut, 2011). Although fat serves an essential role in determining the quality of meat products, several researchers have explored the reduction of fat content while simultaneously enhancing the functionality of meat products by using fat replacers that compensate for the role of fat. Numerous studies have addressed the use of non-meat proteins, such as protein extracts (PEs) from cell cultures; legumes such as soybeans, peas, and faba beans, among others; and edible insects including Tenebrio molitor Linne and Protaetia brevitarsis seulensis.
Among these, Rhynchosia nulubilis (RN) is a round-shaped black bean commonly called “Seomoktae” or “Yakkong” in medicine. RN’s seed coat reportedly prevents cerebrovascular and heart diseases owing to its strong constituent antioxidants, such as glycitein and cyanidin-3-glucoside (Bae and Moon, 1997). Previous studies have reported the extraction of various antioxidants from RN (Hong et al., 2014; Lee et al., 2014; Park and Kim, 2018) and compared the antioxidant and isoflavone (β-glycosides and aglycone) contents of RN subjected to different cooking methods (Shin and Joo, 2016). In particular, Ko and Joo (2005) investigated the quality characteristics of frozen cookies by incorporating RN, due to its high antioxidant capacity and antibacterial effects, which are known for their beneficial functional properties. In addition, the protein content (%) of RN is approximately 37%, rendering it a favorable source of vegetable protein, similar to soybean. Therefore, the application of protein-rich Rhynchosia nulubilis powders (RNPs) as fat replacers in meat products can enhance the quality of these products, resulting in a reduction of fat content and an increase in protein content, thereby facilitating the production of consumer-preferred foods. Similarly, a study on smoothies made with RN, known for its excellent antioxidant capacity and high protein content, was conducted by Joo and Park (2009). However, there is limited research on the application of RN in meat products, particularly regarding its functionality and quality characteristics. Therefore, this study aimed to (1) develop RNPs via various drying methods, (2) extract their protein content, and (3) apply the developed RNPs and extracted protein to pork myofibrillar protein (MP) and low-fat model sausages (LFMS) to enhance superior physical properties and evaluate quality characteristics, respectively.
Materials and Methods
The pork loin (Longissimus dorsi) and ham (Semimembranosus) (Landrace×Yorkshire×Duroc three-way cross-breed pig) used in this study were purchased from a retail meat market, and excess fat and connective tissue were subsequently removed. To extract MP, the pork loin was cut into 1–2 cm3 cubes, vacuum-packed into 200-g samples, and stored frozen at –50°C until use. The ham was ground using a meat chopper (M-12S, Hankook Fujee Machinery, Hwaseong, Korea), vacuum-packed, and stored frozen until sausage manufacture.
The RN used in this experiment was purchased commercially (Daechanfarm, Hamyang, Korea), and freeze-dried or oven-dried (60°C) to produce powder. After being washed in running water, RN had its residual moisture removed, vacuum-packed, and subsequently freeze-dried under –50°C and 7 mm Torr conditions for 102 h in a freeze dryer (IlShin Bio Base, Dongducheon, Korea). After oven- or freeze-drying, the RN powder was filtered through a 500-μm sieve and stored frozen at –70°C until used.
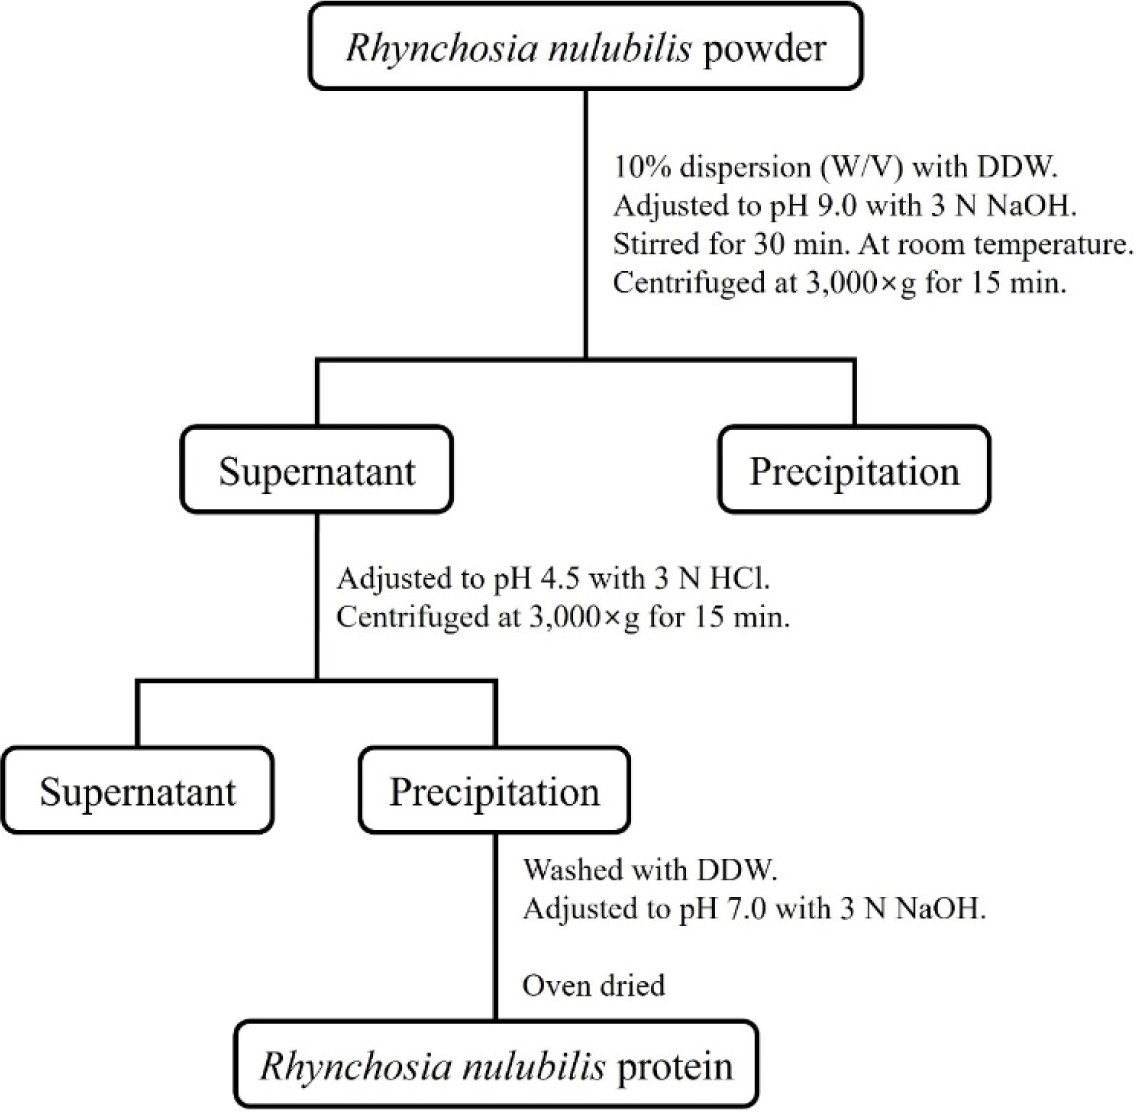
Protein was extracted from the purchased RN (Agricultural Cooperation of Bitgaram Biotechnology, Naju, Korea) following the modified method of Kim et al. (1990), as shown in Fig. 1. After RNPs had been mixed with double-distilled (dd) water at a ratio of 1:10, the pH was adjusted to 9.0 using 3 N NaOH, and the resulting mixture was subsequently stirred at room temperature for 30 min and centrifuged at 3,000×g for 15 min (VS-5500, Vision Science, Daejeon, Korea). After centrifugation, the supernatant was collected and pH adjusted to 4.5 using 3 N HCl, followed by centrifugation at 3,000×g for 15 min again. The separated supernatant was discarded and the precipitate washed using dd water; thereafter, the pH was readjusted to 7.0 using 3 N NaOH. The pH-adjusted extract was oven-dried at 50°C to produce powder. The prepared PE powder was frozen at –70°C until use.
After the frozen pork loins had been thawed at 4°C, they were ground and mixed with 4×0.1 M NaCl and 50 mM sodium phosphate buffer for 90 s. Thereafter, they were centrifuged at 1,000×g and 4°C for 15 min (Supra 22K, Hanil Science Medical, Daejeon, Korea). This process triplicates, and the obtained pellet mixed with 8×0.1 M NaCl. Impurities were subsequently removed using a sterile gauze, and MP was extracted via centrifugation under the same conditions. This process was repeated a total of three times. The concentration of PE was adjusted to 4%. The different RNPs were added 1% (w/w) of the total mixture, and the prepared gel (5 mL) was loaded into vials (Thermo Fisher Scientific, Leicestershire, UK) and placed in a constant-temperature water bath (WB-22, Daihan Scientific, Seoul, Korea) that had been gradually heated from room temperature to 80°C. After heating, it was rapidly cooled on ice and stored at 4°C.
The viscosity of the prepared protein mixture was measured using a concentric cylinder-type rotational rheometer (RC30, Rheo Tec Messtechnik, Ottendorf-Okrilla, Germany). The shear rate was steadily increased from 0 to 600/s for 360 s and, together with shear stress, diagrammed to illustrate the results.
Weight differences between the cooked and cooled gel were measured to evaluate the moisture released during cooking. The measured amount of moisture released during cooking was incorporated into the following equation to obtain the cooking yields (CY; %).
Gel strength (GS) was measured using the puncture test of the Merlin program on a Universal Testing Machine (3344, Instron, Norwood, MA, USA), at a crosshead speed of 50 mm/min.
Sodium dodecyl sulfate–polyacrylamide gel electrophoresis (SDS–PAGE) was performed using the Mini-PROTEAN® 3 Cell System (Bio-Rad Laboratories, Hercules, CA, USA), and 10% acrylamide separating and 4% acrylamide stacking gels were prepared. Loading samples were prepared by mixing 1% protein with sample buffer. After the protein mixture had been loaded with a standard protein marker (Model #161-0318, Bio-Rad Laboratories), it was separated at 150 V for approximately 1.5 h. After the proteins had been completely separated, the protein gels were stained with Coomassie brilliant blue staining solution for 30 min and subsequently destained.
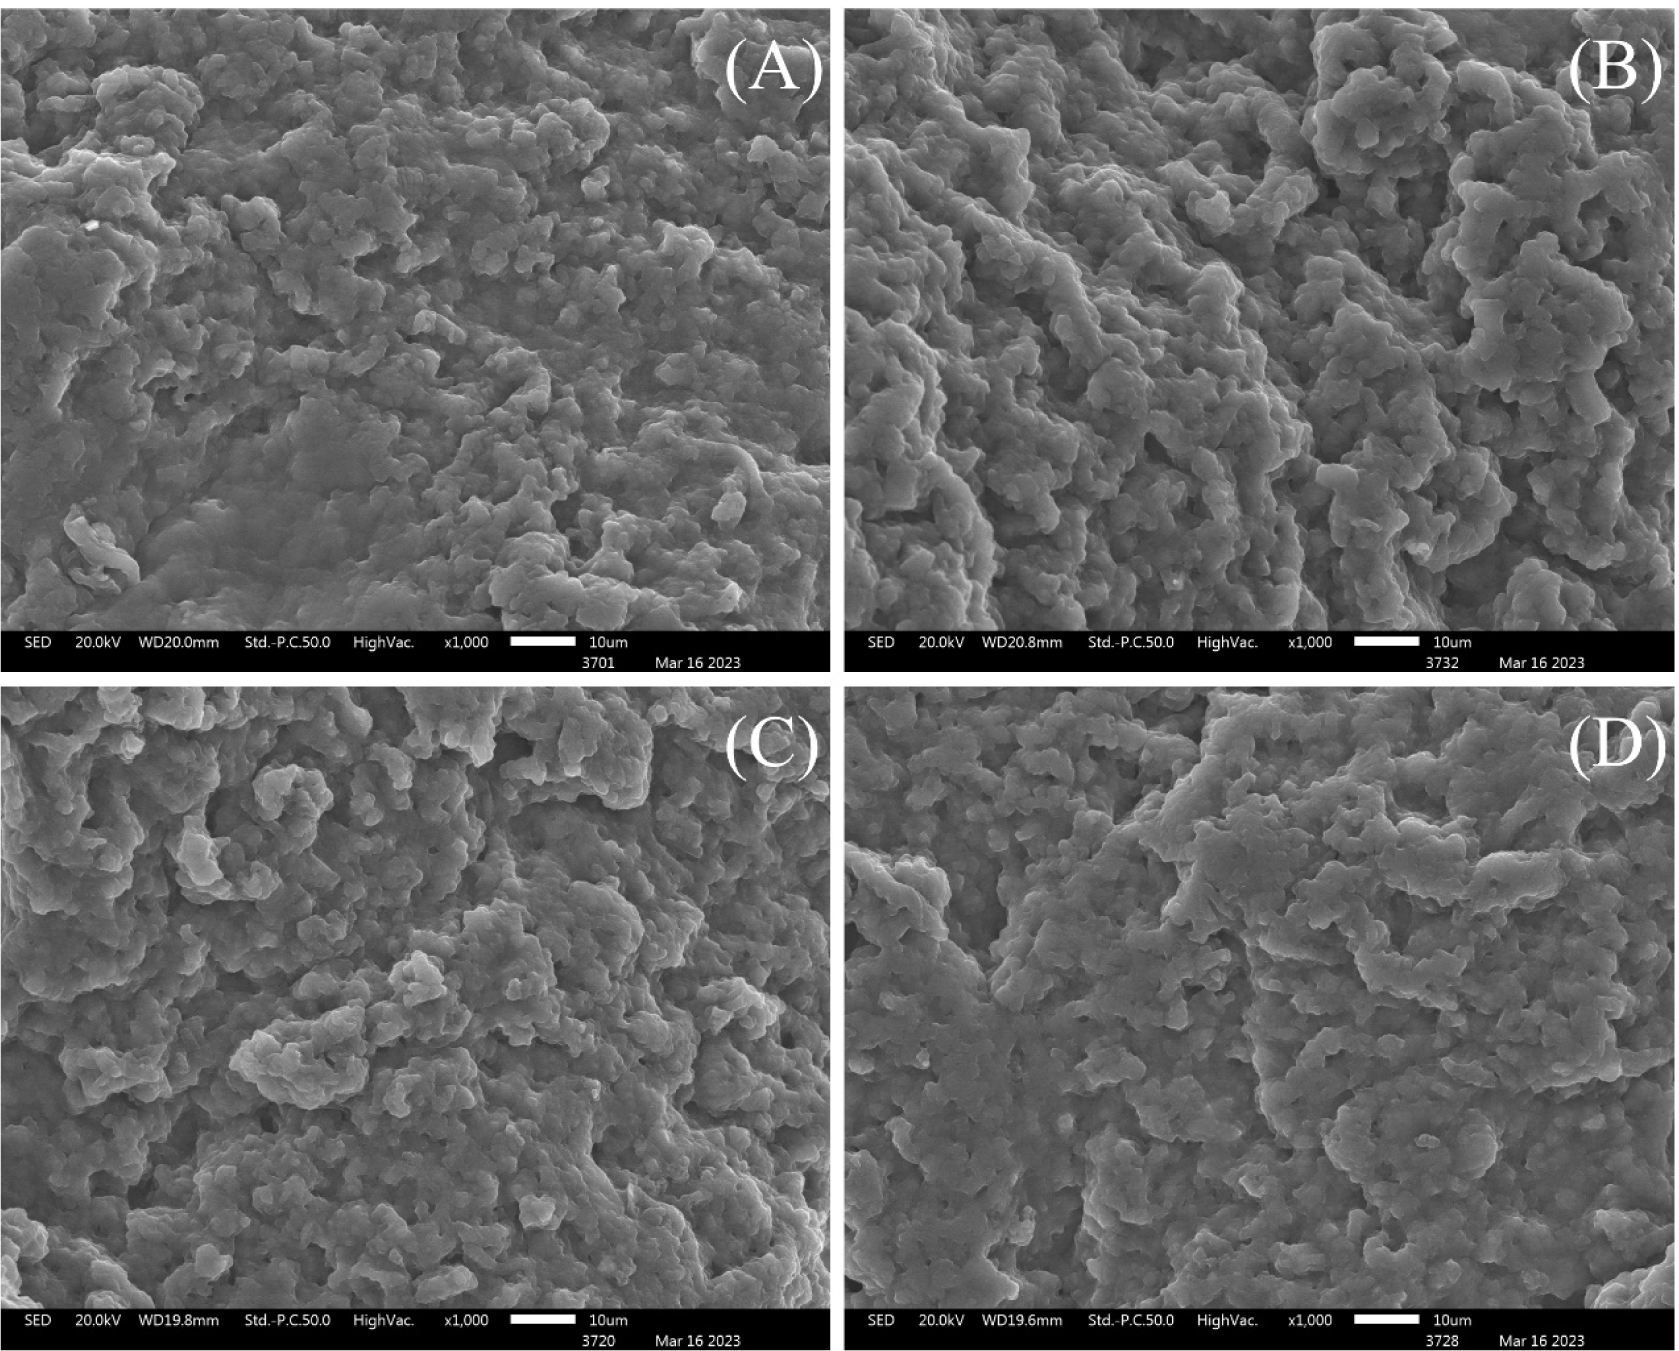
Scanning electron microscopy of the heated gel was performed to determine three-dimensional (3D) structural changes depending on the non-meat protein content after heating. The samples were shaped into cubes (approximately 3×3×3 mm3), placed in 2.5% glutaraldehyde solution and immersed at 4°C for approximately 1 day to fix the protein samples. The samples were treated with 1% osmium tetroxide solution, soaked for 5 h, and subsequently dehydrated by increasing the ethanol concentration (50%–100%) at 10-min intervals. Finally, after completing pretreatment by immersing in acetone, it was dried for approximately 24 h. The dried samples were gold-coated using a model 108 auto sputter coater (Cressington Scientific Instruments, Watford, UK), and the sample surfaces were observed using a low-vacuum scanning electron microscope (JSM-6610LV, JEOL, Tokyo, Japan).
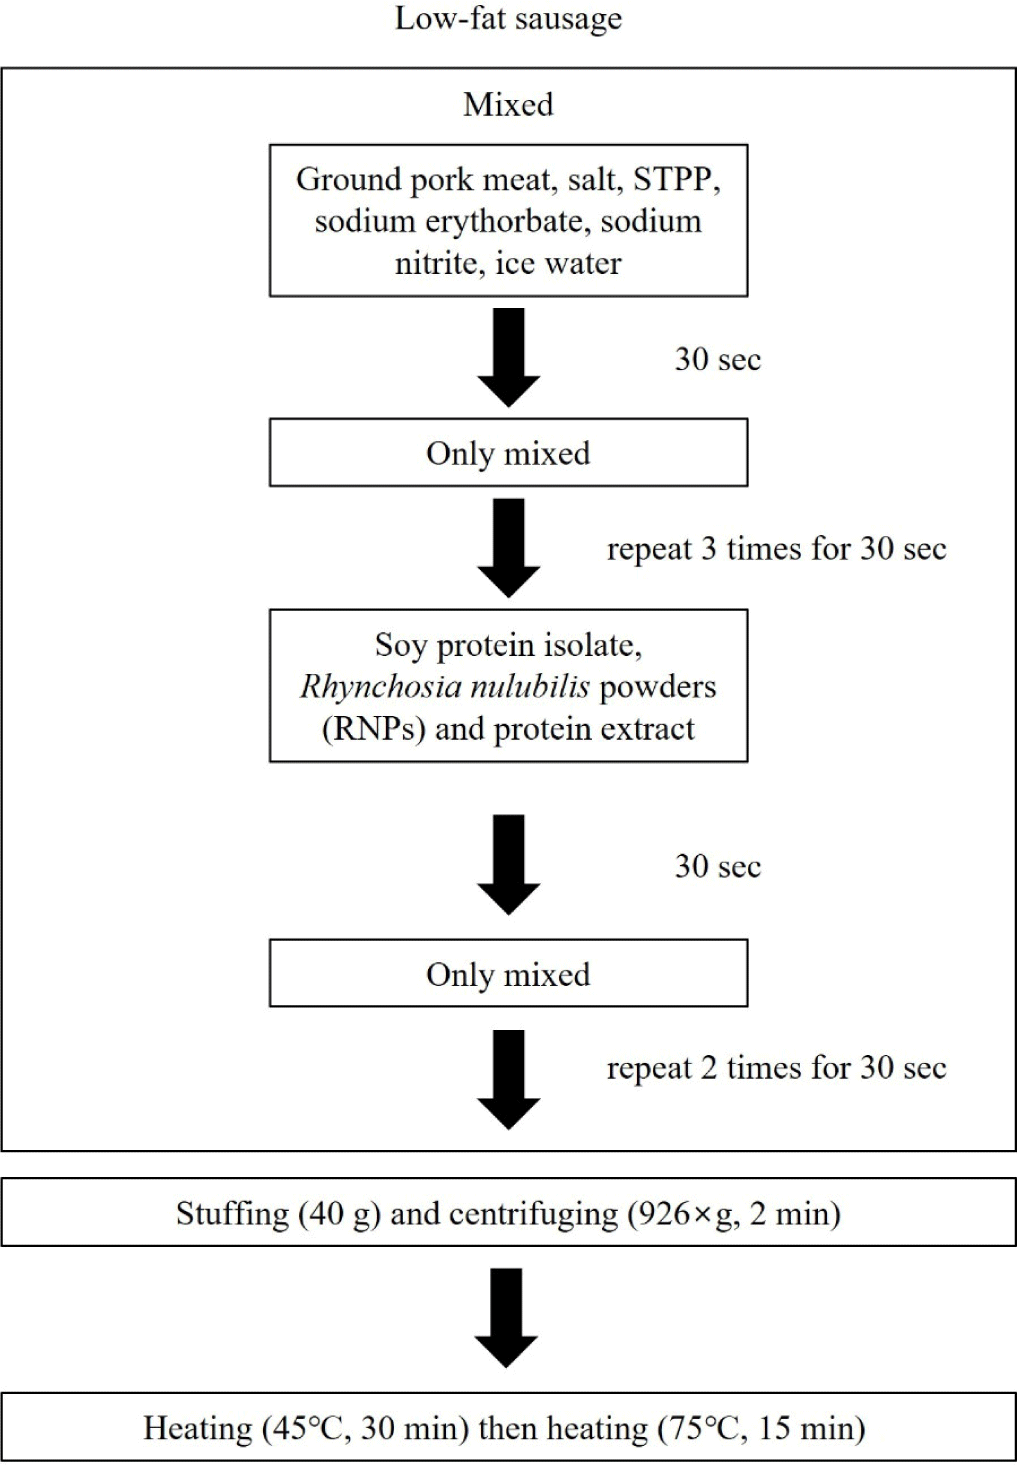
LFMS was prepared by adding 1% RNP and PE, as shown in Table 1. Frozen pork ham was added after thawing overnight at 4°C, and soy protein isolate (SPI) was entirely hydrated with dd water at a ratio of 1:4. Raw meat and ingredients were mixed and comminuted using a mixer (HMC-401, Hanil Electric, Seoul, Korea), and the processing of LFMS is shown in Fig. 2. After comminution, approximately 40 g of the meat batter was added to fill a 50-mL conical tube and centrifuged. Thereafter, it was placed in a water bath (WB-22, Daihan Scientific, Seoul, Korea), heated at 45°C for 30 min, and further heated to 75°C until the center temperature of the sausage had reached 72°C. The heated sausages were cooled on ice and stored at 4°C until use.
pH values were measured five times using a pH meter (Model 340, Mettler-Toledo, Schwarzenbach, Switzerland), and average values were calculated. The color values of the sausages were measured six times using the Minolta Color Reader (CR-10, Minolta, Tokyo, Japan), and average CIE L*, CIE a*, and CIE b* values were calculated.
Moisture, protein, and fat contents (%) were determined using the dry-oven, Kjeldahl, and Soxhlet extraction methods, respectively, according to the AOAC official methods (AOAC, 2000), and average values were calculated.
Sausage weight differences before and after heating were measured, and cooking loss (CL) was determined as the average of the differences using the following formula:
Water-holding capacity (WHC) was measured based on the amount of water released from the sausages. Samples (1.5 g) were enwrapped in three layers of filter paper and centrifuged at 1,000×g for 15 min using a centrifuge (VS-5500, Vision Science, Daejeon, Korea). After centrifugation, the amount of water released by the sample onto the filter paper was measured, and expressible moisture (EM) was calculated using the following formula:
To perform the textural profile analysis, the diameter and height of 10 samples was 0.25 and 1.30 cm, respectively. Textural hardness (gf), springiness (mm), gumminess, chewiness, and cohesiveness were evaluated using a Universal Testing Machine (3344, Instron). Measurement results were expressed as the average of 10 measured values.
Results and Discussion
The pH and color values of SPI, FP, QP, and PE were presented in Table 1. As shown in Table 1, the pH value of PE powder was lower than the others due to the extraction procedure. The color values of FP and OP were darker, less red and yellower than SPI, however, the protein extract was darker, redder and yellower than the FP and SPI. Thus, protein content was higher in RE than the other treatment due to the further protein extraction (p<0.05), however, the moisture and fat contents (%) were not different from each other.
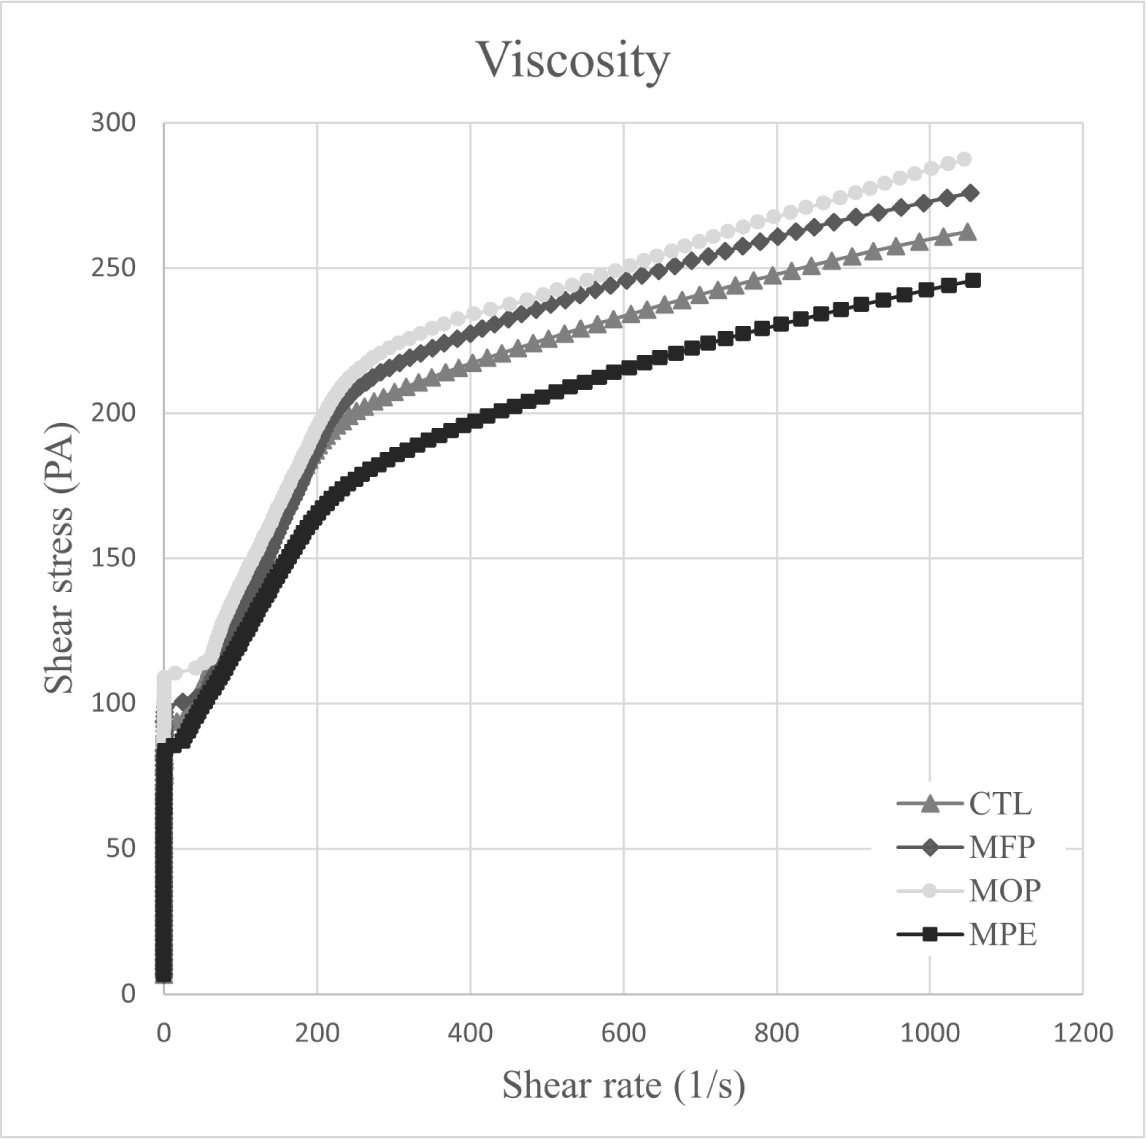
The viscosity of pork MP gel treated with RNPs [freeze-dried powder (FP) and oven-dried powder (OP)] and RN PE is shown in Fig. 3. MP treatment with RNPs and PE elicited higher viscosity than the control (CTL). PE addition to MP paste lowered the viscosity of PE-treated MP (MPE) owing to the PE’s lower pH value (4.73) compared with those of the RNPs (7.00 and 7.01 for FP and OP, respectively). According to Sun and Holley (2011), the factors affecting the viscosity of MP gel included myosin, actin, muscle type, protein concentration, pH, ionic strength, and temperature. Most proteins aggregate at pH values near the isoelectric point (pI), where they exhibit the least solubility, and electrostatic attraction between molecules, thereby preventing protein gel formation (Wang et al., 1990). The pH value of the PE-treated MP gel was 6.56, which was lower than those of the other treatments (6.74–6.75). Based on the LFMS pH results, PE addition to pork MP caused the pH value to approach the pI, thus potentially decreasing viscosity.
The CY (%) and GS of RNPs- and PE-treated pork MP are shown in Table 2. The CYs of FP-treated MP (MFP, 94.2%) and MPE (95.1%) were higher than that of CTL (90.6%; p<0.05); nevertheless, no differences in CY were observed between OP-treated MP (MOP) and CTL (p>0.05). Sun et al. (2012) reported that the addition of peanut protein isolate (PPI) into chicken salt-soluble protein (SSP) increased the WHC, resulting in promoting the interaction of complex proteins of SSP and PPI, thereby improving the water retention capacity of the protein system gel. GS is used as an important indicator of the quality characteristics of processed meat products in relation to texture. The GS of CTL was comparable to those of MFP and MOP (p>0.05), but higher than that of MPE (p<0.05). Based on the pH values of the various powders (Table 3), the pH value of SPE was lower than those of other treatments (p<0.05). The lower pH of the MPE powder might influence the MP gel, bringing it to the soft texture of MP, which likely inhibited gel formation and consequently reduced GS (Sun and Holley, 2011). This was different from the previous result that addition of chickpea protein isolate (CPI) into MP increased GS (Li et al., 2021). During cooking, water loss from CTL was higher than that from the other treatments, resulting in harder texture of the CTL.
| Treatment1) | ||||
|---|---|---|---|---|
| CTL | MFP | MOP | MPE | |
| Cooking yield (%) | 90.6±2.60b | 94.2±2.24a | 93.4±2.22ab | 95.1±1.33a |
| GS (gf) | 266.8±25.3a | 239.8±36.8ab | 224.0±28.4ab | 208.9±22.9b |
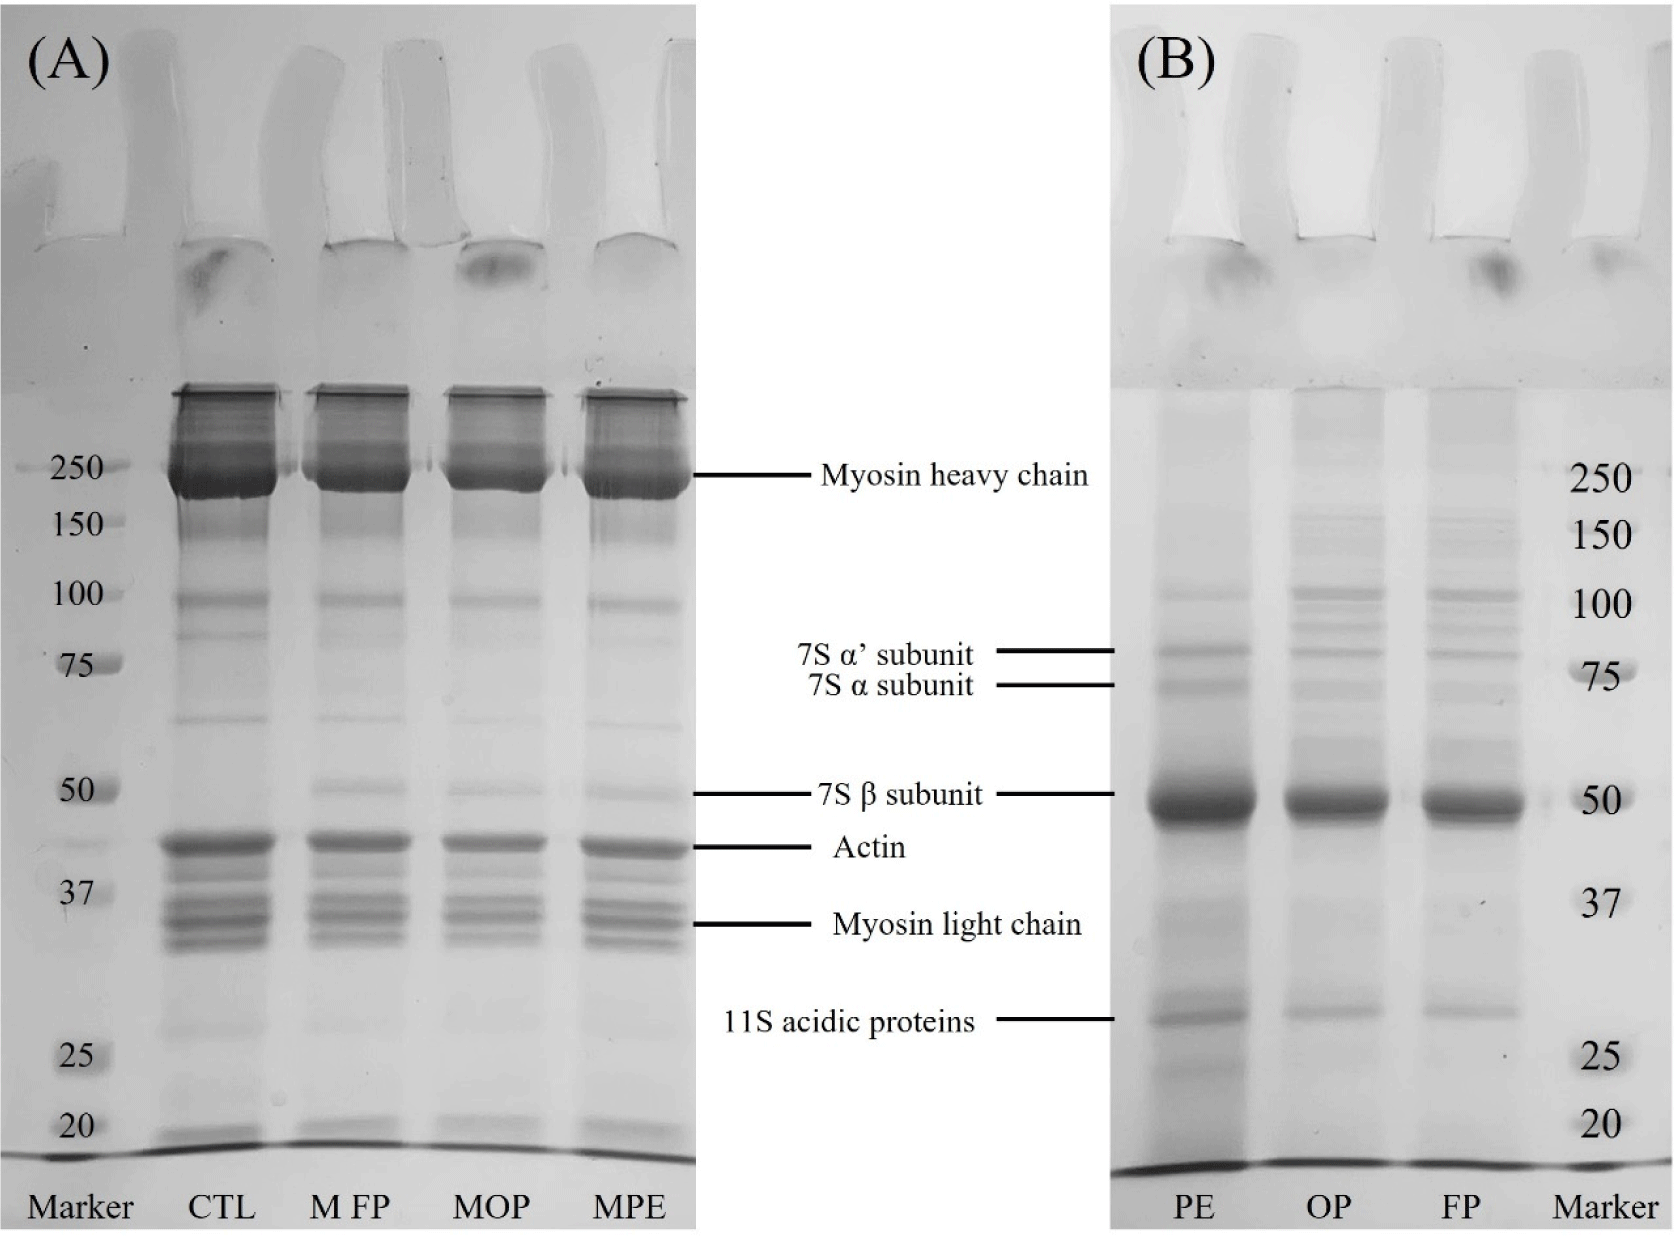
Fig. 4 shows the SDS–PAGE patterns generated by pork MP treated with or without RNPs and PE (A) and water extraction from RNPs and PE (B). SDS–PAGE analysis of MP revealed myosin heavy chains and actin with molecular weights (MWs) of approximately 250 kDa and 37–50 kDa across all treatments, respectively. In contrast, in all treatments, except CTL, protein fractions with a MW of approximately 50 kDa were identified, as shown in Fig. 4B. This protein fraction represents 7S β-conglycinin, which is one of the various subunits of 7S globulin contained in legume proteins (Keum et al., 2006), and its MW was reported to be approximately 53 kDa. When legume proteins such as kidney beans were treated to MP, electrophoretic changes were observed that indicated globulin fraction (Wu et al., 2016). Otherwise, no differences in protein fractions between CTL and treatment groups were noted.
Low-vacuum scanning electron microscopy (LV–SEM) was performed to confirm the 3D structural changes of cooked MP, depending on the non-meat protein content (%), and the LV–SEM results for MP gel containing RNPs and PE are shown in Figs. 5A, B, C, and D. MP treatment with RNPs obtained via different drying methods (FP and OP) resulted in greater protein aggregation than CTL, resulting in a swollen MP structure resembling a cloud-like formation. Additional protein contributed by the RNPs is considered to partially fill with the pores in the protein matrix, thus forming a dense structure, as shown in Fig. 5. Although the protein content (%) of PE (approximately 64.6%) exceeded that of RNPs (approximately 38.1%), MPE exhibited a similar 3D structure to the CTL. Kim and Chin (2024) reported that the addition of legume proteins to MP compressed the surface of the MP gel and reduced the porosity, and these results indicated that various legume proteins might have the potential to improve the functional properties of the gel matrix.
The pH and color values of RNP–PE-treated LFMS are shown in Table 4. pH was measured before and after cooking, and the resultant pH ranges were 6.01–6.09 and 6.21–6.31, respectively. pH values after cooking tended to be higher than those before cooking, as supported by Shin et al. (2017), who reported a higher pH after cooking than that before owing to increased pH elicited by the thermal denaturation of proteins. In addition, Lee et al. (2008) reported that the attenuation of hydrogen bonds by the thermal denaturation of proteins caused numerous positive ions to leak from amino acid residues, resulting in increased pH value. PE-treated LFMS (SPE) exhibited the lowest pH values before (6.01) and after (6.21) cooking (p<0.05). The pH values of FP-treated LFMS (SFP) and OP-treated LFMS (SOP) before cooking were lower than those of CTL (p<0.05), but similar to those of the reference group (REF, 1% SPI; p>0.05). The post-cooking pH values of SFP and SOP did not differ across all treatments, except SPE (p>0.05). The pH values of FP and OP were 7.01 and 7.02, respectively, which exceeded that of PE (4.74; Table 4), and it was presumed that they affected the pH values of SFP, SOP, and SPE. Choi and Chin (2002) showed that the pH of the final product added with SPI tended to increase and attributed this increase to the high pH of SPI (Chin et al., 1999).
Regarding color values, SPE yielded the lowest CIE L* value (p<0.05); however, no differences in these color values were observed among the other treatments (p>0.05). CTL generated the highest CIE a* value (9.20), and among the other treatments, this value decreased in the following order: REF>SPE>SOP>SFP. In addition, contrary to the CIE a* value, CTL yielded the lowest CIE b* value and SPE was the highest among the RNP-containing treatments (p<0.05). This partially emanated from the fact that the colors of the SPI and PE affected the sausage products themselves. The colors of non-meat ingredients (e.g. non-meat proteins) added can affect the meat products (Wang et al., 2023). Since the added PE possessed a darker brown color than the SPI, the CIE b* values of SPE exceeded that of REF. In contrast, both FP and OP are bluish, light-green powders with added black seed coats. In particular, the CIE a* values of FP and OP were –2.45 and –2.52, respectively (Table 4). RNP addition to LFMS (SFP and SOP) affected their CIE a* values. The seeds of black soybeans, such as RN, did not differ in nutritional content compared to yellowish soybeans, but they were characterized by the presence of anthocyanin pigments in the seed coat (Kim and Lee, 2007). According to the study by br Sembring and Chin (2021), sausages containing eggplant powder with anthocyanin showed a decrease in CIE a* value and an increase in CIE b* value. This might be due to the oxidation of anthocyanin during the drying process, leading to browning of the material and a subsequent reduction in CIE a* (Zia and Alibas, 2021). It was reported that the CIE L* and CIE a* values of sausages “Merguez” treated with CPI decreased, which might be the result of CPI swelling upon contact with water and reducing light scattering (Ghribi et al., 2018). As color values of the products are an important factor when consumers select meat products, compensating for decreases in the CIE L* and CIE a* values and increases in the CIE b* value owing to PE addition is imperative.
The proximate analysis results of LFMS treated with RNPs and PE are shown in Table 4. The fat contents of REF and SOP exceeded those of CTL (p<0.05); nonetheless, those of SFP and SPE did not differ from those of CTL (p>0.05). CTL exhibited the lowest protein content (%), whereas SPI-treated sausages yielded the highest protein content (p<0.05). The protein contents of SFP, SOP, and SPE exhibited no differences (p>0.05) and were higher than those of CTL (p<0.05). Several researchers have reported an increase in the protein content of final meat products when lentil pea (Serdaroğlu et al., 2005), pea flour (Pietrasik and Janz, 2010), and SPI (Moirangthem et al., 2022) were added to low-fat meat products. In particular, in the case of SPI, its high protein content contributed to the increased protein content of the final meat product. Akesowan (2010) reported an increase in protein content (%) of light pork burgers treated with SPI, and Cengiz and Gokoglu (2007) showed an increase in protein content when soy protein concentrate was added to formulations with 5% and 20% fat.
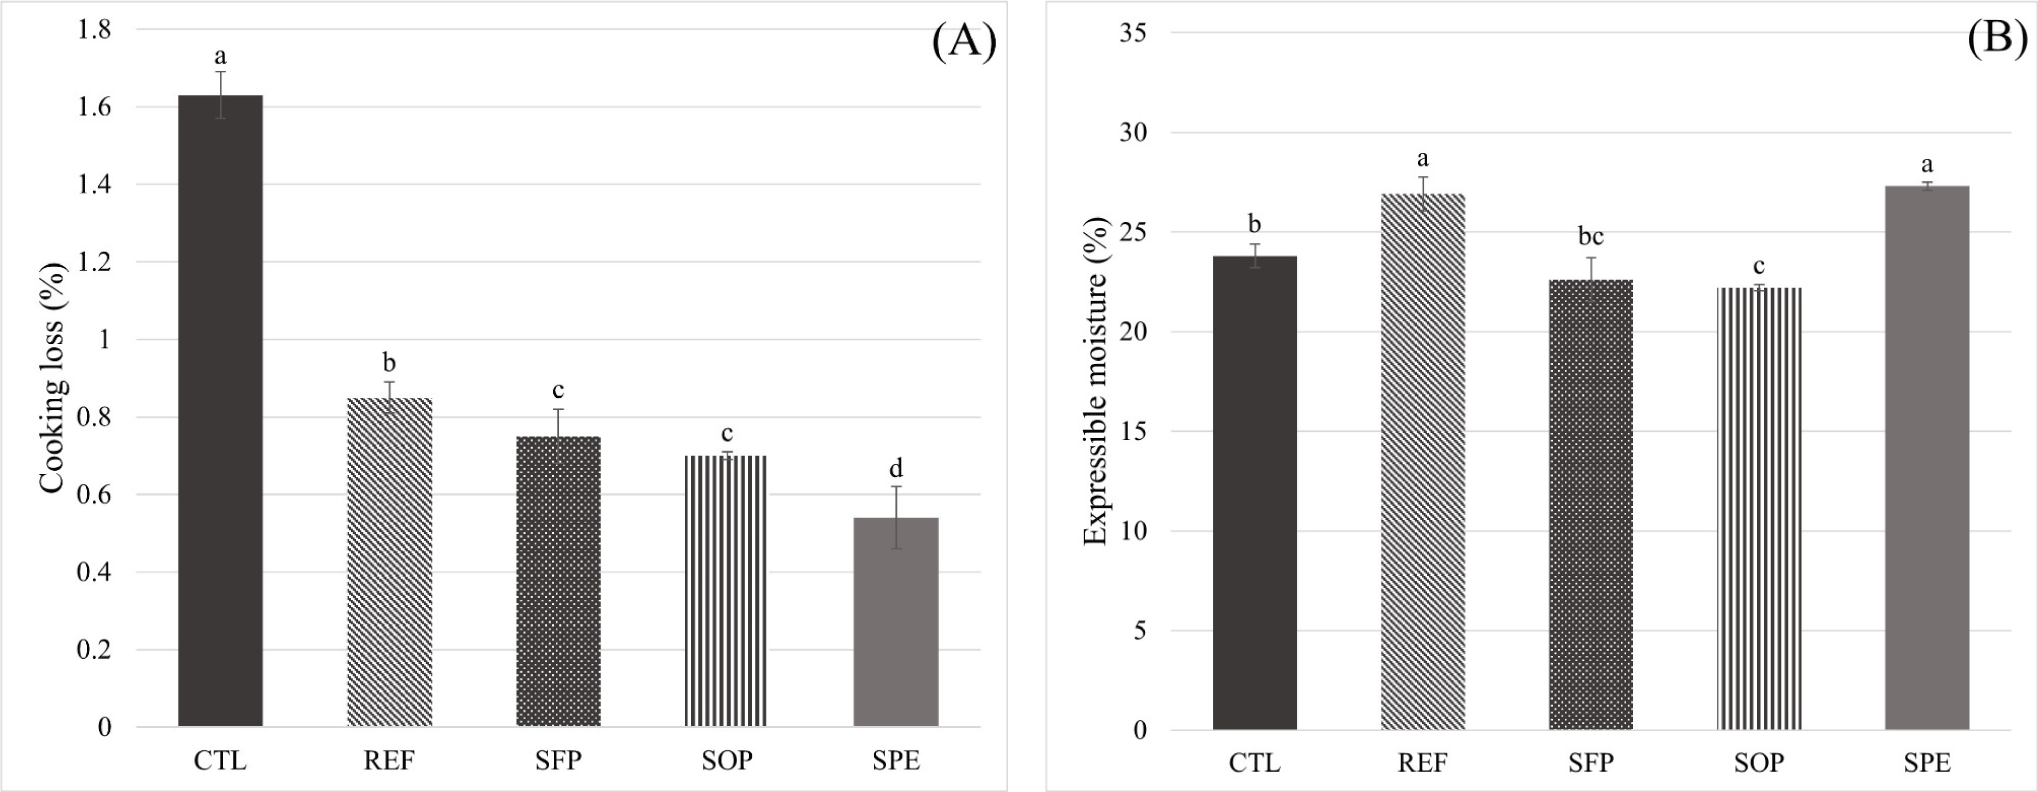
The CL (%) and EM (%) results of RNP–PE-treated LFMS are shown in Fig. 6. CL is used as a measure of the degree of water loss caused by cooking meat, and the freshness, pH, final cooking temperature, cooking speed and time, and size and shape of raw meat are known to generally affect CL in meat (Park et al., 2010). In addition, CL occurs as moisture is released via protein denaturation and has become a means of measuring WHC (Park and Kim, 2016). The CL value (%) of CTL was the highest; nonetheless, those of the treatments decreased in the following order: SFP (0.75%), SOP (0.70%), and SPE (0.54%). Ghribi et al. (2018) reported that chickpea protein addition (up to 2.5%) to “Merguez” sausages resulted in the chickpea protein absorbing water and forming a gel matrix upon cooking, thus decreasing CL. Consequently, more moisture content (%) was apparently absorbed owing to a higher protein content than that of the RNPs in LFMS. The EM (%) of REF (26.9%) and SPE (27.3%) exceeded those of CTL (p<0.05), whereas no differences in EM (%) were observed between REF and SPE, and SOP yielded a lower EM (%) value than CTL (p<0.05).
Texture is an essential sensory factor that considerably affects the taste and quality of sausages (Shin and Choi, 2021). Texture profile analyses were evaluated in terms of hardness (gf), springiness (mm), gumminess, chewiness, and cohesiveness, and their results are shown in Table 5. Among the textural parameters, hardness significantly varied across treatments (p<0.05). For example, the hardness values of SFP and SPE were lower than those of CTL (p<0.05). A previous study reported the addition of CPI decreased textural properties (Kandil et al., 2020). The legume proteins CPI and RNP, when added to sausages, bind and retain more water to produce a tender product, thereby influencing CL and gelation to have a softer texture than those of CTL. As a result, the textural hardness of CTL was higher than that of SFP and SPE (p<0.05). The hardness values of REF were similar to those of CTL, and this result was supported by Ahmad et al. (2010), who reported that the addition of SPI to buffalo meat emulsion sausages reduced hardness values. Furthermore, since the hardness increased with the reduced fat when the same level of water was added (Claus et al., 1990; Yoo et al., 2007), it is believed that the water content (%) released from CTL was higher CL compared to that of REF that affected textural properties. In contrast, RNP and PE addition to LFMS yielded a hardness value similar to those of REF (SPI; p>0.05). Overall, treatments with RNPs obtained by different drying methods and PE addition are likely not to affect textural parameters, except hardness.
Conclusion
Protein extract from RNPs had higher protein content than RNPs obtained by different drying methods. Adding RNPs obtained by different drying methods to pork MP improved rheological properties such as viscosity and CY and showed changes in the microstructure and SDS–PAGE patterns. The hardness values of LFMS treated RNPs and RNP PE were similar to those of LFMS treated with SPI. In the application with model sausages, the addition of RNP, which was dried by various drying methods, to LFMS improved WHC, showing similar results to LFMS treated with SPI. This suggests that using RNP as a fat replacer in meat products can enhance textural and functional properties. Furthermore, the antioxidant capacity of RN could be utilized to improve the storage stability of meat products with higher fat content, through extending their shelf-life in a future study.


