Introduction
Lipid is one of the most essential component in milk, which provide physical, sensory, and nutritional characteristics to dairy products, and consist of 3%–5% (W/W) of milk (Bakry et al., 2021). Milk fat (MF) is the main component of milk lipid, and mainly comprises of triacylglycerides (TG), phospholipids, cholesterols, diacylglycerides (DG), monoglycerides (MGs), and free fatty acids. Due to the rich bioactive fatty acids, MF always play an important role in organisms, such as storing energy, forming cell membranes, and transmitting signals (Bang et al., 2017; Sioriki et al., 2016). MF also has anti-inflammatory properties against chronic diseases, such as obesity, cardiovascular diseases, cancer, and rheumatoid arthritis (Li, 2019; Lordan and Zabetakis, 2017).
In recent years, there are a number of studies on the differences between milk lipids of different species, which would be helpful for the further utilization and identification of dairy products. Now both cow milk and camel milk has been considered as potential functional foods for their plentiful fatty acids (Wang et al., 2022). As we all know, cow milk has become a daily food for human, and more and more people became to accept camel milk due to its good healthcare benefits as the production of camel milk increased year by year. Cow lipid mainly exists in the form of TG, DG, MGs, cholesterols, free fatty acids and phospholipids, which account for 97.5%, 0.36%, 0.02%, 0.31%, 0.02%, and 0.6% of total fat, respectively (Robert, 2002). However, the average lipid content in camel milk is 32.8±14.0 g/L, in which TG was the main lipid (96.24%), and the other lipids are cholesterol ester (0.1%), free cholesterol (0.84%), free fatty acid (0.65%), DG (0.7%), and phospholipid (1.2%; Gorban and Izzeldin, 2001). In fact, camel milk produced at different lactation stages have been reported with different lipid compositions (Xiao, 2022). Furthermore, camel milk contains lower saturated fatty acids, higher unsaturated fatty acids (Maqsood et al., 2019), and higher polyunsaturated fatty acids (He et al., 2024) when compared with cow milk. Recent studies also shows that camel milk contains higher content of monounsaturated fatty acids than other kinds of milk (Ibrahim et al., 2023), and high levels of odd- and branched-chain fatty acids, as well as low ratios of n-6 to n-3 polyunsaturated fatty acids (Wang et al., 2022).
Xinjiang province is one of main dairy source area in China with vast area, and camel milk yield has reached 14,000 tons per year by 2019. In Xinjiang, all camels are raised in the desert and can freely consume plants that growing on deserts feeding. Now, more and more camel milk has been consumed with the rapid increase in the scale of camel pastured. In our former study, Junggar Bactrian camel milk and cow milk from different part of the north part of Xinjiang province have been found to have different fat contents, and cow milk showed lower fat and total solid contents than camel milk (Miao et al., 2023). Lipid is the most variable component of milk, and can be affected by many reasons, such as geography, breeds, lactation period, and season. However, people know few about the lipid profile of Junggar Bactrian camel milk in Xinjiang province. Therefore, the purpose of this study is to explain the lipid profiles of Junggar Bactrian camel milk and cow milk from the north part of Xinjiang province, and reveal differences between them, so as to better distinguish these two kinds of milk.
In this study, a non-targeted lipidomics analysis platform based on ultra-performance liquid chromatography quadrupole time of flight (UPLC-Q-TOF) system has been used for lipid identification and data processing of camel milk and cow milk, and subsequently some statistical analysis methods including principal component analysis (PCA), partial least squares discriminant analysis (PLS-DA), orthogonal partial least squares discriminant analysis (OPLS-DA) and cluster analysis were used to select differential lipids between these two kinds of milk. These results would provide a comprehensive understanding of the lipid profiles of camel milk and cow milk from Xinjiang province of China. Our study shows the lipid profile of Junggar Bactrian camel milk and cow milk from the north part of Xinjiang province of China, as well as their differential lipids, which can provide foundation for the further utilization of lipids from camel milk, and provide a reference for the camel milk and dairy products adulteration.
Materials and Methods
All milk samples, contain 6 batches of Junggar Bactrian camel milk and 6 batches of Holstein cow milk, were collected from different areas of the north part of Xinjiang province, respectively, as listed in Table 1. Generally, camel always give birth every March and April, and entered mature lactation period from the 4th day to 320th day (Ming et al., 2023). During this period, camels lived in natural pasture, and freely consume plants in the pasture, such as camel thorn, and so on. All cow samples were collected from Holstein cows, which were fed with silage on farm.
Each batches of milk was collected as the mixture of milk from many camel or cow. These milk samples were collected in August of 2021, at which all Junggar Bactrian camels were with mature lactation period. Milk samples were kept in clean milk storage bags laid in a 4°C car-refrigerator on their return journey, and finally stored at –80°C until analysis.
Acetonitrile (Thermo Fisher Scientific, Waltham, MA, USA) and methanol (Thermo Fisher Scientific) of MS grade were used, while isopropanol (Thermo Fisher Scientific), formic acid (Sigma-Aldrich, Santa Clara, CA, USA), and ammonium formate (Sigma-Aldrich), methyl tert-butyl ether (Sigma-Aldrich) of chromatographic grade were all used.
All samples were processed according to the method of Xu et al. (2023). A milk sample of 30 mg was weighed precisely and transferred into a 2 mL centrifuge tube with appropriate magnetic beads, and 200 μL water pre-cooled at 4°C in advance was added before they were flash freezed in liquid nitrogen for 5 s. And then a Fast Prep-24 homogenizer (MP, Santa Ana, CA, USA) was used for 60 s at the rapid of 60 m/s, and this operation was repeated for three times. After that, 240 μL pre-cooled methanol was added and well-mixed in a Vortex mixer, and 800 μL methyl tert-butyl ether was added subsequently before they were well-mixed in a Vortex meter and further processed in an ultrasonic extractor at 4°C for 20 min. And 30 min later, the mixture was centrifuged at 14,000×g for 15 min at 10°C in a low-temperature high-speed centrifuge. At last, the supernatant fluid was moved from the tube before dried with nitrogen and store at –80°C.
Each batches of camel milk and cow milk samples were extracted separately, and 3 batches of QC samples were prepared with equal amounts of all fourteen batches of milk samples at the same time for the evaluation of the analytical method.
The UPLC Nexera LC-30A system (Shimadzu, Kyoto, Japan) together with an ACQUITY UPLC CSH C18 column (1.7 μm, 2.1 mm×100 mm, Waters, Milford, MA, USA) was employed for the separation of milk lipids. The column temperature was 45°C with a flow rate of 300 μL/min and the injection volume of sample of 2 μL. The mobile phase consisted of A and B, while mobile phase A was 60% acetonitrile aqueous solution (V/V) containing 10 mM ammonium formate, and mobile phase B was 10% acetonitrile-isopropanol solution (V/V) containing 10 mM ammonium formate. The mobile phase was carried with the elution gradient as follows: 70% A and 30% B (0–2 min), 70%–0% A and 30%–100% B (2–25 min), while 70% A and 30% B (25–35 min). During the whole analysis, samples were stored in a 10°C automatic injector and were injected according to a random sequence.
Mass data were recorded immediately by a Q Exactive Plus mass spectrometer (Thermo Fisher Scientific) with both positive and negative ion modes of the electrospray ionization. Heater temperature was set at 300°C, flow rate of sheath gas was 45 ARB, auxiliary gas was 15 ARB, sweep gas was 1 ARB, and capillary temperature was 350°C. For the positive mode, spraying voltage was 3.0 kV, S-lens RF level was 50%, and MS1 scan range was from 200 to 1,800 m/z, while for the negative detection, spraying voltage was 2.5 kV, S-lens RF level was 60%, and Mass1 scan range was from 250 to 1,800 m/z. Ten Mass2 scan were execute for each Mass1 scan, and survey scans were acquired at a resolution of 70,000 at 200 m/z for Mass1 scan, while the resolution of the HCD spectra was set to 17,500 at 200 m/z for Mass2 scan.
Lipid Search TM software was used for the process of Mass data, which has been used as an automated lipidomics analysis software from Thermo Fisher Scientific, and recorded primary and secondary information databases of more than 1,500,000 kinds of lipids, including peak recognition, peak extraction, and searched against the software database for lipid identification. The precursor tolerance was 5 mg/kg, and product tolerance was 5 mg/kg, while product ion threshold was 5%. In order to accurately excavate the potential information in the date, univariate analysis and multivariate statistical analysis were applied using Metaboanalyst online software (https://www.metaboanalyst.ca/Metabo-Analyst/home.xhtml, updated on 1/18/2024). Furthermore, univariate statistical analysis was used to distinguish differential lipids between camel milk and cow milk, which mainly includes student’s t-test/nonparametric test and fold change analysis, and multivariate statistical analysis includes PCA, PLS-DA and OPLS-DA.
Differential lipids between camel milk and cow milk were preliminary screened out by combining p-value and variable importance in projection (VIP) value of OPLS-DA, and hierarchical cluster analysis of differential lipids was performed. The experiment of this study was mainly conducted by Applied Protein Technology (Shanghai, China).
Results and Discussion
The TIC spectrograms of three QC samples are compared, and the result shows that the chromatographic peak response intensity and retention time of each QC sample overlapped well both in positive and negative ion modes (Supplementary Fig. S1). Further analysis also shows that correlation coefficients of three batches of QC samples are all more than 0.999 (Supplementary Fig. S2), and three QC samples are closely clustered in PCA (Supplementary Fig. S3). Meanwhile, QC samples, camel milk samples, and cow milk samples all are analyzed by Hotelling T2 test, and confidence interval of three QC samples are within 99% (Supplementary Fig. S4). All these above results indicate that the analytical method used in this study is reliable, steady, defined, and repeatable.
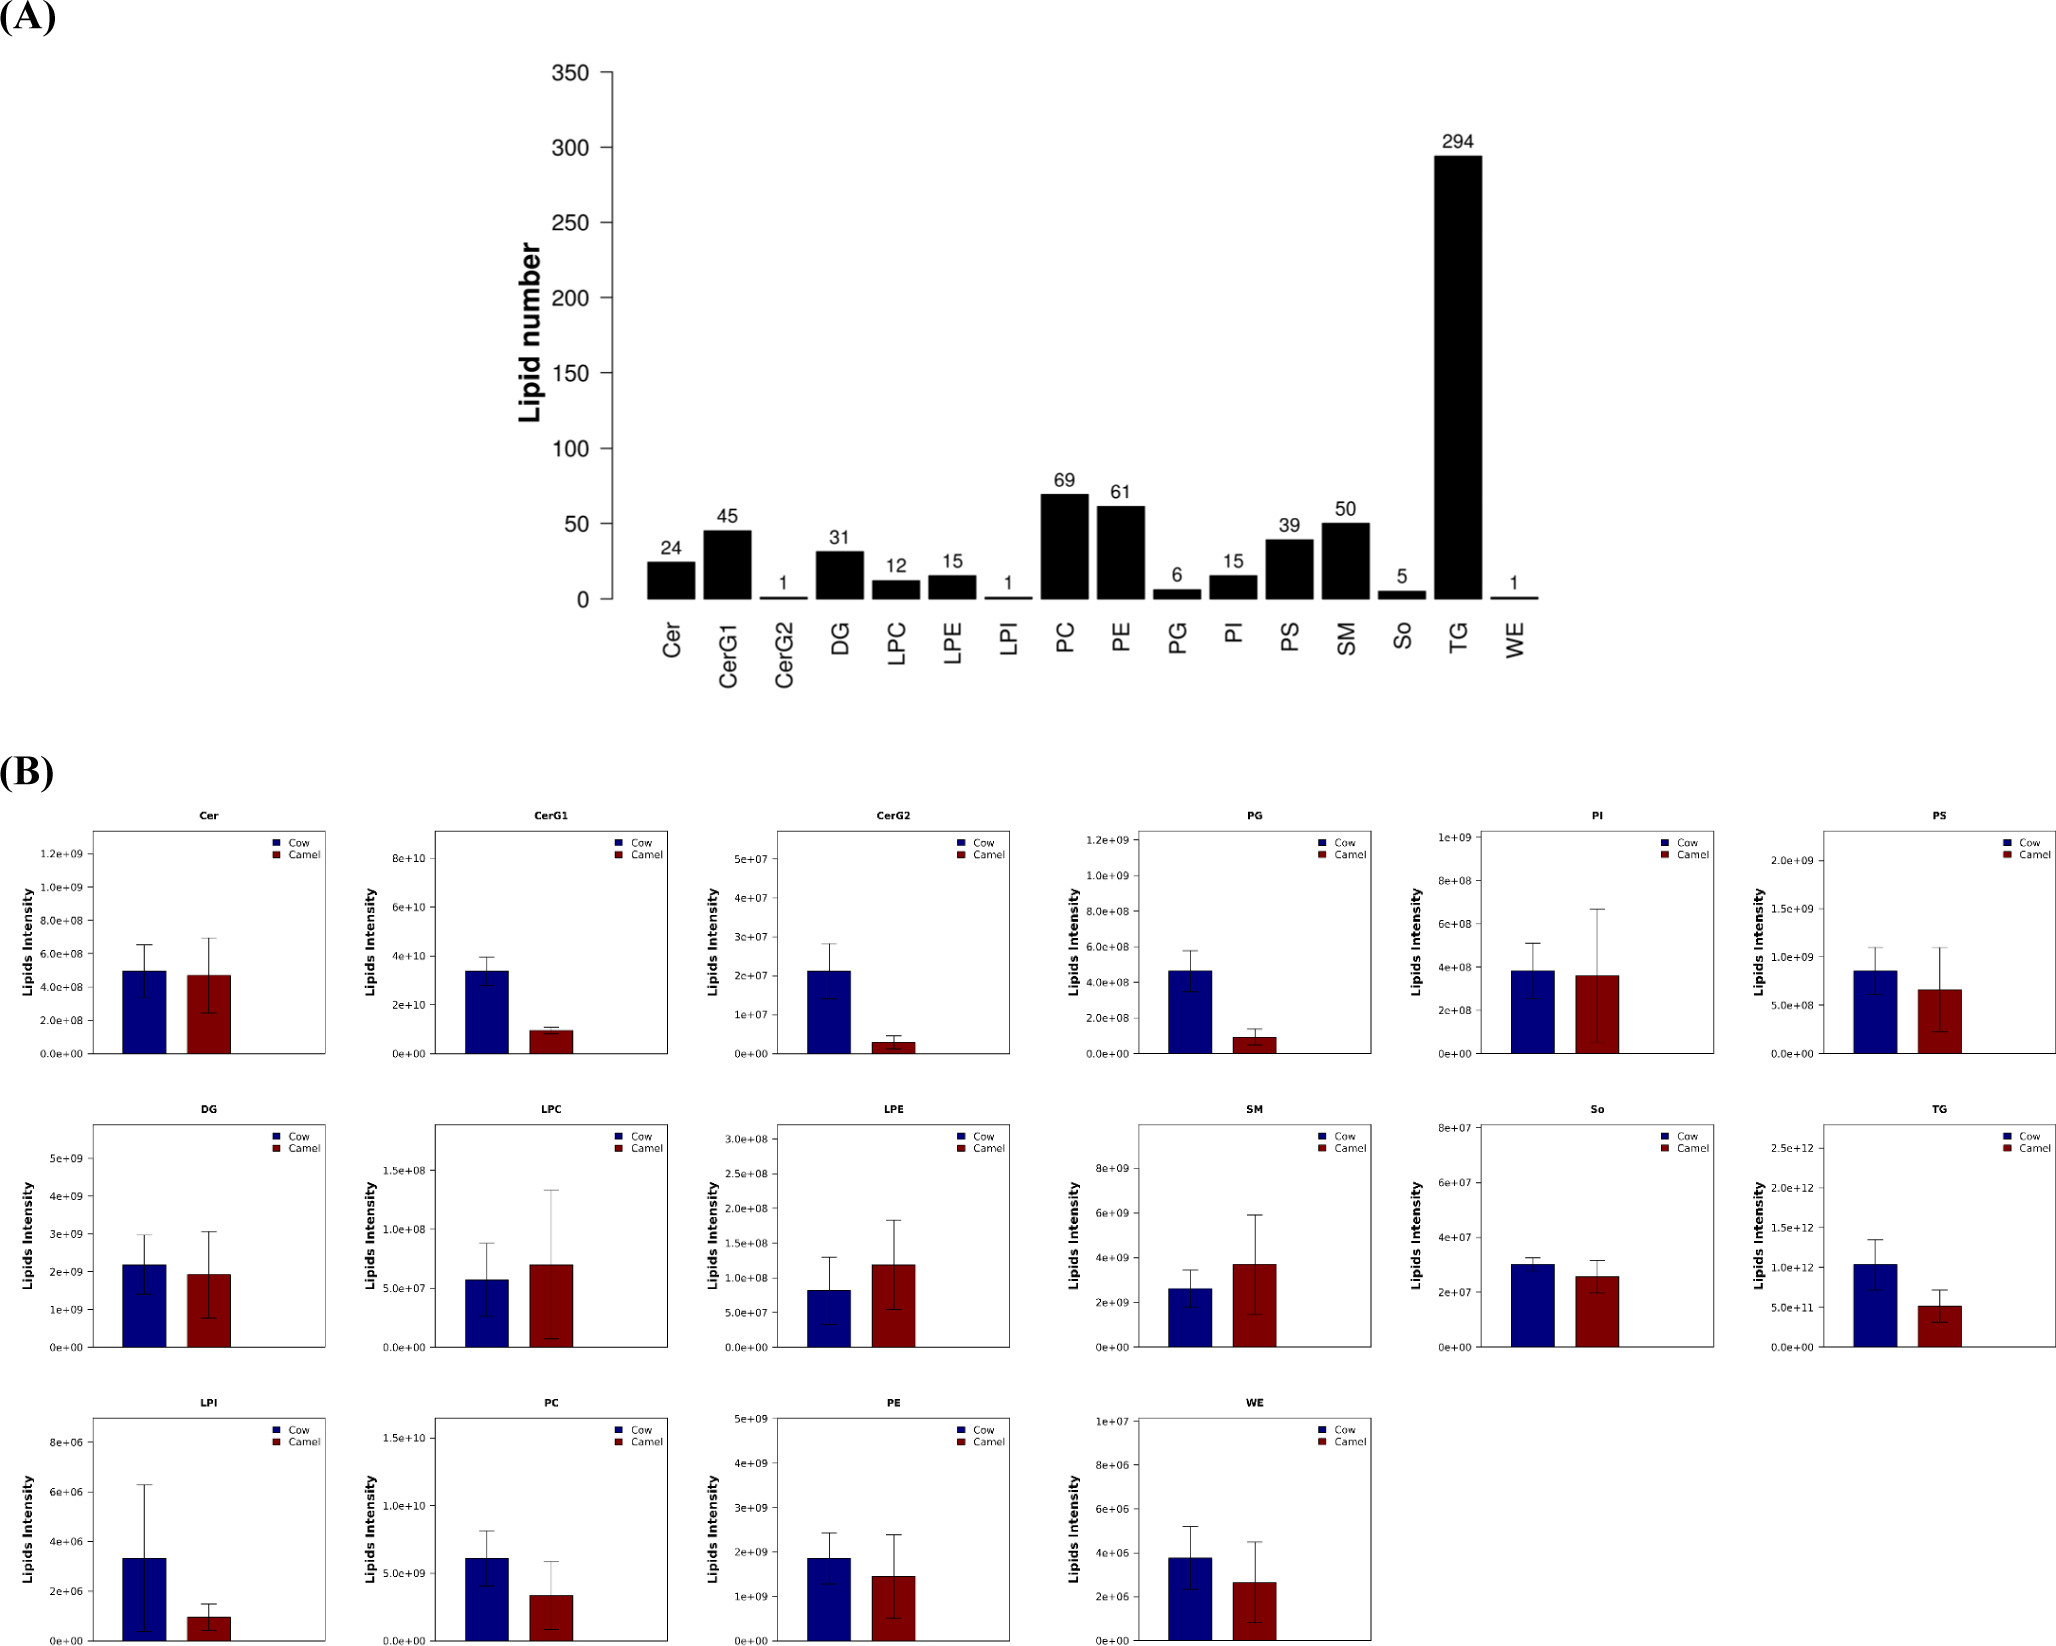
Information of lipids identified in camel milk and cow milk are showed in Fig. 1A and Supplementary Table S1. Totally, 669 kinds of lipids are identified in both camel milk and cow milk, and these lipids can be described as 16 lipid classes, include 24 kinds of ceramides (Cer), 45 kinds of glycosphingolipids (CerG1), 1 kind of diglucose ceramide (CerG2), 31 kinds of DG, 12 kinds of lysophosphatidylcholines (LPC), 15 kinds of lysophosphatidyl-ethanolamine (LPE), 1 kinds of lysophosphatidylinositol (LPI), 69 kinds of phosphatidylcholines (PC), 61 kinds of phosphatidylethanolamines (PE), 6 kinds of phosphatidylglycerols (PG), 15 kinds of phosphatidylinositol (PI), 39 kinds of phosphatidylserines (PS), 50 kinds of sphingomyelins (SM), 5 kinds of sphingosines (So), 294 kinds of TG, and 1 kind of wax ester (WE).

Contents of 16 classes of lipids identified from camel milk and cow milk varied at different extent as listed in Fig. 1B. All data are presented as mean±SD, and statistical and graphical evaluations are conducted by student’s t-test. Contents of CerG1, CerG2, TG, and PG in cow milk are significantly higher than that in camel milk, while numbers of other kinds of lipids in camel milk and cow milk do not show significant differences. When compared with other kinds of lipids, contents of TG identified from camel milk and cow milk is the highest. This result is same with other reports (Robert, 2002). In Alxa Bactrian camel milk, number of TG also is the highest, and followed by DG, PE and SM (Xiao, 2022), which is similar with our results. Moreover, content of TG in cow milk is higher than that in camel milk, and it means cow milk is more suitable for the production of infant formula milk powder than camel milk, because TG can well meet the energy requirements for the growth of infants and young children (Xiao, 2022).
Junggar Bactrian camel milk were analyzed in this study, and lipid in camel milk also can be affected by the different breeds of camel, as we all know. In Alxa Bactrian camel milk from different lactation periods, totally 980 kinds of lipids have been identified, and were divided into 24 classes (Xiao, 2022). Furthermore, 353 lipids were determined in MF globule membrane of Alxa Bactrian camel milk (He et al., 2024). However, although analytical method used in the present study is same with the literatures (He et al., 2024; Xiao, 2022), only 669 kinds of lipids have been detected in this study. Therefore, these great differences could be mainly ascribed to the differences of camel breed and living environment (Xiao, 2022).
Many kinds of fatty acid chains are included in lipids (Supplementary Table S1), and these fatty acids contain 4 to 44 carbons, and the highest number of double bonds is up to 6. Among the lipids detected (Fig. 2A), 299 kinds of fatty acids are identified, and type of occurrences of short-chain fatty acids is 63, while 21, 372 and 213 types of medium-chain fatty acids, long-chain fatty acids, and very-long chain fatty acids, respectively. C16:0, C18:0 and C15:0 occur most frequently, and then followed by unsaturated fatty acids C16:1 and C18:1. Saturated fatty acids, especially C12:0, C14:0 and C16:0, are associated with elevated cholesterol levels and increased risk of cardiovascular diseases (Sun et al., 2007). The unsaturation of unsaturated fatty acids is from 1 to 6 (Fig. 2B). The polyunsaturated fatty acids have positive impacts on cardiovascular diseases, platelet aggregation, cancer, and various immune diseases (Siscovick et al., 2017).

According to former reports, camel milk contains lower saturated and higher unsaturated fatty acids, which help to the higher antioxidant activity and angiotensin-1 converting enzyme inhibitory potential after simulated gastro-intestinal digestion when compared to cow milk (Maqsood et al., 2019). Especially, content of unsaturated fatty acids in camel is 37.29%, and 14 kinds of fatty acids have been determined from Alxa Bactrian camel milk, and the contents of oleic acid, stearic acid, and palmitic acid are 31.03%, 26.48% and 21.85%, respectively (Yun et al., 2013). Furthermore, palmitic acid also is considered as the feature fatty acid of camel milk (Wen, 2023). In the present study, oleic acid, stearic acid, and palmitic acid have been detected in cow milk and camel milk, and they exist in the form of TG, DG, LPC, LPE, LPI, PC, PE, PI, PS, Cer, and SM, as showed. Most of them exist in the form of TG.
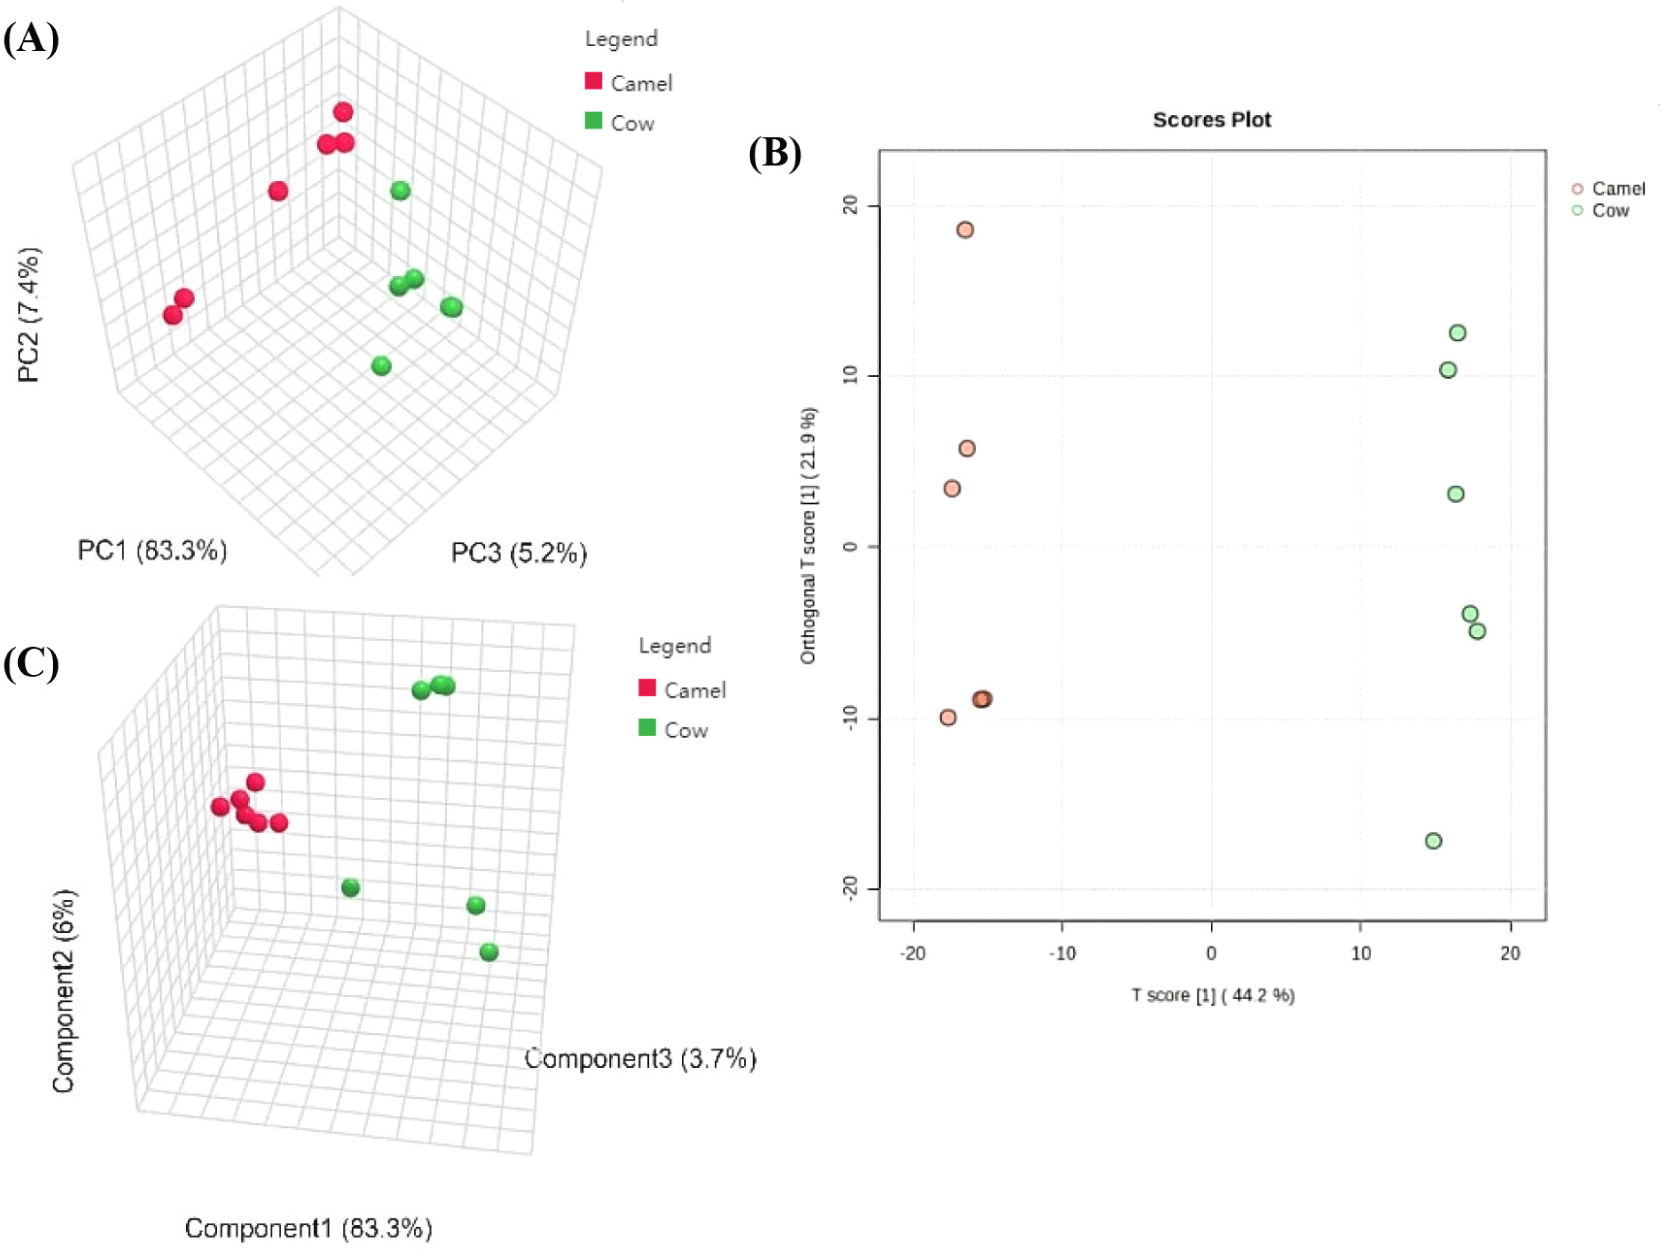
PCA is an unsupervised data analysis method, which can reflect the variability between and within groups. According to the result of PCA (Fig. 3A), 6 batches of cow milk and 6 batches of camel milk are distinguished clearly. As listed in the OPLS-DA score plot (Fig. 3B), the lipids of camel milk and cow milk are classified distinctly, and the parameter classifications are R2Y=0.997, and Q2=0.958, which demonstrated that the model of used was credible and not overfitted. When analyzed by PLS-DA, these two different milk samples also are separated completely (Fig. 3C), and the parameter classifications are R2Y=0.998, and Q2=0.941 after a 5-fold cross-validation, which indicated that the model used is proper. All these results tell that three statistical analysis method can distinguish camel milk from cow milk based on the lipids profiles, and lipids in camel milk are different from lipids in cow milk. In a former study, lipids in three kinds of milk samples have been distinguished using OPLS-DA model, and as a result human and cow milk can be distinguished correctly, while caprine and cow milk can not (Wang et al., 2020).

Differential lipids are selected by both univariate statistical analysis (Fold Change Analysis) and PLS-DA, and the standards of differential lipids are fold change >2 or fold change <0.5, p<0.05, and VIP>1. As the result, 70 kinds of lipids are selected as differential lipids, containing 1 Cer, 1 CerG1, 21 PCs, 10 PEs, 8 PIs, 8 PSs, 11 SMs, and 10 TGs, as listed in Table 2. These differential lipids are mainly composed with unsaturated long-chain fatty acids and very-long chain fatty acids. Fold change values of 8 TGs, 3 SMs and 1 PI are more than 1, and these 12 differential lipids are TG (16:0e/18:1/18:1), TG (20:0p/16:0/16:0), TG (16:0/14:0/22:6), TG (15:0/18:1/20:5), TG (15:0/18:1/20:5) isomers, TG (18:2/17:1/18:2), TG (18:0e/ 18:1/18:1), TG (18:0/16:0/22:6), SM (d43:4), SM (d44:4), SM (d22:1+hO/18:0), and PI (18:0/20:3) isomers. This result means that contents of these 12 lipids referred are higher in camel milk than that in cow milk.
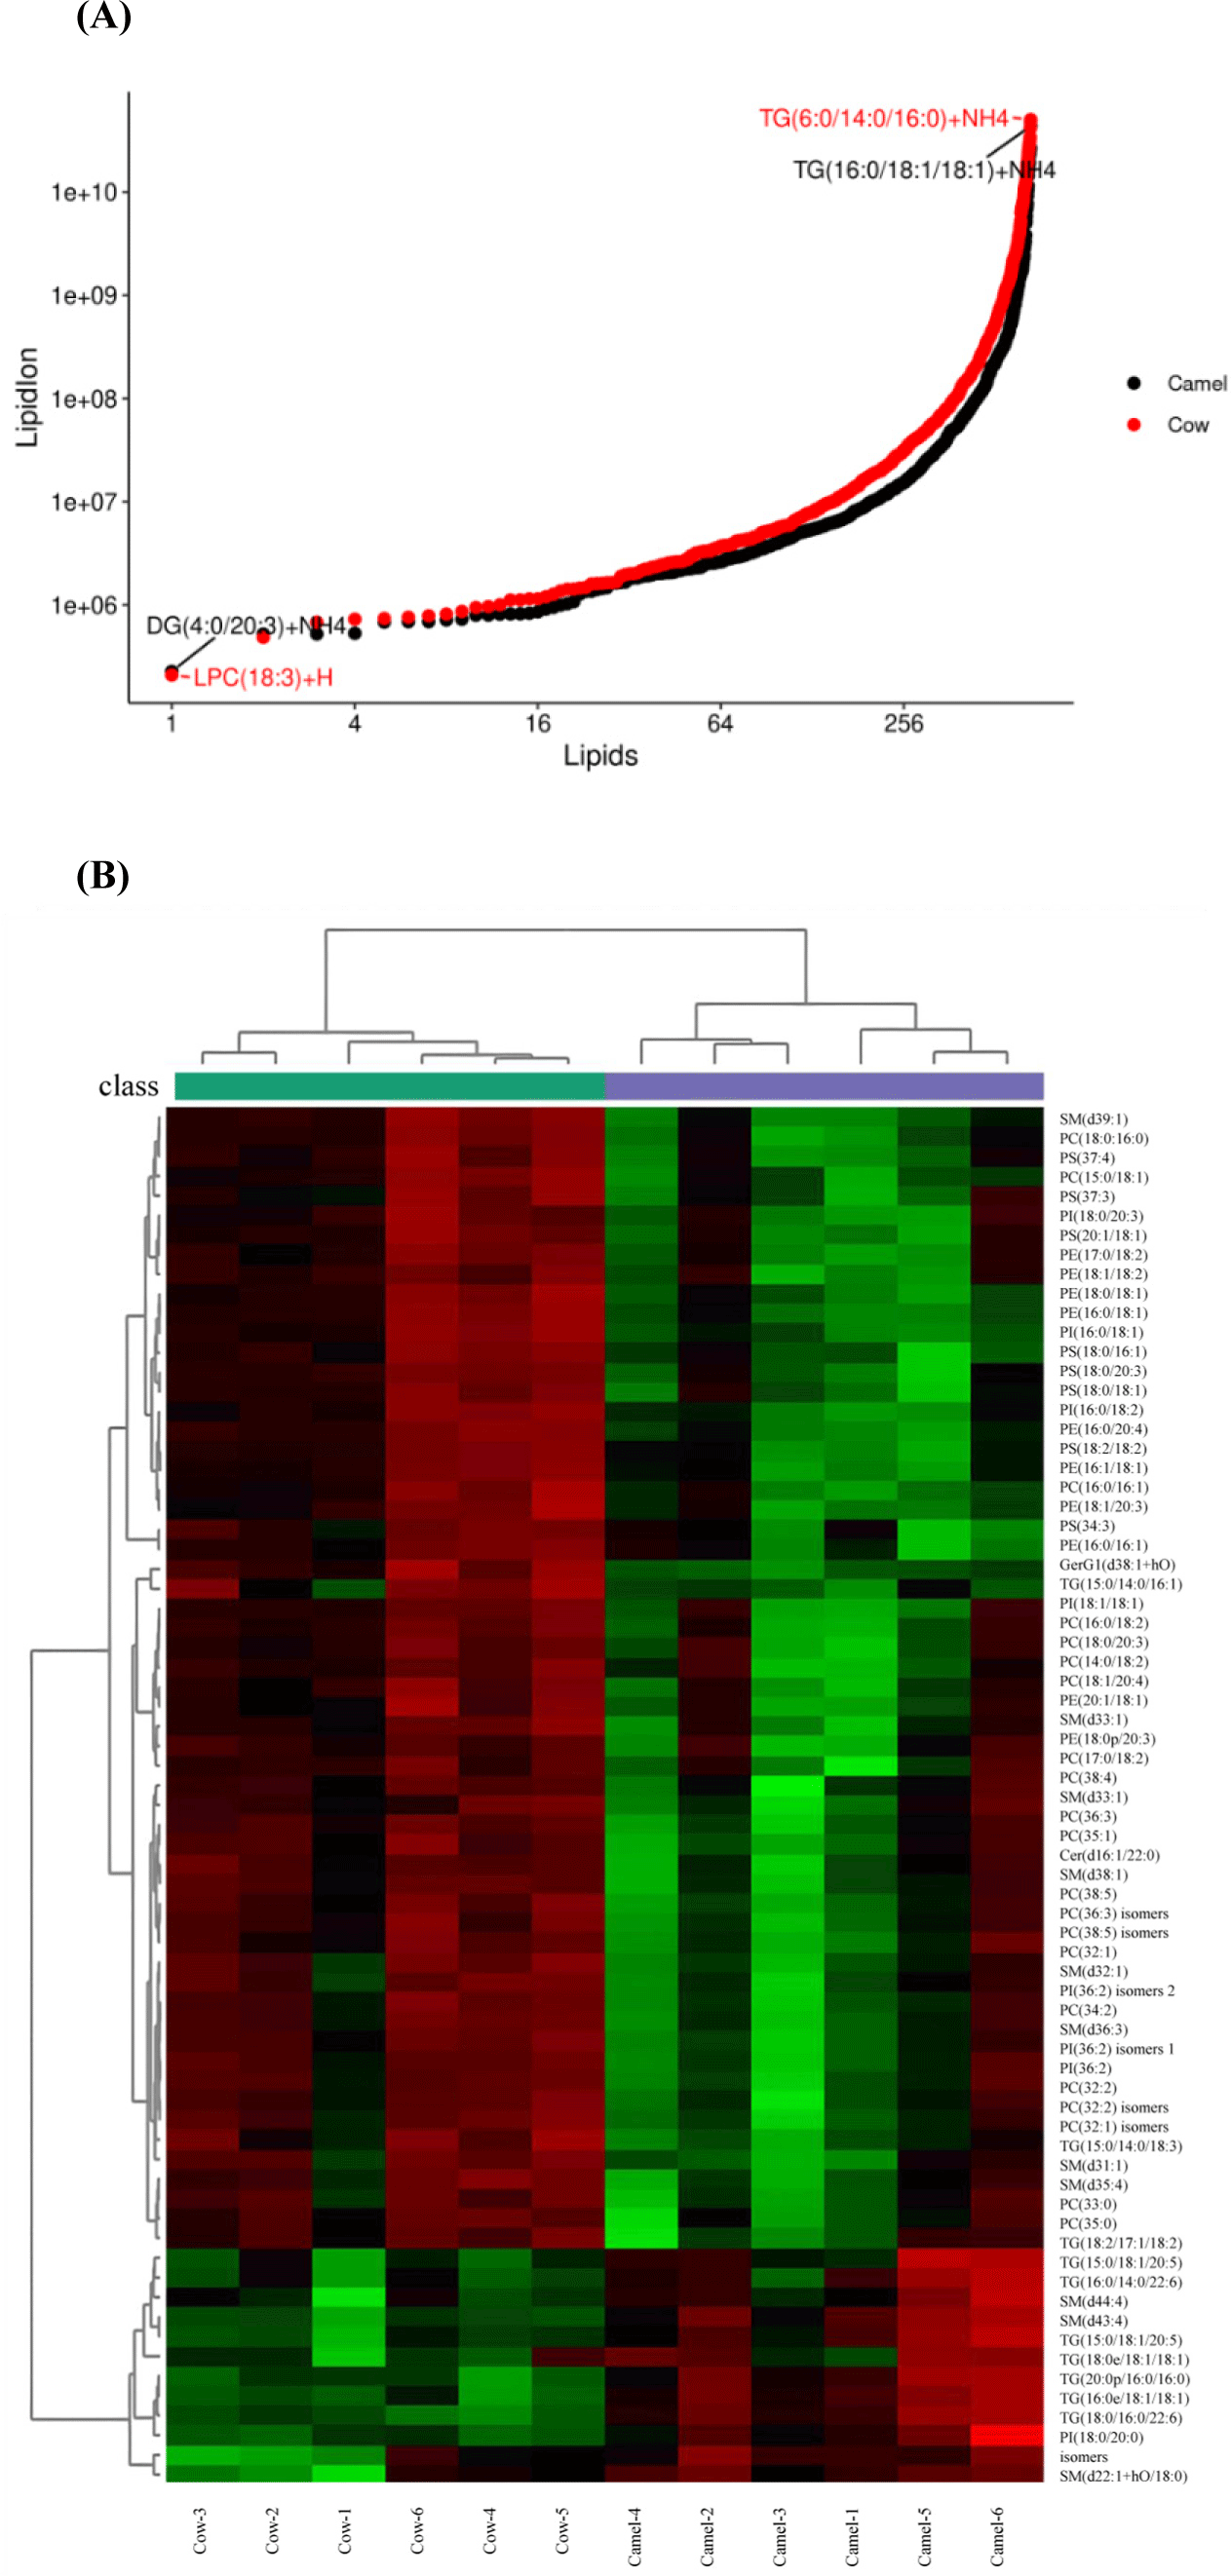
TG, which is composed of a glycerol main chain and three fatty acid chains, is an important part of lipid nucleus in MF globule and plays an important role in metabolism and energy stores (Pergande et al., 2019). Furthermore, number of TG identified from cow milk are more than two times higher than camel milk. Among all lipids identified (Fig. 4A), TG (16:0/18:1/18:1) shows the highest content in camel milk, which is same with the result of Xiao (2022), while TG (6:0/14:0/16:0) shows the highest content in cow milk.

SM, as a key lipid species in MF globule, is important for controlling intestinal microbial interactions and myelin production in the central nervous system (Norris et al., 2019). Camel milk contains more SM (d43:4), SM (d44:4) and SM (d22:1+hO/18:0) than cow milk, and this is not similar with the analysis with lipids in MF globule of camel milk (He et al., 2024). Thus, when compared with camel milk, higher content of SM (d43:4), SM (d44:4) and SM (d22:1+hO/18:0) would featured camel milk.
PI also is an bioactive lipid in milk, and may contribute to the anti-inflammatory and immunoenhancement activity of milk (Xiao, 2022). PI (18:0/20:3) isomers has been reported in Alxa Bactrian camel milk, and camel milk contains more PI (18:0/20:3) isomers than cow milk from Alxa, Inner Mongolia, China (He et al., 2024). This result is same with our study.
Therefore, determination of TG (16:0/18:1/18:1), TG (6:0/14:0/16:0), SM (d43:4), SM (d44:4), SM (d22:1+hO/18:0), and PI (18:0/20:3) isomers could be a potential method for the identification of dairy products adulteration. Now, the qualitative and quantitative analysis of lipid have not been finished completely, which would become useful used in the analysis of food composition and will contribute to the in-depth study of lipid function. It also offer some foundation for the process of camel milk, because during the heating process the oxidative hydrolysis of lipids is one of the important factors affecting the nutrition, quality, and safety of milk and milk products.
In order to visualize relationship of these different milk samples and the profile of differential lipids identified in different batches of milk samples, a heat map visualization and hierarchical analysis of the 70 lipids that differed significantly between camel and cow milk samples is shown in Fig. 4B. Notably, 6 batches of camel milk clustered into one group, and 6 batches of cow milk clustered into the other group.
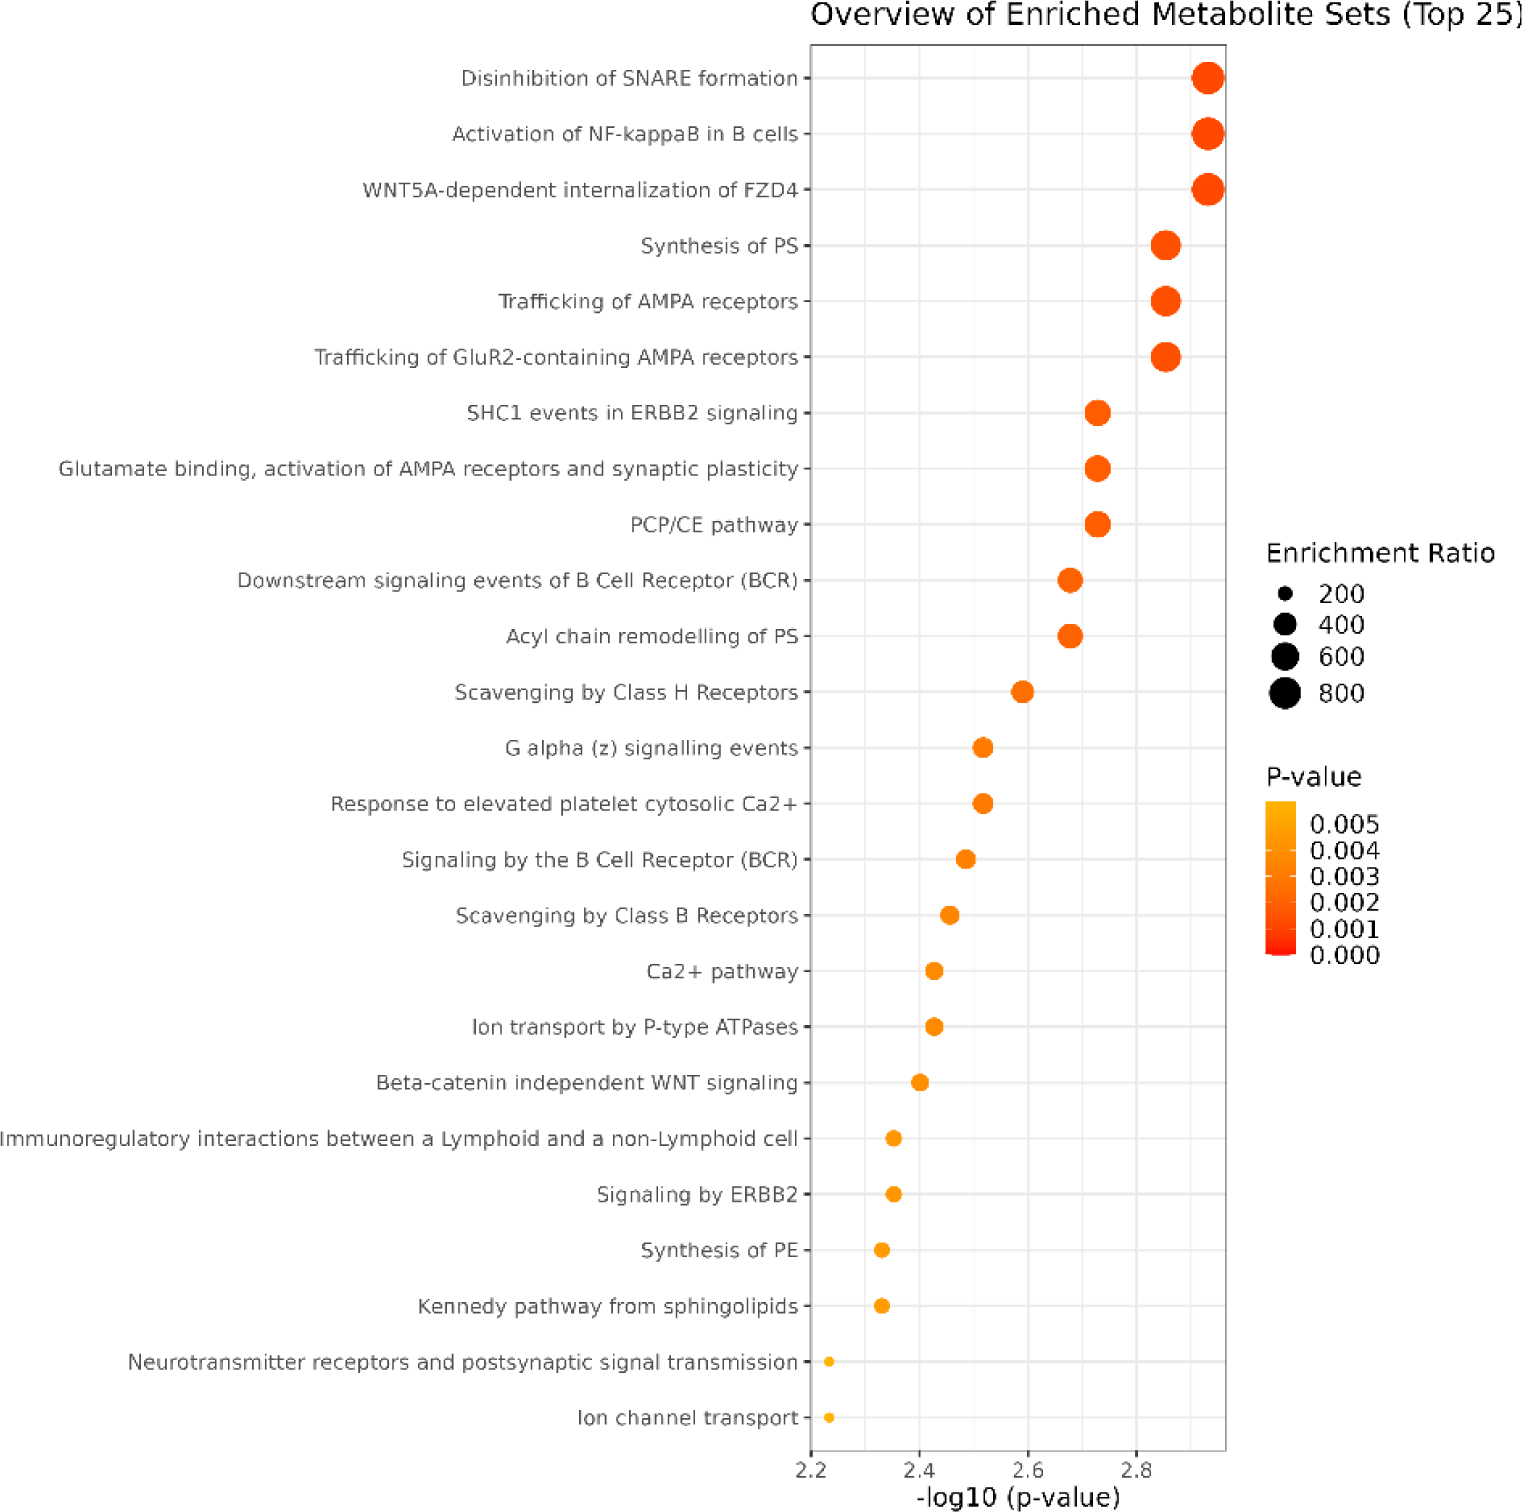
Camel, cow, and sheep all are ruminants, and they have different lipid synthesis pathway with non-ruminant animals, referred as acetate and β-hydroxybutyrate are the principal precursors of fat acid chains with C4–C16 in ruminant animals, while sugar in blood is the principal precursors of fat acids in non-ruminant animals (Bakry et al., 2021). All differential lipid metabolites in camel and cow milk were subjected to enrichment analysis in RaMP library, as showed in Fig. 5 and Supplementary Table S1.
These differential lipids were primarily found to be associated with synthesis of PS, acyl chain remodelling of PS, synthesis of PE, glycerolipids and glycerophospholipids, glycerophospholipid biosynthetic pathway, glycerophos pholipid biosynthesis, phospholipid metabolism, and metabolism of lipids. PC, PS, and PE are all involved in glycerophospholipid metabolism, with glycerophospholipids playing vital roles in cell metabolism, signal transduction, and membrane transport (Liu et al., 2023). According to the results of this study, there still are some differences on the synthesis of fat acids and lipids between camel and cow, especially about TG, PI and SM, and these differences should be analyzed by other omics methods, and no information is given when analyzed according to lipidomics data mainly due to the limitation of database.
Conclusion
In conclusion, the non-targeted lipid relative quantitative analysis of Holstein cow milk and Junggar Bactrian camel milk was carried out by UPLC-MS/MS technology, and 669 kinds of lipids are identified in total. In results of PCA, PLS-DA, and OPLS-DA. Six batches of camel milk and six batches of cow milk are separated well, and 70 kinds of differential lipids are selected out, containing 1 Cer, 1 CerG1, 21 PCs, 10 PEs, 8 PIs, 8 PSs, 11 SMs, and 10 TGs. In hierarchical cluster analysis, camel milk samples and cow milk samples also are clustered well. All these results illustrated that there are many different lipids, and camel milk contains more SM (d43:4), SM (d44:4), TG (20:0p/16:0/16:0), TG (16:0/14:0/22:6), TG (15:0/18:1/20:5), TG (15:0/18:1/20:5) isomers, TG (18:2/17:1/18:2), TG (18:0e/18:1/18:1), TG (18:0/16:0/22:6), SM (d22:1+hO/18:0), and PI (18:0/20:3) isomer than cow milk, which can be used as potential biomarker to distinguish camel milk from cow milk. Our study shows the lipid profile of camel milk and cow milk from Xinjiang province of China, as well as their differential lipids, which can provide foundation for the utilization of lipids from camel milk, and provide a potential reference for the camel milk and dairy products adulteration.


