


Introduction
Lipids are closely related to the physiological health of organisms. They are involved in biofilm formation, provide energy for life activities, and participate in key biological processes, such as material transportation, energy conversion, and information recognition and transmission (Han, 2016; Kouba and Mourot, 2011). Considering their complex structure, diverse physical and chemical properties, and underdevelopment of robust detection methods, systematic and holistic analysis of lipids is challenging; consequently, little is known regarding the relationship between phenotype and mechanism of action. Lipidomics, which was first presented in 2003, is a branch of metabonomics that mainly focuses on revealing lipid species, abundance, and spatial distribution; further, it facilitates analyses of the biological role of lipids in metabolic pathways and networks, serving as a powerful tool to comprehensively analyze lipids in vivo (Han and Gross, 2003). In the past decade, lipidomics has attracted extensive attention of biologists and analytical scientists and has witnessed rapid advancements due to the development of various new analytical instruments and bioinformatics. Lipids can be classified into 8 categories according to their structure, covering >45,000 lipid species (Fahy et al., 2005), with each category showing differences in polar head group, carbon chain length, and unsaturation. Mass spectrometry (MS)-based lipidomics has become an indispensable method because of its high flux, sensitivity, and accuracy, helping overcome the challenges associated with lipid complexity and diversity (Navas-Iglesias et al., 2009). Lipidomics has been successfully applied to assess food obtained from animals; for example, it has been used for the characterization and discrimination of domestic pig (Mi et al., 2019a) and Taihe black-boned silky fowl muscles (Mi et al., 2018). Further, Li et al. (2020b) used quantitative lipidomics to reveal alterations in donkey milk lipids during lactation, and Xie et al. (2020) used it for the efficient profiling of egg yolk lipids.
Herein we comprehensively review lipid classification and extraction from diverse samples, as well as lipid detection and analyses using lipidomics. The information reported in this review should serve as a reference for characterizing lipids found in food obtained from farm animals, shedding light on the application of lipidomics in the field in animal husbandry and helping us better recognize the quality of food.
Lipids
Lipids can be defined as hydrophobic or amphipathic small molecules. They are difficult to dissolve in water but are easily dissolvable in organic solvents, including chloroform, ether, and alcohol. Lipids are important components of various metabolites and have unique biological functions, particularly in maintaining physiological dynamic balance (Han, 2016). In humans, the abnormal metabolism of lipids is closely related to the occurrence and development of several diseases, such as diabetes, cancer, and Alzheimer’s disease (Wang et al., 2005; Yi et al., 2020). Moreover, lipids are associated with an improvement in food sensory parameters and absorption of fat-soluble vitamins (Cui et al., 2019).
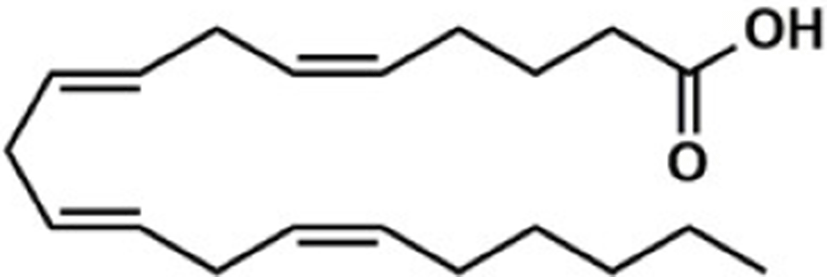
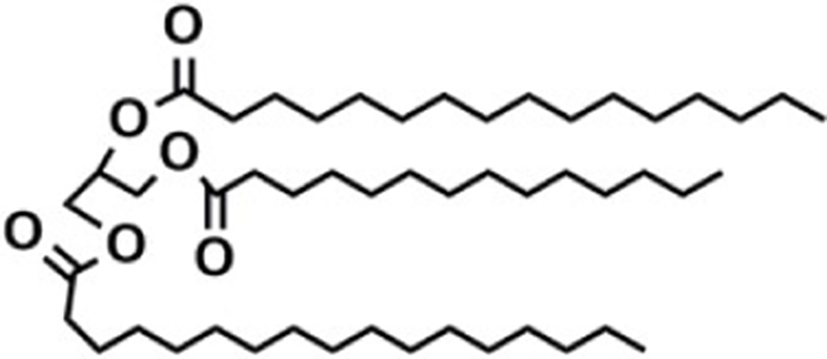
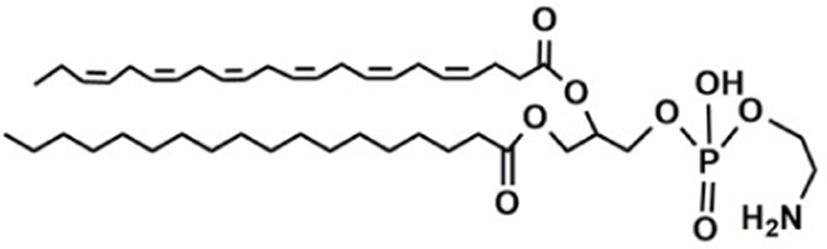
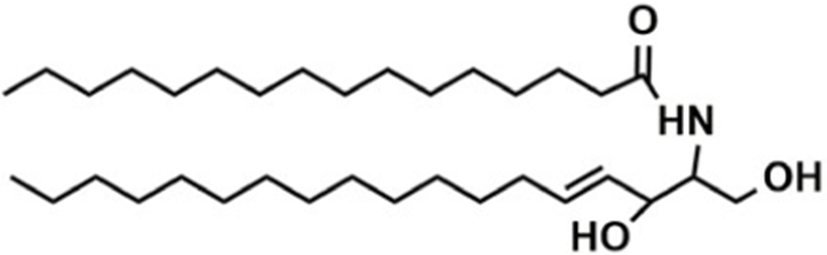
Based on the classification system proposed by the Lipid Metabolites and Pathways Strategy (LIPID MAPS) project, lipids can be divided into 8 classes (Table 1). Glycerolipids (GL) are generally composed of a glycerol skeleton and fatty acids, and they are mainly classified into monoglycerides, diacylglycerides (DG), and triacylglycerides (TG). TG, with three fatty acids at different positions, such as sn-1, -2, and -3, are the most important and abundant. Glycerophospholipids (GP) widely exist in animal and plant cells, serving as essential structural and functional component of biofilms. They chiefly include phosphatidylcholine (PC), phosphatidylethanolamine (PE), phosphatidylglycerol (PG), phosphatidylinositol (PI), phosphatidylserine (PS), and sphingomyelin (SM). In GP, the number of carbons in side-chain fatty acids is between 14 and 24, with each chain having 0–6 double bonds (Li et al., 2018). Sphingolipids (SP), a type of amphoteric lipid with a sphingosine skeleton, are the predominant lipids in biofilms. They represent bioactive lipids that play a critical role in cell signal transduction (Alewijnse and Peters, 2008). SP principally include SM, ceramides (Cer), glucosylceramides (GluCer), and gangliosides (GLS); they have attracted much attention considering their anti-inflammatory properties and role in colon cancer prevention (Canela et al., 2016; Sugawara et al., 2019).
The number in the LIPID MAPS database (Lipid structure, annotation, classification and pathways, analytical methods. http://www.lipidmaps.org.CC-BY).
Lipids have complex and diverse structures, and they have many biological and nutritional functions in various tissues and cells. For example, lipids supply energy for life activities; phospholipids (PL), an important component of cell membrane structure, are involved in maintaining cell integrity. Moreover, lipids are a source of essential fatty acids and promote the absorption of fat-soluble substances; they also participate in key biological processes, such as material transportation as well as information recognition and transmission. PG evidently has potential therapeutic effects; for example, it has been reported to suppress influenza A virus infection and reduce the development of inflammatory cell infiltrates (Numata et al., 2012). Norris et al. (2017) reported that egg SM improved weight gain, hyperglycemia, and hypercholesterolemia in high-fat-diet-induced obese mice; furthermore, egg SM and a lesser extent milk SM decreased inflammation. SM and its metabolites are the basic components of the myelin sheath in the central nervous system, and dietary supplementation with SM has been reported to promote neural development in infants (Nilsson, 2016; Tanaka et al., 2013). Such data emphasize the importance of studying lipid profiles of food and understanding nutritional value.
Lipidomics
As shown in Fig. 1, a strategy of MS-based lipidomics, of which were divided into three main procedures: pretreatment (lipid extraction), data acquisition [Gas chromatography (GC)/ Liquid chromatography (LC)-MS], and data processing (data analysis).
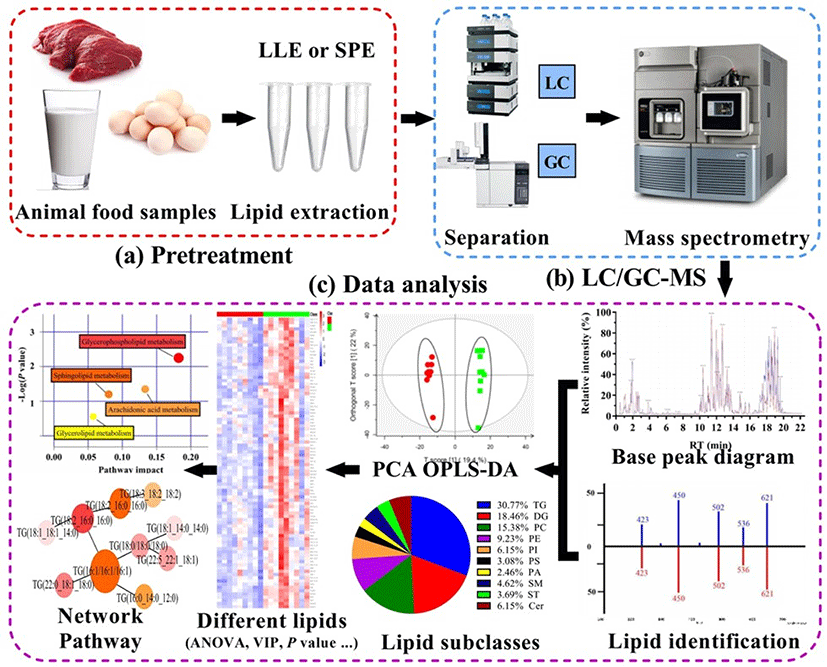
Lipid extraction is pivotal step in lipidomics and needs to be carefully performed to reduce, as much as possible, the influence of impurities on analyses. To improve the efficiency of extraction, suitable methods need to be chosen depending on sample types and target lipids. Lipids from biological or food samples are extracted by liquid-liquid extraction (LLE) and solid phase extraction (SPE) (Tang et al., 2016). LLE is the most popular approach in lipidomics as its separation efficiency is high. Briefly, in this method, target components are separated based on their solubility in immiscible solvents (Jia et al., 2020). While many solvent extraction systems have been applied to date, the three most commonly used methods are Folch, Bligh-Dyer, and Matyash. These methods involve a binary mixture of methanol with a non-polar organic solvent, which promote the extraction of diverse lipid classes (Züllig et al., 2020).
The Folch and Bligh-Dyer methods use the same reagents but in different proportions: the former uses chloroform: methanol:water (8:4:3, v/v/v) and the latter uses chloroform:methanol:water (2:2:1.8, v/v/v). The Bligh-Dyer method uses lesser quantity of solvents compared with Folch method, but the extraction speed is higher and lipid content recovery is much better, too. In these methods, the organic layer is deposited at on the bottom, making its collection difficult; in addition, non-lipid contaminants and salts can be transferred and lipid content can get lost. Considering these demerits and that chloroform is toxic and harmful, but still widely used to assess food samples (Li et al., 2017; Muhamadali et al., 2016), the Matyash method was introduced. This method involves the use of methyl tert-butyryl ether:methanol:water (10:3:2.5, v/v/v), avoiding the use of chloroform and providing comparable results to the Folch and Bligh-Dyer methods (Matyash et al., 2008).
SPE is based on differences in the interaction between various substances in the solid and liquid phases. Substances are first adsorbed on the stationary phase, and then the mobile phase with a different elution ability is used for step-by-step elution, resulting in sample separation (Song et al., 2020). SPE has a high selectivity for lipids and is an important method for targeted lipid extraction, and it is often performed after LLE to eliminate the specific enrichment of certain lipids and remove interference substances from the extract. Solid phase microextraction, which was developed from SPE, is also widely used. This method involves using a coated fiber to extract analytes, and based on electrostatic, ion exchange, and hydrophobic interactions as well as other forces to achieve lipid separation and purification in biological samples, polyacrylonitrile, polydimethylsiloxane, and polyaniline are used as the main coatings (Bojko et al., 2014). Although solid phase microextraction is rapid and easy to perform, it shows low extraction ability and is thus used to analyze a small number of samples (Jia et al., 2020).
In addition to LLE and SPE, other methods have been used for sample pretreatment, such as microwave-assisted extraction (MAE), ultrasonic-assisted extraction (UAE), and supercritical fluid extraction (SFE). MAE uses microwave energy to increase temperature and pressure levels; it is associated with accelerated extraction speed, improved extraction efficiency, and reduced use of organic solvents in the extraction process (Teo et al., 2013). However, the increase in temperature during the extraction process may lead to decomposition of thermally unstable substances. UAE uses, for example, mechanical vibration and diffusion to accelerate material transfer between phases (Tsochatzidis et al., 2001). In comparison with MAE, UAE does not require higher temperatures for extraction, making it suitable for analyzing thermally unstable substances. SFE uses the fluid state of carbon dioxide whose temperature and pressure are above its critical points (general temperature is 31°C and critical pressure is 7.4 MPa); the high diffusion and very low surface tension of the supercritical fluid leads to effective sample extraction or separation. The polarity of supercritical CO2 is similar to that of pentane, which is suitable for the extraction of hydrophobic substances. When methanol, dichloromethane, or water are used as additives, they can even be used to extract polar substances (Pourmortazavi and Hajimirsadeghi, 2007). SFE, as a new extraction and separation method, shows high extraction efficiency, little or no contamination, and is convenient to perform, making its application highly favorable for analyzing biological and food samples (Belayneh et al., 2017; Pourmortazavi et al., 2018). Such developments in lipid extraction and separation have considerably promoted the analysis of lipid structures.
MS is the most popular method for lipid detection considering that it is high throughput and highly sensitive. In recent years, high-resolution MS has become the first choice for lipidomics, with several methods being widely used, including quadrupole-time-of-flight (Q-TOF) MS, ultrahigh performance liquid chromatography (UPLC)-triple quadrupole-ion trap MS, triple quadrupole MS, and Fourier transform ion cyclotron resonance MS (Triebl et al., 2017). MS involves two most common ionization techniques: electrospray ionization (ESI) and atmospheric pressure chemical ionization (Hebra et al., 2020). Shotgun lipidomics was developed on the basis of ESI and triple quadrupole tandem MS (MS/MS) (Han and Gross, 2003). Triple quadrupole MS/MS involves three quadrupole mass spectrometers: the first (Q1) and third (Q3) are commonly applied for mass separation, while the second (Q2) is commonly applied for collision-activated dissociation. By adapting the functions of Q1, Q2, and Q3, triple quadrupole MS/MS can be applied for product ion scan, precursor ion scan, and neutral loss scan measurements, making selective reaction and multi-reaction monitoring feasible (Johnson et al., 1990). Multidimensional MS-based shotgun lipidomics was developed in 2009 (Yang et al., 2009). In practical applications, the combination of MS and chromatography can effectively reduce matrix interference and facilitate the separation of lipid compounds.
GC-MS and LC-MS are the main detection methods used in lipidomics. GC is usually employed for separating volatile and thermally stable compounds. It is mostly combined with chemical ionization and electron ionization MS, which increases its separation efficiency, enhances reproducibility, and makes it relatively economical. For analyzing nonvolatile lipids, it is necessary to derivatize samples, which is time consuming and also requires a high number of samples. Such factors can easily cause changes in samples and/or result in the introduction of new interfering compounds (Miao et al., 2019). Considering these limitations, GC-MS is largely used for targeted lipidomics to analyze simple fatty acids and less polar lipids (Ghidotti et al., 2018). Targeted lipidomics is typically based on low resolution MS; specific lipid molecules are analyzed using triple quadrupole MS with multi-reaction monitoring and neutral loss and precursor ion scanning modes, which provides high specificity, high sensitivity, and quantitative accuracy. However, the number of targets is limited and the establishment method depends on the standard (Xu et al., 2020).
LC includes a normal and reverse phase and is based on hydrophilic separation, which makes it suitable for separating different types of lipids. Normal phase chromatography is used to separate lipids according to their polarity; PLs with different polar head groups can be separated, and when combined with MS, its separation efficiency is further enhanced. However, normal phase chromatography requires a long equilibrium time, which makes repeatability poor, and as the mobile phase used in this method is volatile, changes in polarity and retention time drift can easily occur (Samhan-Arias et al., 2012). Hydrophilic interaction chromatography has all the advantages of normal phase chromatography, and it also involves the use of a less volatile mobile phase. Considering its higher separation efficiency and better compatibility with MS, hydrophilic interaction chromatography has been successfully applied for analysis of serum cyclic phosphatidic acid and its related lipids in rat (Fukasawa et al., 2018). Indeed, liquid extraction is evidently the best method for nontargeted lipidomics. Nontargeted lipidomics profiling analysis has been performed using high-resolution LC-MS. This method can not only analyze most lipid types without any bias to reveal the characteristic lipid structure with significant changes but also highlight reasons for such changes (Alcoriza-Balaguer et al., 2019). Its advantages include fast scanning speed, high resolution, high analytical flux, and rich data output; however, there are some disadvantages too, such as low stability, poor repeatability, and small quantitative range (Cajka and Fiehn, 2014; Cajka and Fiehn, 2016).
Li et al. (2021e) recently reported that the single cell lipidomics based on shotgun MS was established. This method involved MS/MS to reveal the class and fatty acyl chains of lipids, as well as the C=C locations and sn-positions of lipids. Furthermore, electro-migration combined with droplet-assisted ESI made MS analyses not only simple but also efficient. Using the combination of chemical derivatization and MS/MS appears to be feasible for the highly complex structural analysis of lipid molecules in a single cell, and this method effectively overcomes problems associated with the limited sample amounts available (Li et al., 2021e). Thus, chemical derivatization coupled with MS/MS could become the important method for single-cell biology and precision medicine.
Lipidomics is a comprehensive method for lipid characterization and can produce a large amount of multidimensional data. The processing and analyses of lipidomics data are similar to those of metabonomics data, to reduce the dimension of multidimensional data (Saccenti et al., 2014). The methods used for the processing and analysis of lipidomics data have been previously reviewed (Checa et al., 2015). Briefly, data analysis requires the application of chemometric tools, including univariate and multivariate analyses. Univariate analysis often involves statistical hypothesis testing methods, including t-test, multiple analysis, and analysis of variance, to analyze whether significant differences exist between groups of samples under a certain variable condition (Gorrochategui et al., 2016). Multivariate analysis is predominantly used for analyzing lipidomics data and can be classified into two types: unsupervised pattern recognition (UPR) and supervised pattern recognition (SPR) (Song et al., 2009). UPR is applied to analyze the overall structure of data without grouping samples, and it includes principal component analysis (PCA) and hierarchical cluster analysis (HCA). PCA is a multivariate statistical analysis in which multidimensional data is transformed into several important variables, namely principal components, and projects datas into 2- or 3-D space; a principal component score graph facilitates the exhibition of data distribution and analysis of data aggregation and dispersion (He et al., 2021). HCA aggregates similar data into one cluster, whereas different data into different clusters. UPR gives too much attention to the details and is incapable of ignoring random errors within a group. On the other hand, SPR is generally used to reduce random errors within a group; it purpose is to found a classification model according to data, and them assign unknown samples to defined sample classes according to its pattern of measured features (Berrueta et al., 2007). SPR methods include linear discriminant analysis, partial least squares discrimination analysis, orthogonal partial least squares discriminant analysis, random forest, and support vector machine (Yi et al., 2016). In modeling analysis, overfitting is easy; fitting rate (R2) and prediction rate (Q2), as well as permutation validation and cross validation, are usually employed to evaluate the fitting and prediction ability of models (Eriksson et al., 2003). In practical applications, when orthogonal partial least squares discriminant analysis is used, permutation validation is often used to determine model overfitting (Boccard and Rutledge, 2013). Qualitative analyses should fully consider co-elution of heterogeneous lipids, overlap of isotope peaks, potential interference from additive ions, and fragmentation within the source, which can be analyzed using specific software and databases for lipidomics (Table 2). Using such methods, differential lipid molecules and biomarkers can be comprehensively screened and identified. Bioinformatics shows the potential to be extensively used for constructing lipid metabolic networks, particularly those related to specific proteins and genes. This should facilitate the monitoring of changes in lipid metabolic pathways and highlight the function of lipids in biological pathways.
| Name | Description | Website or references |
|---|---|---|
| LIMSA | Data analysis based on MS/MS spectra | http://lipid.zju.edu.cn/ |
| METLIN | Data analysis based on MS/MS spectra | https://enigma.lbl.gov/metlin-new-metabolite-identification/ |
| MZmine | LC-MS data analysis workflow | http://mzmine.sourceforge.net/ |
| Lipid View | Analysis based on electrospray MS data. | http://www.absciex.com/products/software |
| LipidXplorer | Data analysis based on MS and MS/MS spectra | https://wiki.mpicbg.de/lipidx/Main_Page |
| LipidSearch | Automatically identify and relatively quantify LC-MS data | http://www.thermoscientific.com/content/tfs/en/product/lipidsearch-software.html |
| LIPID MAPS | Lipid structure, annotation, classification and pathways, analytical methods | http://www.lipidmaps.org |
| Lipid Bank | Lipid structure, name, spectra and literature information | http://lipidbank.jp |
| Lipid Library | Lipid chemical, biological and analytical | http://lipidlibrary.co.uk |
| LipidBlast | In silico tandem MS database for lipid identification | https://fiehnlab.ucdavis.edu/projects/lipidblast/ |
| CyberLipids | Lipid structure and analytical methods | http://www.cyberlipid.org |
| KEGG | Synthesis and degradation of fatty acid, metabolic pathways of lipid | http://www.genome.jp/kegg/ |
| Metlin | MS/MS database | http://metlin.scripps.edu |
Application of lipidomics to assess food from farm animals
In recent years, many studies have been carried out in food from farm animals by using lipidomics (Table 3), which provides new idea for better understanding the nutritional value and quality of food.
| Sample | Technology | Lipid | References |
|---|---|---|---|
| Meat | |||
| Pork (Luchuan and Duroc pigs) | UPLC-ESI-MS/MS | 605 lipids, 23 categories, 211 TG, 95 PC, 66 PE, 46 DG, and 37 Car, Luchuan pigs have higher IMF, including more TG and DG | (Zhang et al., 2021b) |
| Pork (Tibetan, Jilin and Sanmenxia black pigs) | UPLC-ESI-MS/MS | 1,180 lipid species, Tibetan pork showed higher 14 GL, 8 GP, 2 SL, 2 FA, and 2 PR, Jilin pork showed higher 4 GL, 4 GP, 3 ST, 3 PK, 2 FA, and 2 PR | (Mi et al., 2019a) |
| Pork (Beijing Heiliu and Laiwu Chinese black, Duroc) | UPLC-Q-Exactive Orbitrap/MS | 757 lipids, black pork had more TG and less LPC, 55 potential markers | (Li et al., 2021a) |
| Pork (slaughter weight) | UPLC-Q-Exactive Orbitrap/MS | 592 lipids, 19 lipid classes, IMF and TG increased, PC and PE decreased with increasing slaughter weight | (Li et al., 2021b) |
| Black-boned silky fowl (different ages and genders) | UPLC-ESI-Q-TOF/MS | 1,127 lipids, 8 categories, GL and GP, 47 potential markers | (Mi et al., 2018) |
| Donkey meat (different parts) | LC-MS | 1,143 lipids and 14 subclasses, 73 differential lipids | (Li et al., 2021c; Li et al., 2021d) |
| Beef (different origins) | LC-ESI-Q-TOF/MS | Forty potential markers: GL, FA, PIs, PEs, LPEs, LPCs, Cer and SMs | (Wang et al., 2021) |
| Sheep meat (cold chain storage) | UHPLC-Q-Orbitrap MS/MS | Forty-eight changed lipids: 8 FAC, 23 PCs, 3 LPCs, 13 PEs, and 1 LPE | (Jia et al., 2021) |
| Egg | |||
| Chicken egg | UPLC-Q-TOF MS/MS | 1,633 lipid species, 43.78% GP, 25.66% GL, 16.66% FA, 6.86% SP, 4.10% ST, 1.53% PK, 1.10% PR, and 0.31% SL | (Mi et al., 2019b) |
| Egg yolks (duck, hen, and quail) | UPLC-Q-TOF MS | 57 molecular species of phospholipids | (Ali et al., 2017) |
| Chicken egg yolks | High-resolution MS | Glycerophosphocholines and glycerophosphoethanolamines | (Wood et al., 2021) |
| Chicken egg yolks | LC-ESI-Q-TOF MS | 618 lipid species, Tibetan and docosahexaenoic acid egg showed higher phospholipid and lower TG | (Xie et al., 2020) |
| Chicken egg (male and female ) | LC-ESI-Q-TOF MS | 900 lipid species, sex discrimination: acylcarnitine, TG (12:0/22:1/22:3), hemolytic serine (16:0/0:0), Cer (d18:0/18:0), cholesterol (16:1), and PC (18:3/20:4) | (Xiang, 2019) |
| Chicken egg (different diets and environments) | HILIC-LC-MS/MS or UPLC-Q-TOF MS | GL and GP | (Campos et al., 2016; Wu et al., 2020) |
| Milk | |||
| Donkey and cow milk (different lactation stages) | UHPLC-Q-TOF MS | 335 lipids, 13 subclasses, including CL, PA, PC, PE, PG, PI, PS, Cer, SMs, HexCer, Hex2Cers, DG, and TG | (Li et al., 2020b; Li et al., 2020a) |
| Goat milk (different geographical origins and lactation stages) | UPLC-Q-Exactive Orbitrap MS | 56 lipid species, 14 subclasses, including 5 CL, 45 Cer, 17 LPCs, 4 LPEs, 36 PCs, 80 PEs, 9 PGs, 22 PIs, 2 acyl carnitine species, 55 HexCer, 56 SMs, 17 FA, 15 DG, and 416 TG | (Liu et al., 2020) |
| Human, bovine, and caprine milk | UHPLC-Q-TOF MS | 13 lipid classes, including TG, DG, SM, PC, Cer, HexCer, Hex2Cer, PE, PG, PS, PI, PA, and CL | (Wang et al., 2020) |
| Donkey, human, and cow milk | UHPLC-Q-Exactive Orbitrap MS | 11 subclasses and 475 lipids, including 380 TG, 13 DG, 67 GP, 14 SP, and 1 wax exter | (Zhang et al., 2021a) |
| Bovine milk with vegetable oils or fats | Matrix-assisted laser desorption/ionization-Q-TOF MS | 20 TG classes with high speed and reliability | (Garcia et al., 2012) |
| Goat, soy, and bovine milk | UPLC-Q-Exactive Orbitrap MS | Goat milk was rich in medium-chain TG, USFA, and n-6 and n-3 FA, soy milk was rich in PC, PE, PS, and PG, while bovine milk was rich in TG, DG, and Cer, fourteen lipids potential markers | (Li et al., 2017) |
| Cow milk (heat stress of cow) | UHPLC-Q-TOF MS | Heat stress increased long-chain fatty acids; moreover, reduced PE, PS, PC, LPC and glucoceramide, potential markers: LPC | (Liu et al., 2017) |
Lipid is a key dietary component that affects meat quality and nutritional value. Using UPLC-ESI-MS/MS, Mi et al. (2019a) identified 1,180 lipid species in pork samples collected from black pigs in different places. Tibetan pork contained 28 higher lipid species (14 GL, 8 GP, 2 SL, 2 FA, and 2 PR) and Jilin pork contained 18 higher lipid species (4 GL, 4 GP, 3 ST, 3 PK, 2 FA, and 2 PR). Further, polyunsaturated fatty acid (PUFA) content of Sanmenxia pork was significantly higher compared with Tibetan and Jilin pork. Such data indicate that lipid species can be used for the differentiation of the meat quality of different pork samples, facilitating the determination of the geographical origin of meat. Zhang et al. (2021b) performed lipidomics (UPLC-ESI-MS/MS) and transcriptomics analysis of the muscle of different breeds of pigs to reveal differences in intramuscular fat (IMF), and they found that Luchuan pigs showed significantly higher IMF content than Duroc pigs. Further, a total of 605 lipids were detected in 23 categories, including 211 TG, 95 PCs, 66 PEs, 46 DG, and 37 Cer. In comparison with Duroc pigs, 194 lipids (including 61 TG and 36 PCs) were upregulated and 45 (including 18 PCs) were downregulated in Luchuan pigs. Mi et al. (2018) applied UPLC-ESI-Q-TOF/MS-based lipidomics to study the lipid profile of chicken, and they found 1,127 lipid species across 8 categories in Taihe black-boned silky fowls. Of them, 88, 11, and 1 lipid species were identified between different age, gender, and carcass parts; moreover, PUFA levels in birds with long feeding time (older months) were significantly higher than those in birds with short feeding time. LC-ESI-Q-TOF/MS lipidomics has also been used for the identification of beef from different countries. Forty potential markers were identified in the study by Wang et al. (2021), which mainly included GL, FA, PIs, PEs, lysophosphatidylethanolamines (LPEs), lysophosphatidylcholines (LPCs), Cer, SMs, and N-acylethanolamines. Beef samples from Canada, Argentina, and New Zealand showed higher similarity, while those from Brazil, Australia, and Uruguay were more similar. In another recent study (Jia et al., 2021), UHPLC-Q-Orbitrap MS/MS lipidomics was applied to analysis lipid variations in sheep meat during storage. Forty-eight significantly changed lipids were identified, including 8 FA carnitines (FAC), 23 PCs, 3 LPCs, 13 PEs, and 1 LPE. In the first 12 days, the levels of PCs, PEs, and FAC increased, and after 12 days, their levels decreased; the levels of LPEs and LPCs increased in whole cold chain storage. The transient accumulation of PCs, PEs, and FAC induced a large number of oxidation reactions after 12 days, indicating that the optimal cold chain time was 12 days. Collectively, such data suggest that MS lipidomics has made rapid progress, enhancing the analysis of lipid profiles, quality determination, and origin traceability of livestock and poultry meat. However, only few studies have explored the effects of feed nutrition on the lipid profile of livestock and poultry meat, and thus, further research is warranted. Based MS lipidomics has made rapid progress in the analysis of lipid prifiles, quality identification and origin traceability of livestock and poultry meat. However, there are few reports on the regulation of feed nutrition on meat lipid prifiles of livestock and poultry, which is a new interdisciplinary subject of nutrition and food chemistry needs further study.
Eggs are a cheap and high-quality source of nutrition, and provide abundant high-quality proteins, and lipids. Lipids account for >60% of the dry weight of egg yolk (Wang et al., 2017). At present, egg quality evaluation with lipidomics is mainly divided into three aspects including component analysis, breed and sex distinction, and feed effect. Lipidomics has been used to characterize lipid profiles of eggs. For example, Mi et al. (2019b) performed UPLC-Q-TOF MS/MS to differentiate eggs, identifying 1,633 lipid species in total. Similarly, Ali et al. (2017) used UPLC-Q-TOF MS to identify PL molecules and classes in duck, hen, and quail egg yolks. In total, 57 molecules of PLs were identified and quantified. Wood et al. (2021) performed high-resolution mass spectrometric detection of lipid compositions in chicken egg yolks, reporting that yolks are a rich nutritional source of complex structural lipids required for lipid homeostasis, such as glycerophosphoethanolamines and glycerophosphocholines. In another study, the complex lipid family SL, including Cer, hexosylceramide, ceramide phosphoethanolamine, and hydroxysphingomyelin, was detected in egg yolks using lipidomics. Ceramide phosphoethanolamine, a naturally occurring lipid, is a key membrane component (Masood et al., 2010), whereas hydroxysphingomyelin plays an essential role in reducing the risk of prostate cancer and endometrial cancer (Li et al., 2017; Schmidt et al., 2020). Xie et al. (2020) used ultrasound-assisted one-phase solvent extraction method coupled with LC-ESI-Q-TOF MS for profiling of egg yolk lipids; 618 lipid species were identified in the yolks of green shell eggs, Tibetan eggs, native eggs, and docosahexaenoic acid eggs. Moreover, PCA can clearly distinguish the four types of eggs: Tibetan and docosahexaenoic acid egg yolks showed higher PL content and lower TG content. In another study, 900 lipid species were identified in the egg yolks of male and female chickens; 76 different lipid species were identified, of which 73 were downregulated and 3 were upregulated in female vs. male chickens. Acylcarnitine, TG (12:0/22:1/22:3), hemolytic serine (16:0/0:0), Cer (d18:0/18:0), cholesterol (16:1), and PC (18:3/20:4) were found to markedly contribute to sex discrimination (Xiang, 2019). Campos et al. (2016) applied HILIC-LC-MS/MS lipidomics to determine TG and PL profiles of egg yolks. They found that PC and PE content of eggs from free-range hens that were fed with vegetable origin food was higher, while TG content of eggs from hens fed with animal origin food was higher. UPLC-Q-TOF MS was applied by Wu et al. (2020) to determine egg yolk lipid profiles of hens fed different diets for 2 weeks. They found that eggs from laying hens were rich in n-3 PUFA; further, eggs from laying hens fed diets supplemented with flaxseed showed a significant increase in TG level, but the effect of flaxseed supplementation on highly unsaturated fatty acids (HUFA) enrichment was not obvious. In contract, HUFA content in eggs from laying hens fed diets supplemented with Schizochytrium sp. was significantly higher, and many classes of PC and PE were present in them. Most previous studies have used lipidomics approaches to assess lipid profiles of chicken and duck eggs; such studies need to be conducted using goose eggs in future. In addition, lipidomics-based investigations need to be conducted to determine changes in lipid molecules during the processing (cooking or frying) and storage of eggs.
Dairy products are rich in various bioactive lipids, such as GL, GP, SP, isopentenes, SL, PK, and FA (Fontecha et al., 2005). The lipid profiles (structure and class) in milk not only affect its physical and chemical properties and the quality and yield of dairy products but also the absorption efficiency and health of humans (Smiddy et al., 2012; Vyssotski et al., 2015; Zou et al., 2013). A study found that saturated and monounsaturated fatty acid levels in the milk of non-ruminants (horses and donkeys) were significantly lower than those in the milk of ruminants (buffaloes, cows, goats, and sheep), whereas the opposite was true for the content of PUFA, in particular 18:2n-6 and 18:3n-3 (Gantner et al., 2015). The variations in lipid classes and contents in milk lead to different types of dairy products with different nutritional values. Besides, due to the complexity of milk lipid composition and difficulties associated with lipid structure determination, only >500 types of lipids have been identified in milk lipid, with a large number of them still to be identified and characterized (Liu et al., 2018). Therefore, lipid profile analysis of milk samples using lipidomics plays a pivotal role in the quality evaluation and characterization of dairy products.
Using UHPLC-Q-TOF MS, 335 lipids across 13 categories were identified in donkey milk (Li et al., 2020b) and cow milk (Li et al., 2020a) at different lactation stages, including CL, PA, PC, PE, PG, PI, PS, Cer, SMs, species of simple Glc series (HexCer), Hex2Cers, DG, and TG. A total of 756 lipids across 14 categories were identified in the milk of goats from different geographical origins and at different lactation stages using UPLC-Q-Exactive Orbitrap MS, including 5 CL, 45 Cer, 17 LPCs, 4 LPEs, 36 PCs, 80 PEs, 9 PGs, 22 PIs, 2 acyl carnitine species, 55 HexCer, 56 SMs, 17 FA, 15 DG, and 416 TG (Liu et al., 2020). In another study, 13 lipid classes were identified in human, bovine, and caprine milk using UHPLC-Q-TOF MS, including TG, DG, SM, PC, Cer, HexCer, Hex2Cer, PE, PG, PS, PI, PA, and CL (Wang et al., 2020). Further, using UHPLC-Q-Exactive Orbitrap MS, 475 lipids across 11 categories were identified in donkey, human, and cow milk, including 380 TG, 13 DG, 67 GP, 14 SP, and 1 wax exter (Zhang et al., 2021a). Interest driven makes the adulteration of dairy products serious. Lipids are a key component affecting the quality and safety of dairy products. Garcia et al. (2012) found that the 20 TG classes with high speed and reliability were identified in bovine milk powder supplemented with oils or fats using matrix-assisted laser desorption/ionization-Q-TOF MS. Subsequently, Calvano et al. (2013) proposed the use of intact PLs as markers of illegal bovine milk adulteration. They found the abundance ratio of the ions at m/z 706.6 and 703.6 to be species specific, suggesting that this approach could serve as an efficient, time-saving, and inexpensive way of detecting milk adulteration. Another study detected the lipid compositions of goat, soy, and bovine milk using UPLC-Q-Exactive Orbitrap MS. Goat milk was found to be rich in medium-chain TG, USFA, and n-6 and n-3 PUFA (particularly 20:5n-3 and 22:6n-3); soy milk was rich in PC, PE, PS, and PG, while bovine milk was rich in TG, DG, and Cer. Fourteen lipids were identified in total in the three types of milk, providing a new perspective for dairy product authentication and adulteration differentiation (Li et al., 2017). LC-MS has also been applied to study the effect of heat stress on the lipid profile of cow milk. Heat stress decreased the contents of short- and medium-chain fatty acids and increased that of long-chain fatty acids; moreover, it significantly reduced the abundance of five polar lipids, including PE, PS, PC, LPC, and glucoceramide. LPC could potentially serve as a biomarker of heat stress as its content in the milk of heat tolerant cows was higher than that in the milk of heat susceptible cows (Liu et al., 2017). Thus, the application of lipidomics is becoming increasingly prevalent to assess milk samples for various purposes. The results of such studies should serve as a reference for processing and development of dairy products, identification of adulteration, and breeding of dairy animals.
Conclusion
In this review, we present lipid classification and functions, and lipid extraction and analyses techniques. We also summarize how lipidomics is being used for the quality assessment of meat, eggs, and milk. Rapid advancements in the field of lipidomics has boosted its adoption for various purposes, such as food composition analysis, authentication and adulteration detection, and geographical tracing. However, some limitations exist that are hindering the widespread application of lipidomics. For example, the structure of lipids is complex and diverse in food, and it is difficult to separate and detect all lipid species using existing methodologies. Further, lipid concentration in a complex sample, potentially containing thousands of types of lipids, can considerably vary, making accurate quantitative analyses challenging. Besides, many lipids are difficult to synthesize, and lipidomics methodologies lack standards, seriously impacting lipid identification and quantification. Finally, information pertaining to lipid profiles collected using different instruments can show variations, and lipid classes and structure need to be accurately defined using a standardized naming system. Accordingly, both scientific and technological advancements are much expected in the field of lipidomics so as to improve lipid separation and quantification, MS-based detection and characterization, and data processing. Simultaneously, combining lipidomics with genomics, proteomics, and/or metabolomics should enhance genetic breeding, improve food quality and safety assessments, and benefit precision nutrition and diet intervention in animal husbandry.