Introduction
The growth of halal market on food products increased every year due to the increase of consumer awareness on halal foods (Haleem et al., 2020; Kurniawati and Cakravastia, 2023). Halal foods are in high demand not only in Muslim countries but also in non-Muslim countries since they are associated with the religion, beliefs, as well as healtful and safe foods (Kohilavani et al., 2021; Kurniawati et al., 2024). However, some misconduct practices were found on halal foods, for instance, the addition or substitution halal foods with non-halal components by unethical players. The main reason in adulterating halal foods with non-halal ones is economics reasons to gain more profits (Owolabi and Olayinka, 2021). Among the food products, meat-based products become the most susceptible to be adulterated with non-halal components, because adulterating meats with non-halal meats is quite easy and is difficult to be recognized, especially in meat products (Li et al., 2020; Siswara et al., 2022). The detection of non-halal meat in declared halal-meat products is truly challenging due to the process applied in cooking treatment that led to the difficulties in detecting adulteration visually, especially using conventional methods (Mortas et al., 2022). Therefore, the advanced analytical methods for detecting non-halal meat adulteration in processed meat products is urgently required.
Currently, a number of analytical techniques are available for the analysis of non-halal meats in products that have been declared to be halal, including spectroscopy, gas chromatography, liquid chromatography, real-time polymerase chain reaction (RT-PCR), enzyme linked immunosorbent assay (ELISA), and mass spectrometry-based method incorporated to gas chromatography or liquid chromatography (Li et al., 2022; Mortas et al., 2022; Perestam et al., 2017; Pranata et al., 2021; Uddin et al., 2021). The DNA-based methods using RT-PCR and protein-based methods using ELISA become the most common methods used in some laboratories for identifying meat species (Hossain et al., 2022). However, in some cases, these methods are not suitable for highly processed food products due to the degradation of DNA and protein (Wang et al., 2021). The complex and rigorous sample preparation also becomes a concern during the employment of RT-PCR and ELISA methods. In addition, a specific probe and a specific monoclonal antibody which are truly costly, are required to obtain high selectivity methods for RT-PCR and ELISA, respectively (Chen et al., 2020; Hossain et al., 2023). Therefore, effort on the exploration and development of other analytical approaches are important to obtain effective, efficient, and powerful techniques for analysis non-halal meats in highly processed meat products.
Recently, metabolomics emerges as a powerful approach for the comprehensive analysis of metabolites contained in samples (Harrieder et al., 2022). It has been used by many researchers to identify metabolites in various research fields such as food analysis, clinical diseases, drug discoveries, plant analysis, etc. (Liang et al., 2024; Xu et al., 2024). Metabolomics allows for identification of metabolite changes in food products due to some factors such as processing, cooking treatment, storage, and adulteration (Shi et al., 2024; Utpott et al., 2022). Some analytical techniques which are eligible for metabolomics included gas chromatography-mass spectrometry, liquid chromatography-tandem mass spectrometry (LC-MS/MS), liquid chromatography-high resolution mass spectrometry (LC-HRMS), and nuclear magnetic resonance spectrometry (Jia et al., 2021; Lau et al., 2020; Nguyen Thi et al., 2021; Pranata et al., 2021). Among the metabolomics techniques, LC-HRMS offers a high sensitivity and a high resolution for the comprehensive identification of metabolites from certain samples. A higher number of metabolites could be obtained from LC-HRMS compared to other analytical techniques. Due to its sensitivity and resolution, LC-HRMS can profile a broad spectrum of metabolites, including polar and non-polar compounds, which is essential for comprehensive metabolomics studies. In addition, the separation of metabolites through the LC system allows to reduce the overlapping analytes which can be better detected on HRMS. Therefore, other method might not be able to identify as comprehensive as possible of metabolites compared to LC-HRMS (Muguruma et al., 2022). LC-HRMS has been applied for analysis of many types of samples with satisfying results such as in plant extracts, meats, blood plasma, urine, and cell lines (Dinis et al., 2023; Indrianingsih et al., 2024; Jain et al., 2019). Combined with powerful statistical tools of chemometrics, the broad metabolomics data could be managed resulting more interpretable and understandable data. The use of chemometrics for metabolomics data is inevitable due to the complex metabolites data obtained from untargeted metabolomics analysis (Qin et al., 2024). For instance, LC-HRMS untargeted metabolomics and chemometrics such as principal component analysis (PCA) and partial least square-discriminant analysis (PLS-DA) were successfully employed to detect pork in tuna fish meat (Suratno et al., 2023). Moreover, the changes on metabolites of low temperature sausages left at room temperature for several days could be identified using LC-HRMS in conjuction with PCA and PLS-DA (Han et al., 2022).
To the best of our knowledge, there is no report on metabolomics analysis using LC-HRMS assisted with chemometrics techniques for analysis of dog meat (DM) adulteration in beef sausages (BSs). In addition, there is lacking on information on the discriminating metabolites potential for biomarker candidates to distinguish BS and BS containing DM. This is the first study on the metabolomics using LC-HRMS and chemometrics for the authentication of BSs from DM adulteration. The global metabolomics profiling of sausages made from beef, DM, and mixtures of beef-DM has not been studied before. Therefore, the objective of this study was to develop the metabolomics approach using untargeted LC-HRMS to investigate metabolite profiles of sausages made from beef, DM, and mixture of beef-DM. The second objective was to apply chemometrics techniques including PCA, PLS-DA, PLS, and orthogonal PLS (OPLS) to differentiate and classify pure and adulterated BS samples for identification DM adulteration in BS. Moreover, the discriminating metabolites responsible for distinguishing BS and BS containing DM were identified through variable importance for projections (VIPs) value analysis.
Materials and Methods
The LC-MS grade solvents of methanol and water, the Pierce Velos ESI positive calibration, and the Pierce Velos ESI negative calibration were supplied from Thermo Fisher Scientific (Rockford, IL, USA). The HPLC grade methanol and analytical grade of formic acid were purchased from E. Merck (Darmstadt, Germany).
The loin portion of the beef meat was collected from five separate marketplaces in Yogyakarta and Central Java, Indonesia. The loin part of the DM was provided from three meat suppliers in Yogyakarta, Indonesia. The age of both beef and dog was around 2 years old with weight of 300–350 kg and 10–15 kg for beef and dog, respectively. All meats were immediately stored at –20°C until used for sample preparation and analysis.
For both beef and DM, samples were cut into small pieces and then homogenized using a different meat grinder for beef and DM. The procedure for sausage preparation was based on Pebriana et al. (2017) with slight modification. The sausages were made using meats and the ingredients with the proportion of 90% meat and 10% ingredients consisting of onion (2%), salt (2%), tapioca flour (5%), and white pepper (1%). First, the minced meat was blended with all ingredients and homogenized using a blender. The mixtures were then put into a manual sausage maker. The adulterated BS with DM was prepared by mixing beef-DM in binary mixtures consisting of DM level of 0.1%, 1%, 5%, 10%, 25%, 50%, and 75% (w/w). The percentage of adulteration was based on meat weight. A wide range of DM was used to know the effect of DM adulteration on the metabolite’s composition of BS. All sausages were cooked by steaming at around 100°C for 30 min.
Five grams of samples were weighed and put into a 50 mL centrifuge tube. Extraction of metabolites was conducted using solvent of methanol (25 mL), and then vortexed for 30 s. Because methanol can extract a wide spectrum of metabolites from polar to semipolar molecules, it was selected as the extraction solvent (Zeki et al., 2020). To complete the extraction process, the mixture was then sonicated at 25°C for 30 min. Then, 1 mL of supernatant was taken and transferred into a 2 mL centrifuge tube. After being filtered using a 0.22 μm PTFE filter, the supernatant was transferred into a 2 mL HPLC vial. LC-HRMS analysis was then performed on the samples (Windarsih et al., 2022).
Metabolomics analysis was performed using an untargeted metabolomics approach. The analysis of metabolites was according to Windarsih et al. (2022). An ultra-high performance liquid chromatography (UHPLC, Vanquish, Thermo Fisher Scientific) was used to separate the metabolites. A-10 μL sample was injected and eluted through an analytical column of Accucore C-18 (100 mm×2.1 mm×2.1 μm) which maintained at 40°C during the analysis. Mobile phase of water (A) and methanol (B) were used for a gradient elution technique and both added with 0.1% formic acid. The elution started at 0–5 min using 5%B, then linearly increased to 90% B until 16 min. After that, the condition of 90% B was maintained at 16–30 min. Finally, the condition was turned back to 5% B at 30–35 min. The elution flow was performed at 0.30 mL/min.
On the one hand, the metabolites were detected using a HRMS (Q-Exactive Orbitrap, Thermo Fisher Scientific). The ionization of metabolites used a heated-electrospray ionization. During the ionization, the sheath gas flow rate was 32 arbitrary unit (AU) accompanied by sweep gas flow rate of 4 AU and auxiliary gas flow rate of 8 AU. During the detection of metabolites, the temperature of gas heater was set at 30°C, whereas the temperature of capillary was maintained at 320°C. The scanning of compounds was performed at 66.7–1,000 m/z with scanning resolution of 17,000 (MS1) and 17,500 (MS2). Mass spectrometer calibration was performed using Pierce ESI Velos positive and Pierce ESI negative.
The XCalibur software (Thermo Fisher Scientific) was used to process the raw total ion chromatogram (TIC) acquired from LC-HRMS measurement. Then, the TIC was copied and processed for the extraction of metabolites information using a Compound Discoverer software. The steps in Compound Discoverer including spectrum selector, background subtraction, baseline correction, retention time alignment, peak detection, and compound annotations. The identification of compounds used two online databases of MzCloud and ChemSpider. The table of compounds consisted of name of compounds, molecular formula, retention time, calculated molecular weight, and peak area was exported into a Microsoft Excel. The compounds were filtered by: mass error between –5 ppm and 5 ppm and MS2 for the preferred ion.
The metabolites data obtained from Compound Discoverer analysis was exported into Microsoft excel. The table consisting of metabolites name and the area was used for chemometrics analysis. The software of SIMCA 14.1 (Umetrics, Umeå, Sweden) and Metaboanalyst, an online platform, were used for chemometrics analysis. Pattern identification and samples classification were accomplished using PCA and PLS-DA, respectively. Meanwhile, PLS and OPLS were used as quantitative chemometrics for predicting DM in BS. Prior to analysis, the data were scaled using auto scaling technique. PCA was evaluated using the r2 and Q2 value. Meanwhile, PLS-DA was created to discriminate and classify sausage samples and evaluated using r2X, r2Y, and Q2 value. The value of VIP from PLS-DA was examined to determine the discriminating metabolites that distinguish between pure and adulterated samples. Metabolites with VIP value>1.50 and p-value<0.5 from ANOVA analysis were considered to have high responsibility as discriminating metabolites. The validation test was performed to validate PLS-DA model using two techniques, permutation test and receiver operating characteristic (ROC) test. On the other hand, the PLS and OPLS were evaluated for their performance using r2, root mean square error of estimation (RMSEE), of prediction (RMSEP), and of cross validation (RMSECV).
Results and Discussion
Various metabolites from BS, DS, and BS containing different levels of DM could be identified using LC-HRMS with untargeted metabolomics approach. LC-HRMS is known for its high sensitivity in metabolomics analysis due to its high resolution among LC-MS/MS. It has been used to screen the global metabolite profiles of any types of samples including food products, plants, bloods, and plasma (Liesenfeld et al., 2022; Nguyen Thi et al., 2021; Zeki et al., 2020). In this study, the metabolites were putatively annotated against the metabolite database of MzCloud and ChemSpider. Amount of 287 metabolites were selected for further chemometrics analysis. Fig. 1. shows the TIC of sausage made from pure BS), pure DM, and adulterated BS with 50% DM recorded from min 0 to min 35. The TIC from the LC-HRMS untargeted metabolomics shows the fingerprint pattern of each sample due to the difference of metabolites compositions among samples.
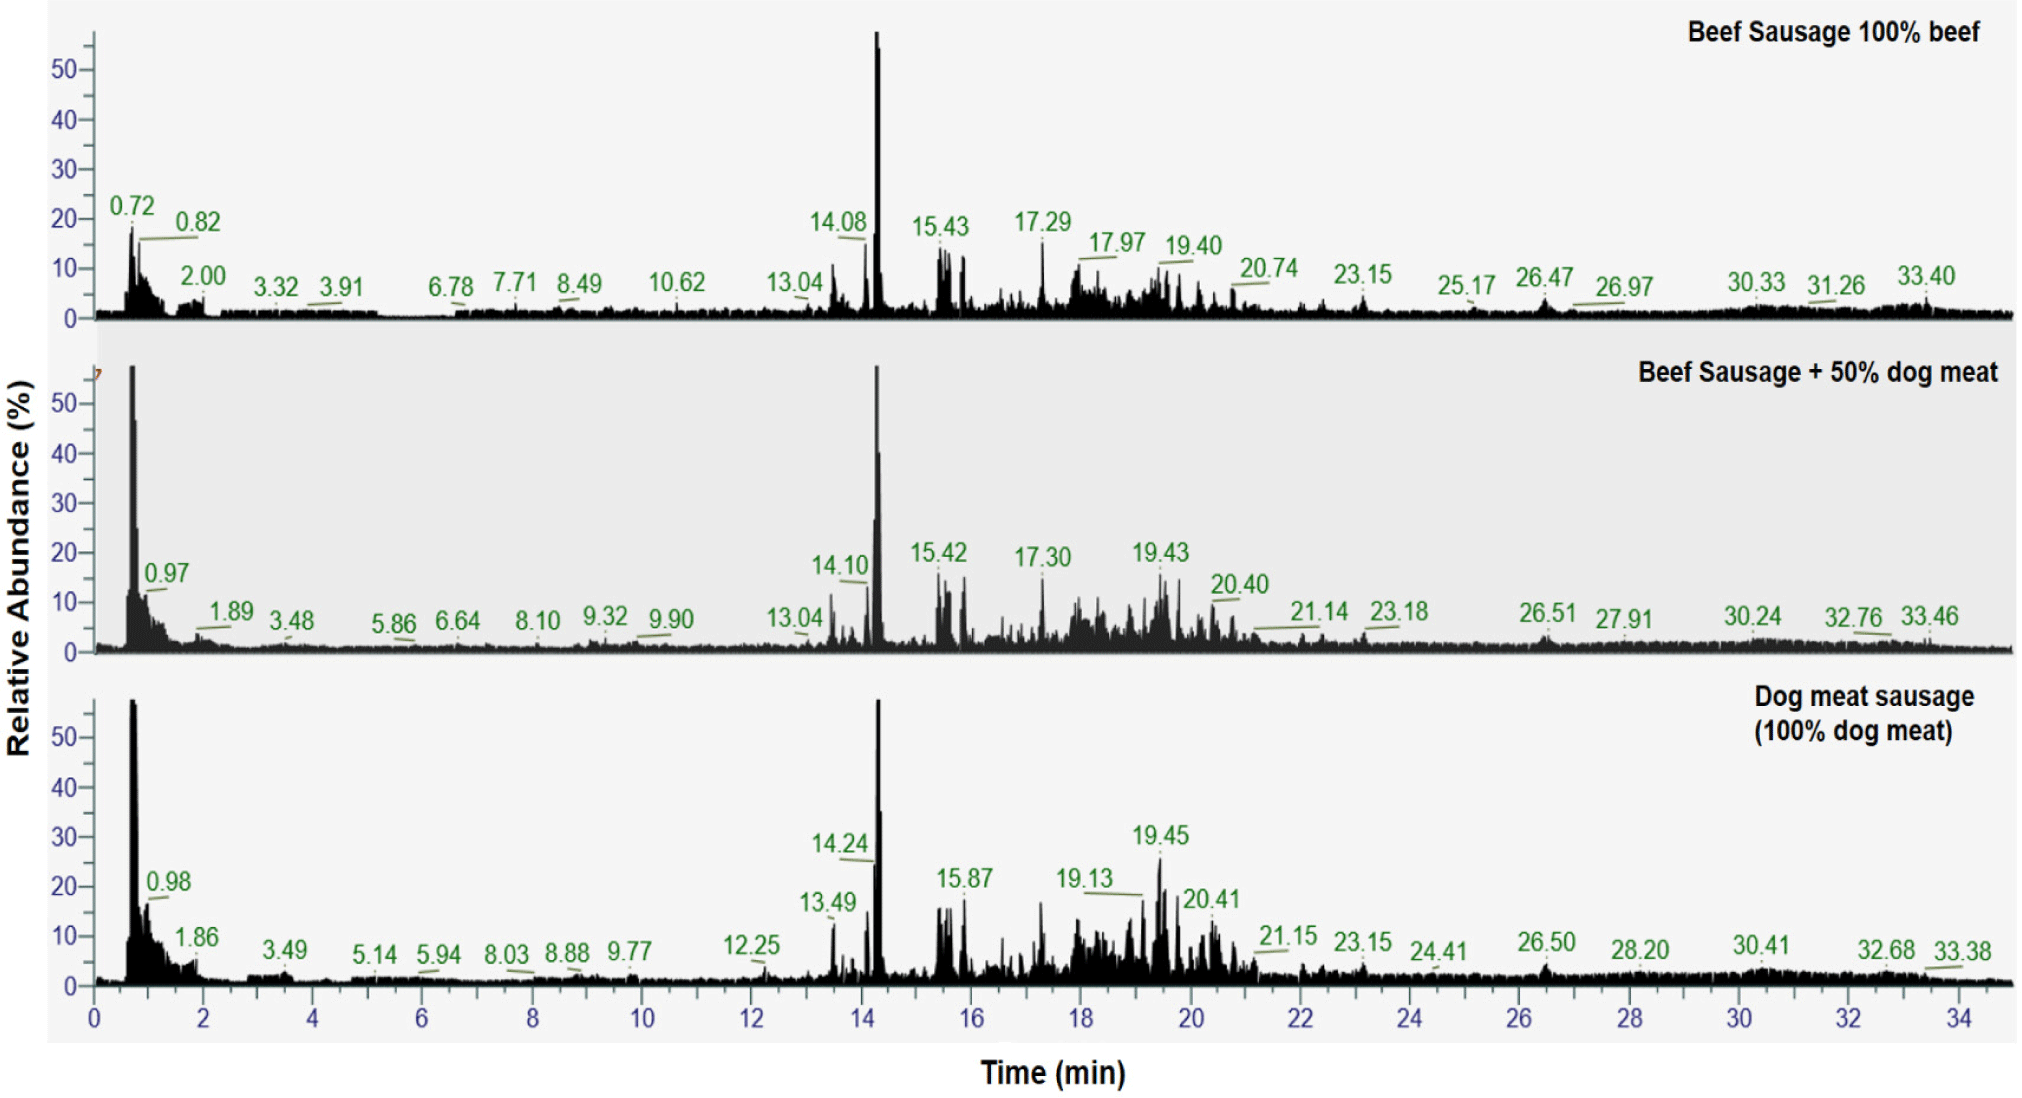
The identified metabolites came from various classes including amino acids, organic acids, fatty acids, glucose, lipids, nucleic acids, peptides, and other classes. Some non-meat metabolites were found because the sausages were made using several ingredients instead of meat to mimic the commercial sausages available in the market. However, the metabolites of meats were still dominant due to the larger proportion of meats (90%) than the other ingredients (10%). The adulteration of meat will obviously affect the metabolites composition because there are differences of metabolites on each type of meat. Therefore, by identifying the metabolites, can be used to reveal the adulteration practices of BS with DM.
The metabolites data were subjected to chemometrics analysis to identify DM adulteration in BS. PCA using the first principal component (PC1) and second principal component (PC2) could differentiate BS made from pure beef, pure DM, and mixing of beef-DM. The PC1 and PC2 accounted for 41.1% and 10.7%, respectively, representing 51.8% of the original variables. The good of fitness of PCA model was shown by the r2 value (0.758), whereas the good predictivity was demonstrated from the Q2 value (0.481). PCA is one of the unsupervised pattern recognitions which is widely used for grouping samples naturally. From the PCA score plot (Fig. 2A), the score plot of pure BS clearly appeared at a different cluster from pure DS. It indicated the difference of metabolite compositions between BS and DS. In addition, the score plot of adulterated BS with DM at various levels, appeared between pure BS and pure DS. The more DM added in BS, the closer the score plot of BS adulterated DM to the score plot of pure DS indicating the changes of metabolites composition due to DM adulteration. Additionally, the tight cluster of QC samples seen in the PCA score plot provided evidence of the stability and intra-reproducibility of the LC-HRMS method.
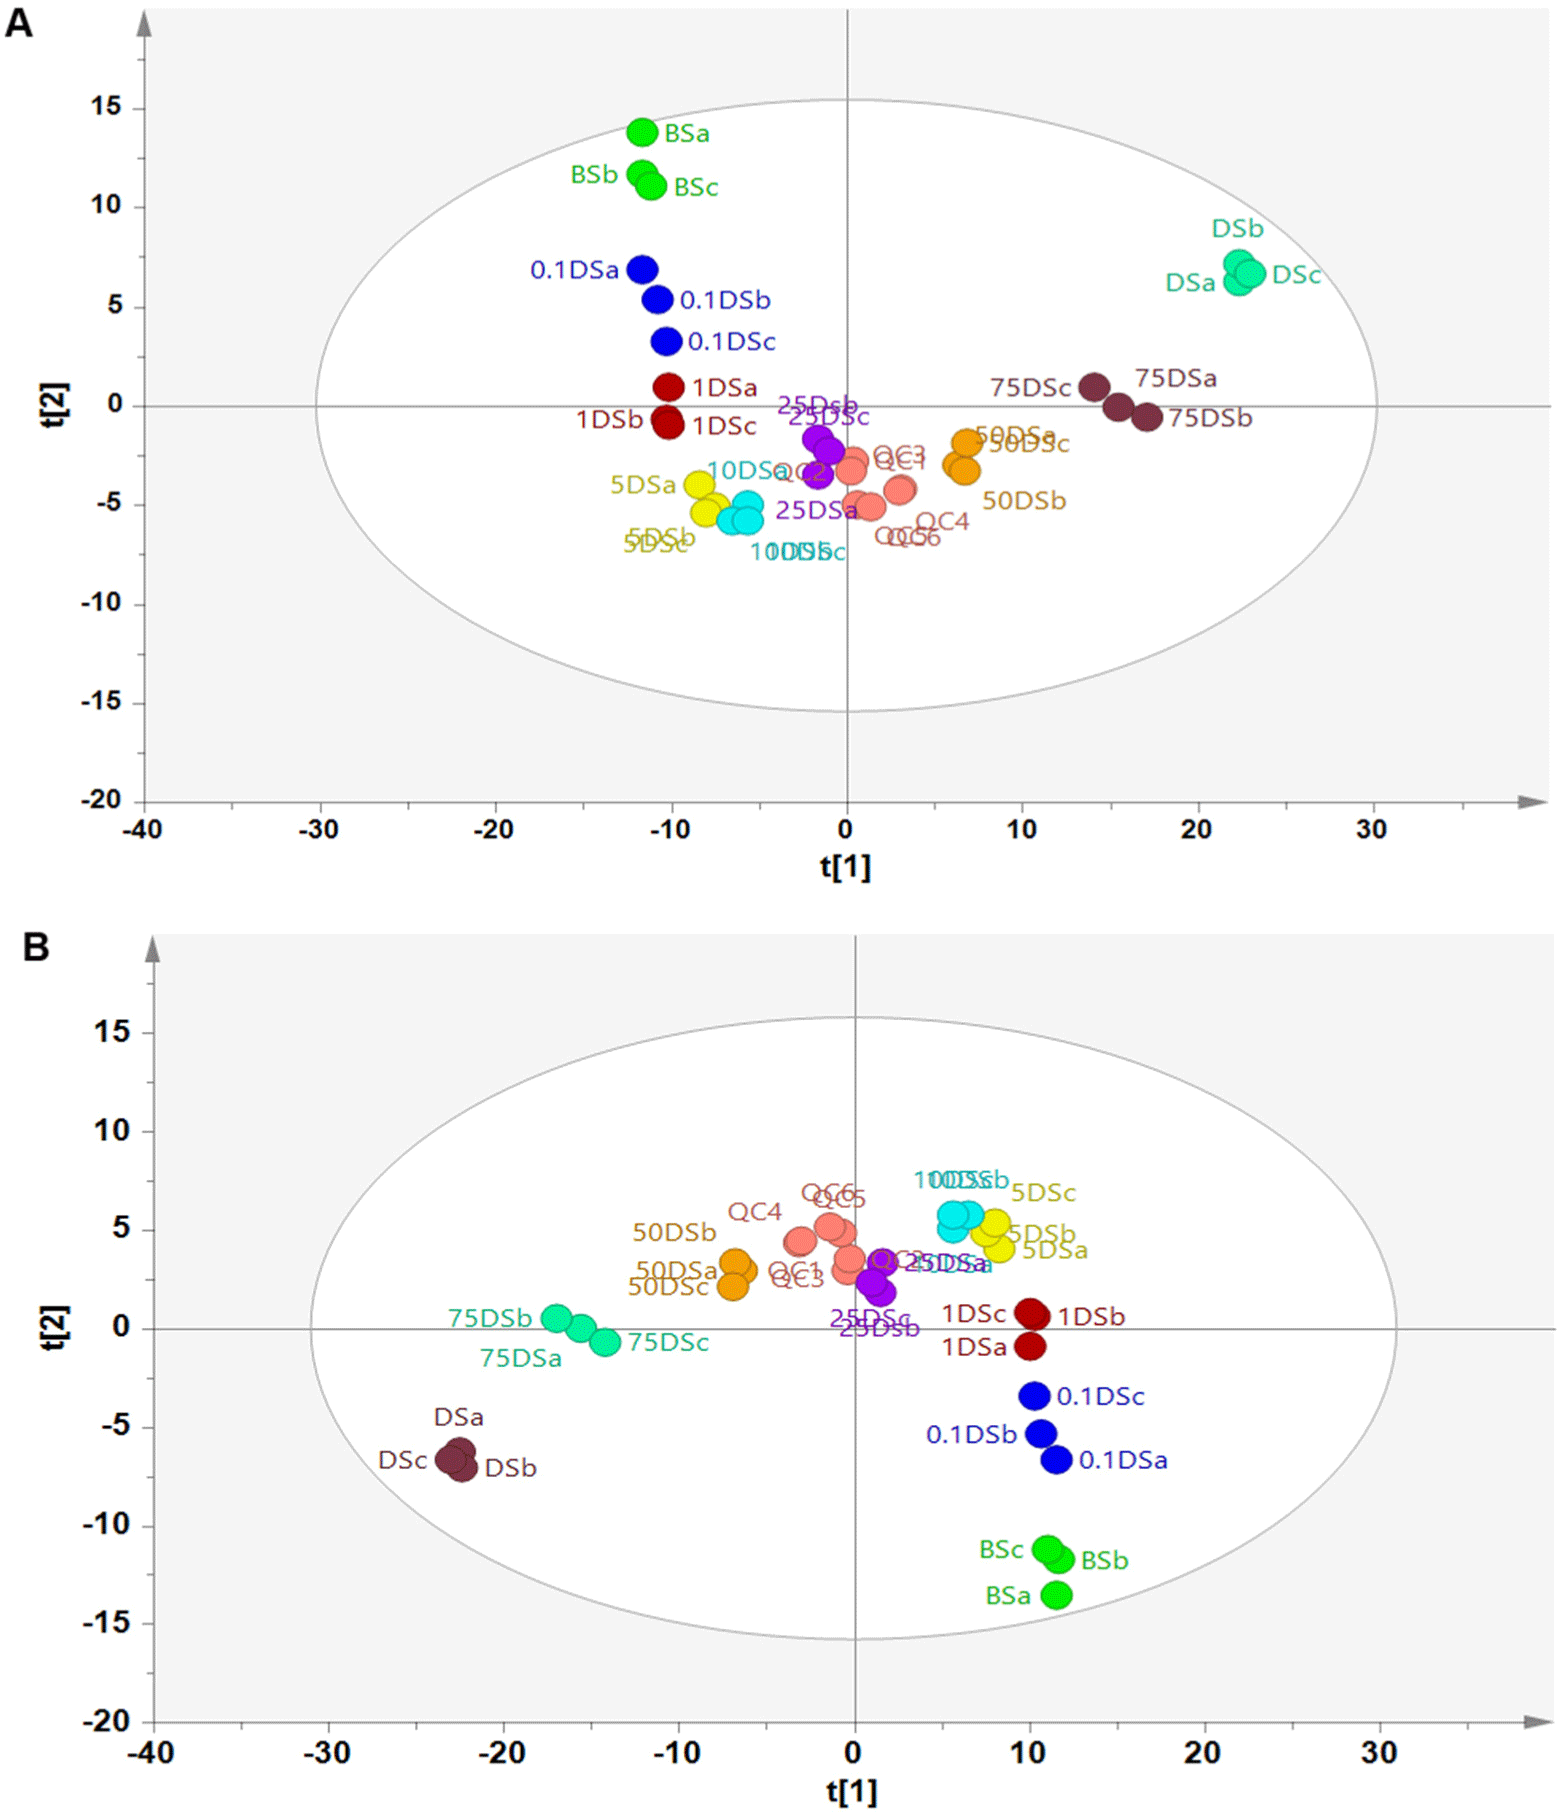
A further PLS-DA analysis was performed to classify sausage samples using the same metabolites as variables used in PCA. Using 12 latent variables (LVs), PLS-DA successfully classified sausage samples according to their compositions with r2X=0.815, r2Y=0.950, and Q2=0.582. Fig. 2B illustrates the PLS-DA score plot using component 1 and component 2 from LVs. The BS made from mixture of beef-DM could be classified into different classes according to the levels of DM added indicating the good accuracy and good prediction capacity of the PLS-DA model. PLS-DA is a supervised pattern recognition, which is often used to evaluate the PCA result. PLS-DA allows for a better discrimination result because it can maximize in searching the correlation between independent variables (x-matrix) and dependent variables (y-matrix) through the LVs. One of the advantages of PLS-DA is the ability to identify metabolites responsible for discriminating samples through the VIP analysis. Metabolites with VIP value higher than 1.0 are considered to have important roles in discriminating among sample classes. The larger the VIP value of the metabolites, the higher the role of metabolites in discriminating samples (Jiménez-Carvelo et al., 2021). Table 1 shows the discriminating metabolites with VIP larger than 1.5 and p-value<0.5. According to Table 1, various metabolites classes were found as discriminating metabolites such as amino acid, organic acid, fatty acid, and lipids.
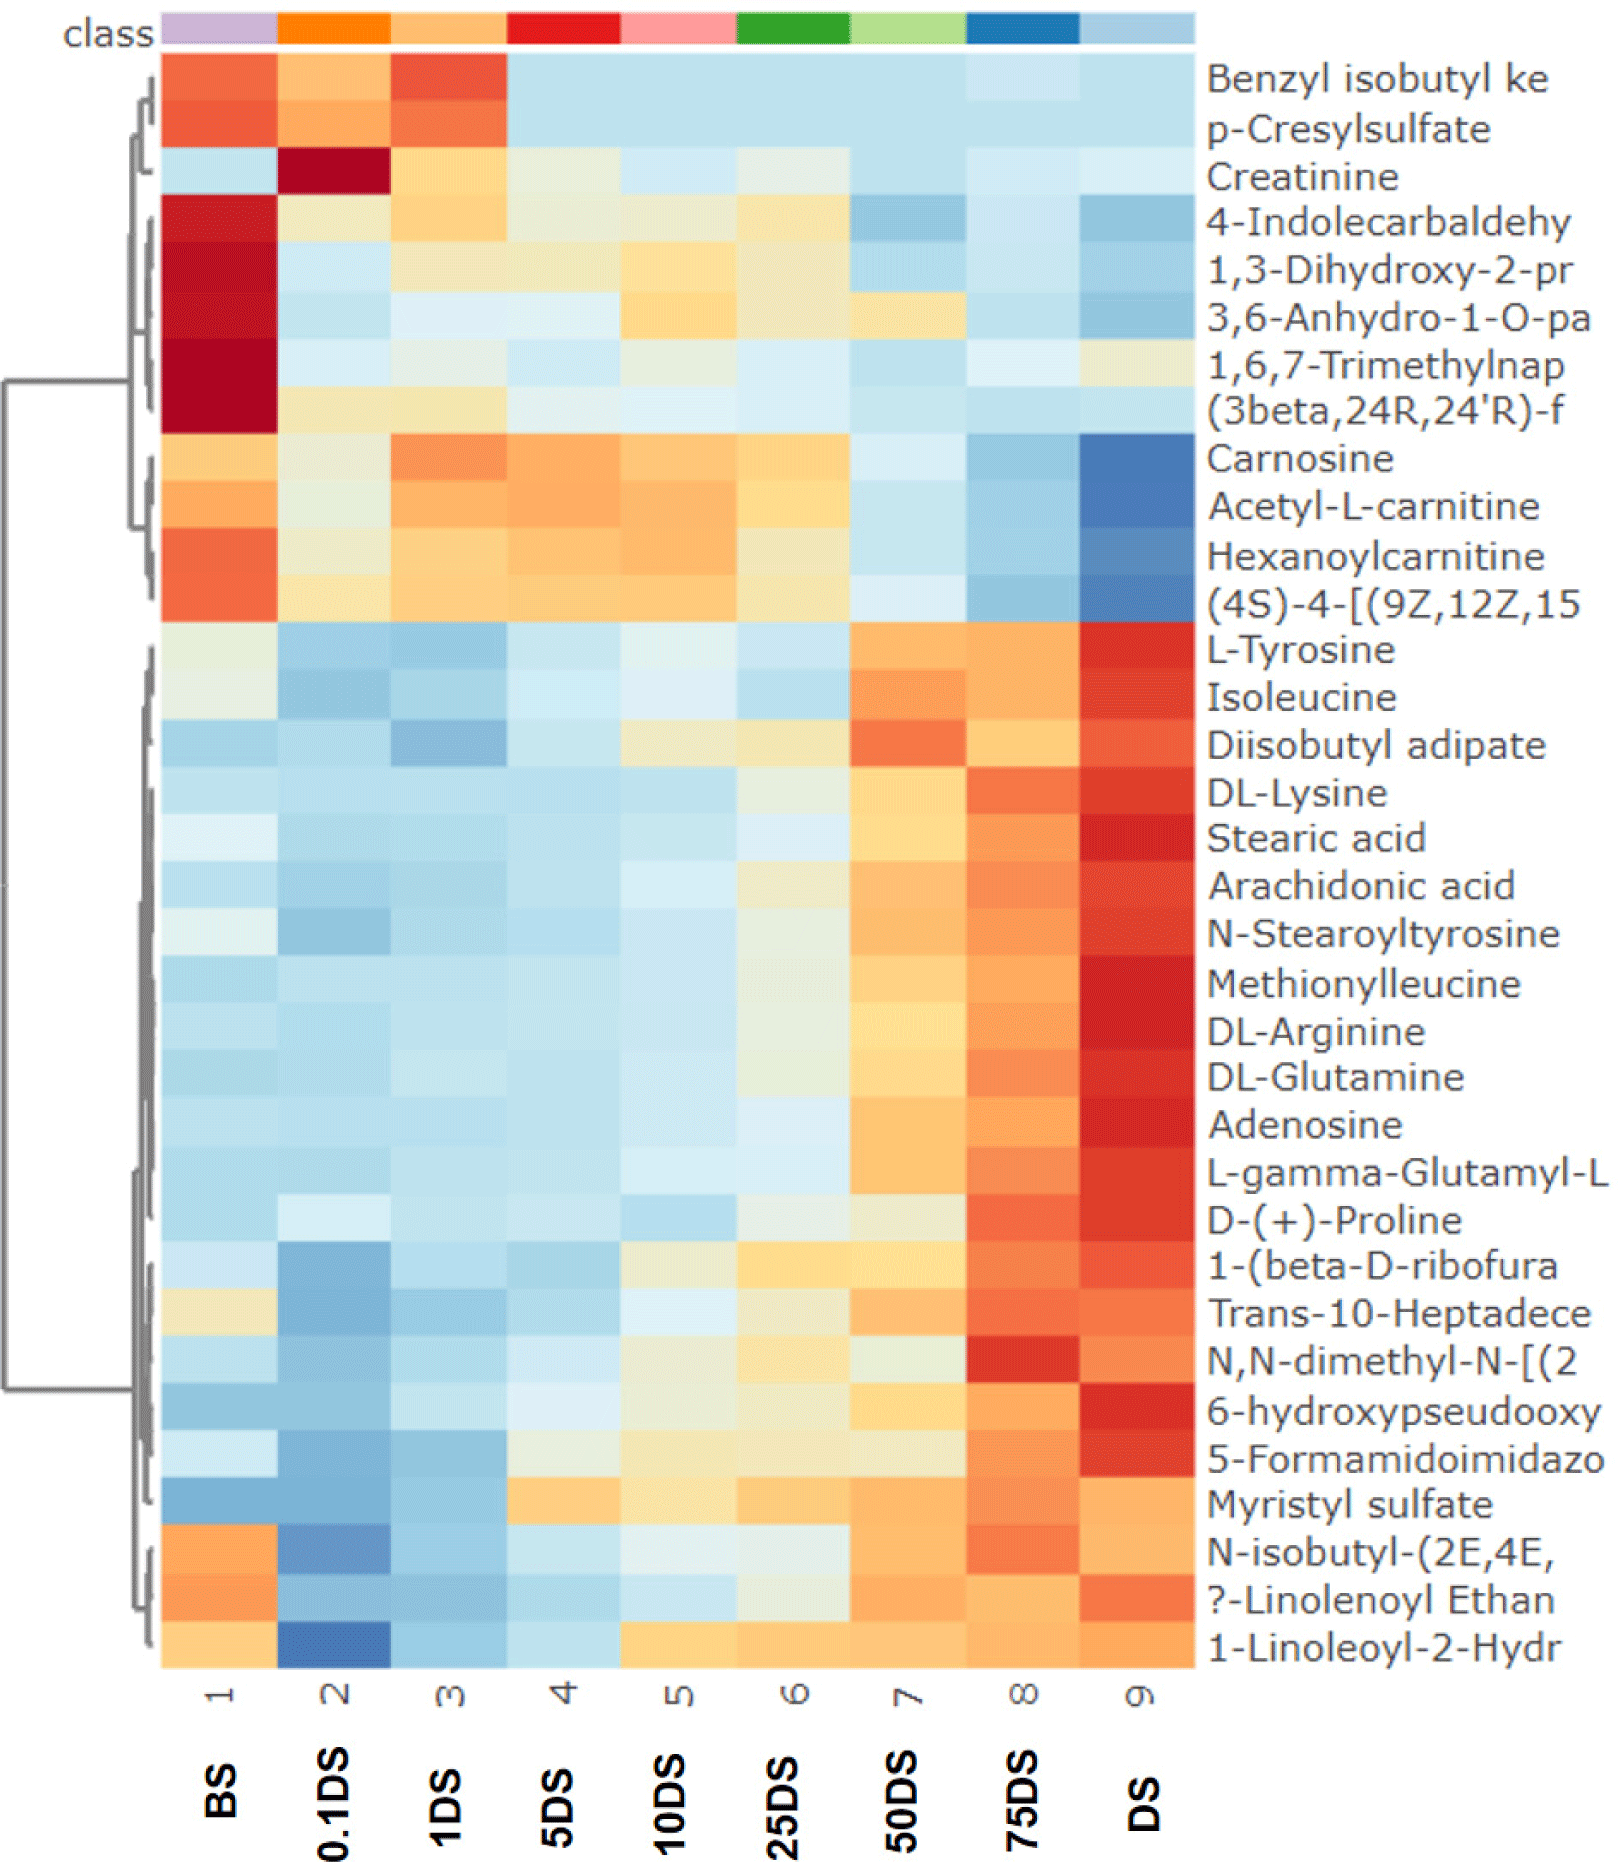
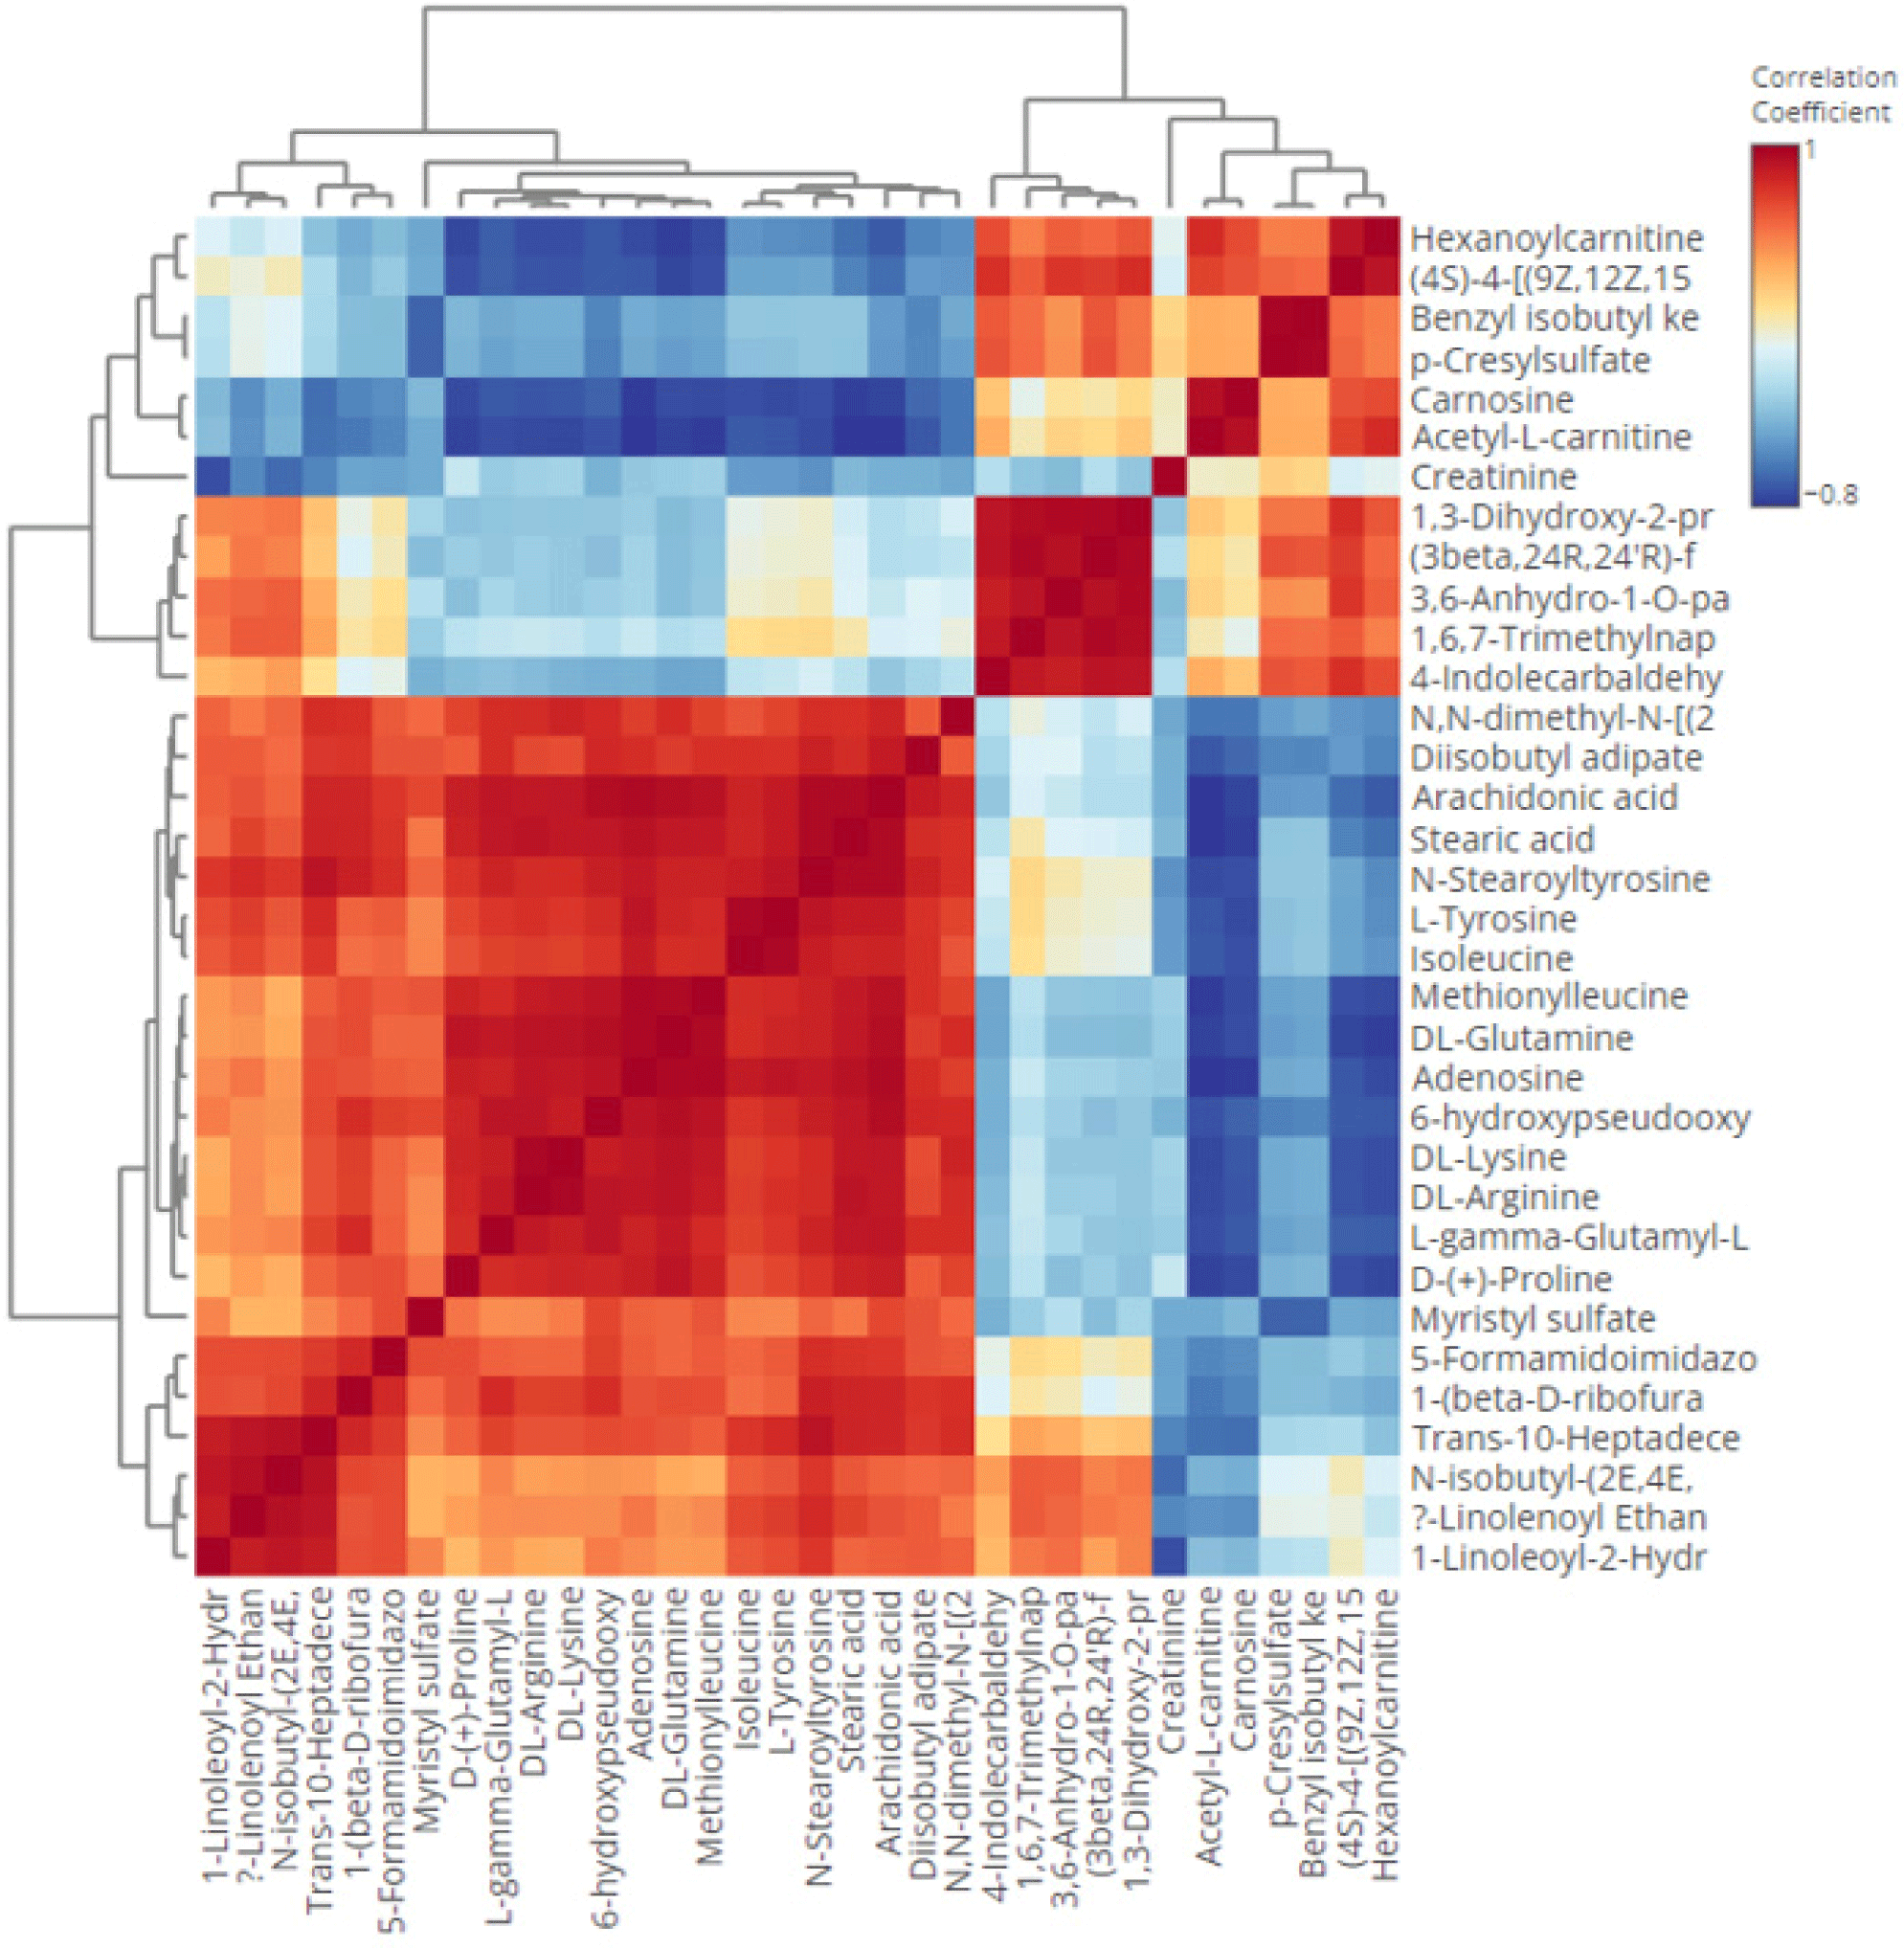
There were eleven metabolites found with high role as discriminating metabolites (VIP value>2.0), consisted of trans-10-heptadecenoic acid, N-stearoyl tyrosine, L-gamma-glutamyl-L-leucine, 1-(beta-D-ribofuranosyl) thymine, adenosine, (3beta,24R,24’R)-fucosterol epoxide, acetyl-L-carnitine, isoleucine, diisobutyl adipate, L-tyrosine, carnosine, and DL-glutamine. Trans-10-heptadecenoid acid was found with the largest VIP value (2.33) and it was found to be high in sausages containing 100% DM. It is a long chain monounsaturated fatty acid (C17:1). It is reported to be a minor constituent in ruminant fats. Previous research reported that the intramuscular fat of ovine, caprine, and bovine contained a minor of trans-10-heptadecenoid acid (Alves et al., 2006). Our study revealed that trans-10-heptadecenoid acid was very high in DS, therefore it is potential to be further explored as a potential biomarker candidate of DM in the future such as using the targeted metabolomics approach. Then, the second largest VIP of discriminating metabolites was N-stearoyl tyrosine. It belongs to the class of N-acylamides which is also known as an amino acid conjugate. It is an organic compound, known as tyrosine and derivatives which containing tyrosine and derivatives resulting from the reaction of tyrosine at the carboxyl group or amino group (Li et al., 2016). Moreover, the third largest VIP of discriminating metabolites was L-gamma-glutamyl-L-leucine. It is a dipeptide consisted of gamma-glutamate and leucine and obtained from a proteolytic breakdown of larger proteins. It is also known as a bioactive peptide involved in several biological activities such as glucose regulation, inflammation, and oxidative stress (Wu et al., 2022). In addition, using the heat map (Fig. 3), the distribution of discriminating metabolites (VIP>1.5 and p-value<0.5) could be observed. It was found that metabolites of L-tyrosine, isoleucine, diisobutyl adipate, DL-lysine, stearic acid, arachidonic acid, N-stearoyltyrosine, methionilleucine, DL-arginine, DL-glutamine, adenosine, L-gamma-glutamyl-L-proline, D-(+)-proline, Trans-10-Heptadecenoic acid, 1-(beta-D-ribofuranosyl)thymine, 5-Formamidoimidazole-4-carboxamide ribotide, 6-Hydroxypseudooxynicotine, myristyl sulfate, and N,N-dimethyl-N-[(2,3,4,5-tetraphenylcyclopenta-2,4-dienyliden) methyl]amine were found in high area in the sausage samples containing high percentage of DM (50%, 75%, and 100%) and very low in sausages made from 100% beef. In addition, the correlation heat map between each discriminating metabolites is shown in Fig. 4.
To evaluate the performance of PLS-DA in classifying samples, the confusion matrix was measured. The result of confusion matrix analysis (Table 2) shows that the PLS-DA model was able to classify each sample class into their corresponding classes. There was no misclassification observed indicating the good accuracy of PLS-DA in discriminating and classifying samples. In addition, to further validate the performance of PLS-DA, validation test using permutation test and ROCs was conducted on the PLS-DA model. Validation is required for supervised pattern recognition such as PLS-DA to avoid overfitting model which can lead to bias results (Martín-Gómez et al., 2023). Using 15 components, permutation test employing 999 permutations confirmed the validity of PLS-DA model with intersection of Q2 (0.0, –0.579). In addition, ROC test demonstrated the perfect AUC value (AUC=1) for each sample class indicating the correct classification of each sample class and no misclassification between classes occurred.
0.1DS, beef sausages adulterated with 0.1% DS; 5DS, beef sausages adulterated with 1% DS; 1DS, beef sausages adulterated with 5% DS; 10DS, beef sausages adulterated with 10% DS; 25DS, beef sausages adulterated with 25% DS; 50DS, beef sausages adulterated with 50% DS; 75DS, beef sausages adulterated with 75% DS; 100DS, sausages with 100% dog meat.
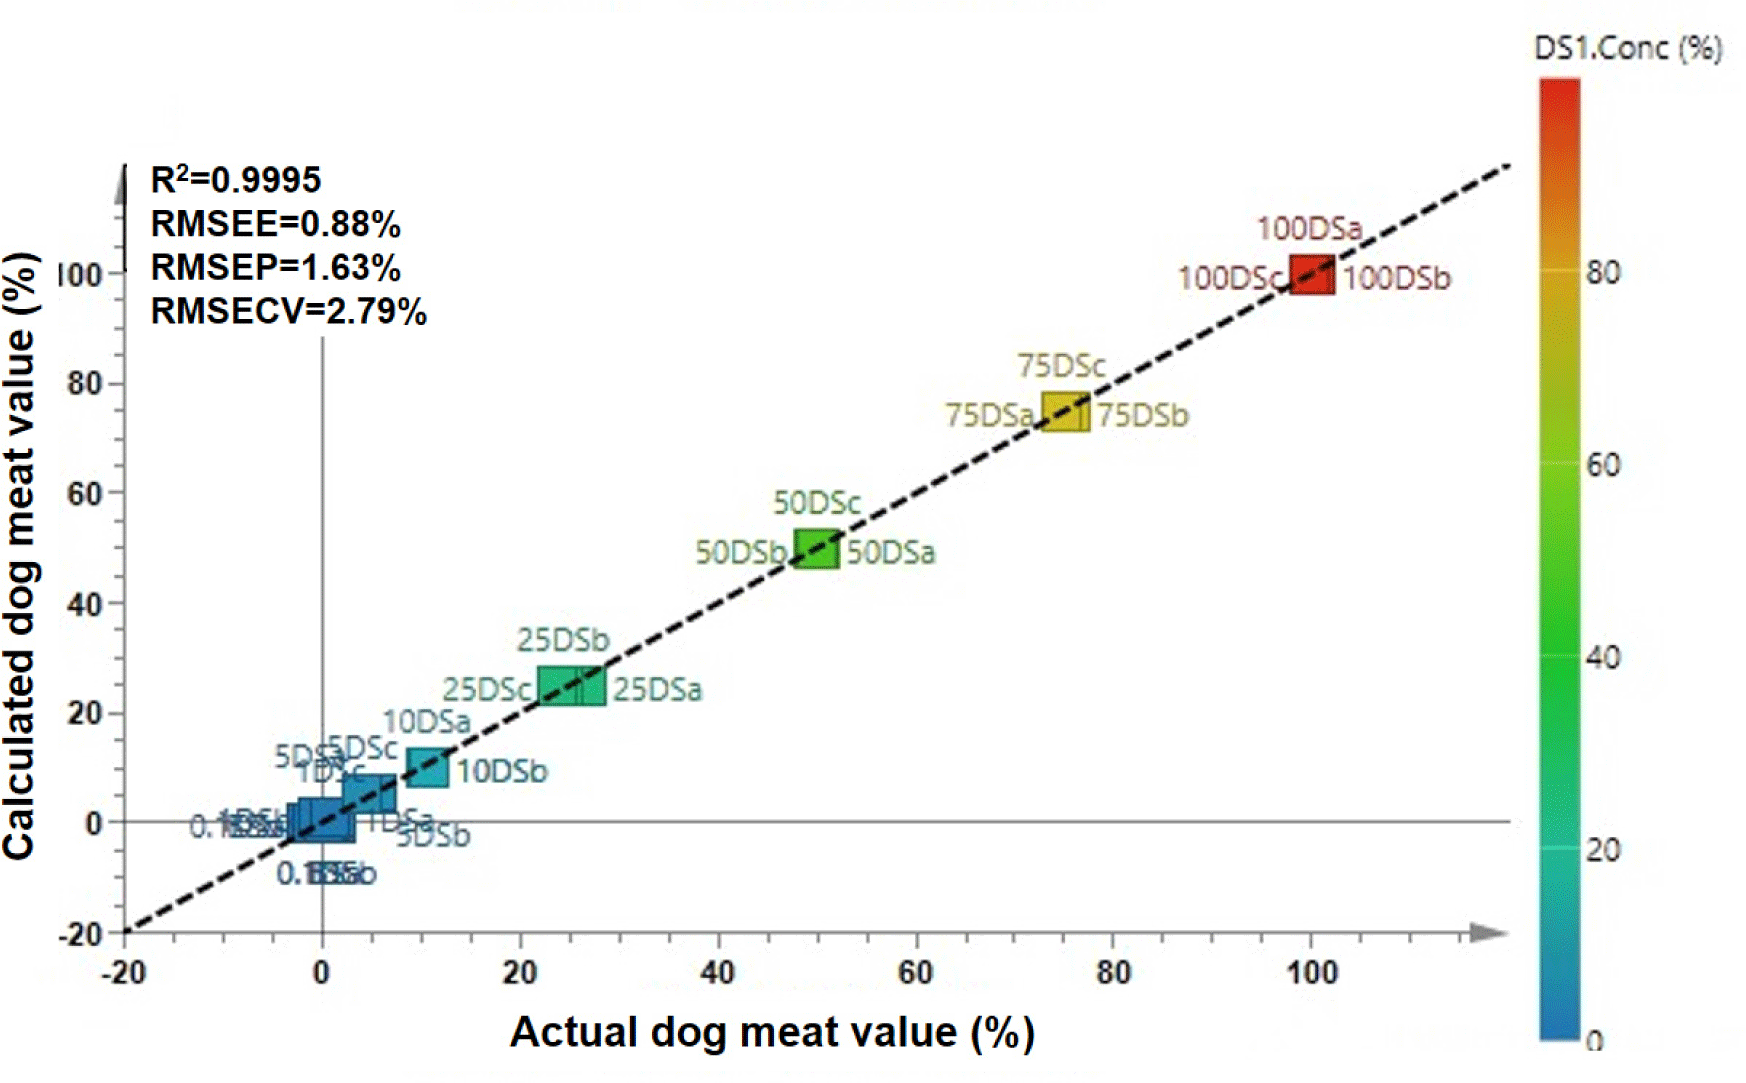
Multivariate calibration chemometrics was also applied using variables of discriminating metabolites (VIP>1.0, p-value<0.5). In this study, PLS and OPLS regression using the metabolite area was created to build a prediction model for detecting and predicting DM levels in BS. The results showed that either PLS or OPLS regression were capable of predicting DM levels with good accuracy (r2=0.9995) for both models. The good precision was shown by the RMSEE, RMSEP, and RMSECV which accounted for 0.88%, 1.63%, and 3.32% for PLS as well as 0.88%, 1.63%, and 2.79% for OPLS, respectively. The OPLS regression had slightly lower RMSECV than in PLS. Fig. 5 presents the plot of actual DM versus calculated DM predicted from the OPLS regression model. It showed that the actual value of DM had a high correlation with the calculated value predicted from OPLS regression. PLS and OPLS has been widely used to predict target of analytes using multivariate data. Using the LVs, PLS and OPLS maximize the searching of correlation between independent variables and dependent variables, thereby resulting an accurate prediction model. In addition, the orthogonal algorithm in OPLS allows for removing the variables which are not correlated to the dependent variables (Eriksson et al., 2012). Therefore, in some cases, OPLS could provide better results than PLS. In metabolomics study, PLS and OPLS are very useful to predict target of analytes to reveal adulteration practices. In this study, PLS and OPLS established the role of discriminating metabolites obtained from VIP analysis as the important metabolites to predict DM adulteration levels in BS.
According to the above results, study on using LC-HRMS is beneficial for further research to conduct in-depth research based on the currently-suggested metabolites, especially the discriminating metabolites obtained from LC-HRMS, because the first step in metabolomics study to discriminate samples which the markers have not been previously defined is to perform untargeted metabolomics for obtaining a global/holistic overview of metabolites. Then, after the discriminating metabolites is obtained from the VIP analysis, the targeted analysis focusing in-depth analysis of the discriminating metabolites is highly recommended to be performed. Therefore, after the targeted analysis was validated, it can be used to detect DM adulteration in BSs using the LC-MS/MS instruments.
Conclusion
Various metabolites in sausages made from beef, DM, and mixture of beef-DM at several levels could be identified using a non-targeted LC-HRMS metabolomics. PCA and PLS-DA were successfully applied to distinguish BS, DS, and BS adulterated DM. Metabolites of trans-10-heptadecenoic acid, N-stearoyltyrosine, L-gamma-glutamyl-L-leucine, 1-(beta-D-ribofuranosyl) thymine, adenosine, (3beta,24R,24’R)-fucosterol epoxide, acetyl-L-carnitine, isoleucine, diisobutyl adipate, L-tyrosine, carnosine, and DL-glutamine were found to have important role as discriminating metabolites with VIP value>2.0. The PLS analysis emphasized the role of discriminating metabolites as potential biomarkers to distinguish DM in BS. It can be concluded that the untargeted metabolomics using LC-HRMS incorporated with chemometrics is promising to be used for authentication of meat products. In the future, research on larger samples and targeted analysis is required to ensure the reproducibility of the method.


