Introduction
Studies on the effect of fat content on the volatile composition of meat have focused on processed meat products, such as meat batter, frankfurter, and ham (Domínguez et al., 2017; Jo et al., 1999; Sirtori et al., 2021). Meanwhile, studies on the effect of carcass quality grade (QG) or the intramuscular fat (IMF) level on the volatile profile of beef are still limited. Fat content in beef is positively associated with taste preference (Frank et al., 2016). Further study is necessary in order to provide more scientific evidence to clarify whether the abundance of aroma volatiles is positively correlated with the fat content in highly marbled beef.
In Korea, Hanwoo steers are finished on a high-energy diet and slaughtered at the age of 30–32 months, so that the marbling score and fat content of the highest QG loin can reach above 7% and 20%, respectively (Koh et al., 2019). The QG, which is determined by the marbling score, influences the generation of beef volatile compounds. Piao et al. (2017) reported that the release of some volatile compounds is affected by the QG of Hanwoo beef. The deposition of fat to muscle is affected by genetic factors; even though the fat amount is similar, beef from different breeds have different aroma profiles (Utama et al., 2018). Moreover, IMF content could influence the generation of volatile compounds and the release of such compounds from the matrix of the meat (Echegaray et al., 2021).
Multivariate analysis can help interpret the data for classification. Principal component analysis (PCA) and cluster analysis (CA) are often used to simplify large amounts of data for a better understanding. However, as these tools are unsupervised statistical methods, it is inappropriate to correlate the content of bioactive compounds with in vitro functional properties (Granato et al., 2018; Nunes et al., 2015). PCA has been widely applied as an adaptive descriptive data analysis tool to investigate the authenticity of food and to determine some intrinsic and extrinsic effects on food quality based on their chemical traits, including the aroma volatile compounds (Kebede et al., 2018; Procida et al., 2005; Suslick et al., 2010; Wang et al., 2014). In addition, hierarchical clustering, a part of CA, helps to identify the origin of the food, the diversity of microorganisms in the food, and ensures the authenticity and quality of the food (Danezis et al., 2016; Granato et al., 2018). Therefore, the objective of this study was to investigate, using sensor data from an electronic nose and a chemometrics approach, whether the differences in the fat to lean muscle ratio (carcass QG) of highly marbled beef contribute to the distinct aroma profile.
Materials and Methods
The M. longissimus lumborum (striploin) of grade 1++, 1+, 1, and 2 Hanwoo steers (n=6), finished under identical feeding systems on a similar farm, were removed from the left side of the carcasses after 24 h of chilling. The striploin was chosen because this cut is usually used for roasts and grills. Samples were vacuum-packed and distributed to the laboratory in an icebox. Proximate composition, pH, color, and fatty acid analyses were performed on day 4 after postmortem. The remaining sample was lyophilized using a benchtop freeze dryer (Eyela FDU-1200, Tokyo Rikakikai, Tokyo, Japan) and stored at −24°C for analysis of volatile compounds and aroma patterns. The dry sample was used to avoid the effect of different moisture contents among QGs.
Samples were ground using a food blender at minimum speed for 10 s (HMF-1600PB, Hanil Electric, Wonju, Korea). The proximate composition was determined using the AOAC official methods (AOAC, 2002). Moisture content was determined by dry-heating the samples at 105°C for 24 h and calculating the proportion of weight loss during heating per fresh weight. Crude fat content was determined by ether extraction using a Soxhlet system. Nitrogen content was determined using the Kjeltec system (2200 Kjeltec Auto Distillation Unit, Foss, Huddinge, Sweden), and crude protein was calculated by multiplying the nitrogen content by 6.25. The ash content was determined by burning the samples in a muffle furnace at 550°C for 16 h.
Meat fat was extracted from the samples using a chloroform-methanol (2:1 v/v) solution and prepared in triplicate (Folch et al., 1957). Fatty acid methyl esters (FAMEs) were prepared in hexane by mixing saponified fat (added with 1 N KOH) with boron trifluoride at 80°C. The fatty acid composition of beef fat was determined using an Agilent gas chromatography system (6890N, Agilent Technologies, Santa Clara, CA, USA). The sample (1 μL) was injected into the GC port using an autosampler (7683, Agilent Technologies). A split ratio of 100:1 was programmed for the inlet and the temperature was set to 250°C. FAMEs were separated using a WCOT-fused silica capillary column (100 m×0.25 mm i.d., 0.20 μm film thickness; Varian Medical Systems, Palo Alto, CA, USA) with a 1.0 mL/min helium flow. The oven temperature and holding-time were programmed as follows: 150°C/1 min, 150°C–200°C at 7°C/min, 200°C/5 min, 200°C–250°C at 5°C/min, and 250°C/10 min. The temperature of the detector was set to 280°C. The peaks were identified as fatty acids using the retention time of the fatty acid standards (47015-U, Sigma-Aldrich, Saint Louis, MO, USA). The peak area of each identified fatty acid was used to calculate the proportion (%) of the total identified peak area.
The volatile compounds from heated samples were separated and identified by gas chromatography-mass spectrometry using a modified version of the method described by Ba et al. (2010). Approximately 1 g of dry sample (prepared in duplicate) was immediately placed in a 50 mL headspace vial and heated at 105°C in a drying oven for 10 min to release the volatile compounds. Prior to extraction, the sample was calibrated to 60°C in a drying oven for 10 min. The carboxen®/ polydimethylsiloxane fiber (Supelco, Sigma-Aldrich) with a diameter of 75 μm was injected into the vial for extraction for 30 min. Following extraction, the fiber was injected into the inlet, which was set to 250°C. The split ration of 1:5 was used for desorbing the volatile compounds for 5 min. Helium was used as the carrier gas at a flow rate of 1 mL/min. Separation of the individual compound was performed using a DB5 fused silica column (30 m×0.25 mm inner diameter, 0.25 μm film thickness; J&W Scientific, Folsom, CA, USA) in a gas chromatograph (7890A, Agilent Technologies). The GC oven was set to operate at an initial temperature of 40°C for 2 min, increased to 160°C (at rate of 5°C/min), then to 180°C (at rate of 6°C/min, holding time of 5 min), and finally to 200°C (at rate of 10°C/min, holding time of 5 min). The interface and quadruple temperatures were set at 280°C and 150°C, respectively. Volatile compounds were detected using a mass spectrometer (5975C, Agilent Technologies). The ion source temperature of the MS was set to 280°C with an electron impact of 70 eV. A scanning mass range of 50–450 m/z with a scan rate of 1 scan/s was used. Identification was performed by comparing the experimental spectra with the National Institute of Standards and Technology (NIST) mass spectral library. Data are presented as area units (AU)×106 /g.
An electronic nose (FOX3000, Alpha MOS, Toulouse, France) was used for analyzing the aroma pattern. Dry and heated samples (0.5 g) were placed in a 10 mL headspace vial and prepared in duplicate. The vial was sealed with a rubber septa cap (Supelco 29176-U, Sigma-Aldrich). The samples were heated at 60°C for 600 s at an agitation speed of 500 rpm. The 2.5 mL of headspace gas was extracted with an automatic sampler syringe (HS 100, Alpha MOS) at 65°C, flow-injected into the port of the electronic nose with synthetic air as the carrier gas (pressure was set to 0.5 bar with 150 mL/min flow rate) and detected by a metal oxide sensor array system with an acquisition time of 150 s. The following sensors were chosen (T30/1, P10/1, P10/2, P40/1, T70/2, PA2) as the sensitivity against fat-derived volatile compounds are high. The sensor resistance ratio (r−r0)/r0 was calculated (r is the real-time resistance and r0 is the sensor’s resistance baseline). The time taken to return to baseline after acquisition was 1,080 s. The maximum resistance ratio was considered as the data value of a single measurement.
The statistically significant difference between the mean values from different QGs was determined using a one-way analysis of variance (ANOVA). The mean values were then separated by Duncan’s multiple range test at a 5% significance level. Correlation coefficients between the resistance ratio of the six metal sensors of the electronic nose and the peak area of the volatile groups were determined using Pearson’s method. Multiple regression analysis was also performed to determine the multiple correlations between the resistance ratio of the six metal sensors of the electronic nose and the peak area of the volatile groups. Two-dimensional PCA and cluster dendrograms were used to discriminate the aroma profile according to the sensor resistance ratio. Analyses were performed using R-version 3.3.3 (R Core Team, 2018) with the “agricolae” package for Duncan’s multiple range test (De Mandiburu, 2017) and with the “dendextend”, “ggfortify”, and “ggplot2” packages for plotting the PCA and cluster dendrogram (Galili, 2015; Tang et al., 2016; Wickham, 2016).
Results and Discussion
The proximate composition of beef striploins of different QGs is presented in Table 1. Among the QGs, moisture and protein content decreased as the QG increased. In contrast, the crude fat content increased as the QG increased. Different carcass QGs showed different fat-to-lean muscle ratios, and the ratio increased linearly as the QG increased. No differences were found in ash content among the QGs. These findings are in accordance with those of previous reports by Piao et al. (2017) and Koh et al. (2019).
The fatty acid composition of Hanwoo beef, categorized by different QGs, is shown in Table 2. No differences were found in the proportions of saturated fatty acids. However, QG 1++ had the lowest proportion of palmitic acid (C16:0; p=0.04). The highest proportion of monounsaturated fatty acids (MUFAs) was found in beef with the highest QG (1++). A higher oleic acid (C18:1n9) proportion was observed in grade 1++ striploin than in lower QGs, contributing to the increased proportion of MUFAs. In contrast with MUFA, the polyunsaturated fatty acid (PUFA) proportion was found to be lower in higher QGs. This is mainly attributed to the higher proportion of linoleic acid (C18:2n6) and arachidonic acid (C20:4n6) in lower-grade striploin. The ratio of omega-6 to omega-3 was found to be higher in beef with higher QG as the α-linolenic acid (C18:3n3) content decreased. Wood et al. (2008) mentioned that neutral lipids are predominantly deposited into intramuscular adipose tissue to build marbling, whereas PUFAs are mostly deposited into the membrane of muscle cells as cell membranes are built by phospholipids. Cho et al. (2020) reported that coarsely marbled Hanwoo beef loins contain higher proportions of PUFAs than the finer ones, which corresponds to linoleic acid (C18:2n6) and eicosapentaenoic acid (C20:5n3). In other words, the proportion of PUFA increases as the meat cut has more muscle area or tends to be coarse in appearance. PUFAs have a lower melting point and are stable in liquid form at ambient temperature, thus establishing the elasticity of muscle cells to contract and relax (Abbott et al., 2012). Previous studies have reported that oleic acid is the major fatty acid in highly marbled Hanwoo beef, and this fatty acid may contribute to a more acceptable flavor (Jo et al., 2013). Furthermore, this study confirms that the proportion of oleic acid in Hanwoo striploin increases with an increase in IMF content or carcass QG, as previously reported (Joo et al., 2017; Lim et al., 2014; Piao et al., 2017).
Carcass quality grade (1++, 1+, 1, and 2) was assessed according to Korea Institute for Animal Products Quality Evaluation (KAPE, 2017).
Carcass quality grade (1++, 1+, 1, and 2) was assessed according to Korea Institute for Animal Products Quality Evaluation (KAPE, 2017).
Three major groups of volatile compounds were identified from different QGs of Hanwoo beef striploin (Table 3). Pyrazine and aldehyde were the two predominant volatile compounds, as the peak areas of these volatile groups were higher than those of hydrocarbons. Lyophilized samples (dry, with low water activity) were used in this study, and the occurrence of the Maillard reaction, which produces pyrazines, was high. Water activity is one of the many factors affecting the rate of the Maillard reaction. The maximum reaction can occur under low water activity conditions (Labuza and Saltmarch, 1981). The proportions of pyrazine and aldehyde ranged from 41%–58% and 32%–48%, respectively. The hydrocarbon content was the third most abundant, ranging from 10%–11%.
Carcass quality grade (1++, 1+, 1, and 2) was assessed according to Korea Institute for Animal Products Quality Evaluation (KAPE, 2017).
Lower grade (QG1 and QG2) striploin released more fatty and meaty flavor aldehydes and hydrocarbons (in AUs), such as 2- and 3-methyl butanal, hexanal, heptanal, nonanal, dodecane, and pentadecane, although the proportion of aldehyde groups was higher in higher quality grades (QG1++ and QG1+). The proportion of aldehydes increased as the QG (IMF content) increased. The fat content in emulsion systems and meat products slows down the release of polar volatile compounds, such as aldehydes, ketones, and alcohols (Jo and Ahn, 1999; Jo et al., 1999). Thus, the present results confirm previous findings (Jo and Ahn, 1999; Jo et al., 1999). Aldehyde is also one of the products of the Maillard reaction at high temperatures and is derived from the thermal degradation of unsaturated fatty acids, such as linoleic and linolenic acids (Elmore et al., 2004). Some aldehydes possess pleasant flavors, such as fatty, roasted meat, and an almond-like aroma based on olfactory analysis (Xie et al., 2008). Ba et al. (2012) found that the longissimus tissue of Hanwoo released high amounts of aldehydes. Furthermore, Frank et al. (2016) reported that the proportion of most aliphatic aldehydes increases as the polar lipid content increases. These results indicate that the major aldehydes from leaner striploins were mainly derived from lipid oxidation of muscle cell membrane phospholipids.
Among pyrazines, 2,5-dimethylpyrazine was the most abundant volatile in leaner striploin, comprising more than 30% of the total volatile compounds, followed by styrene, a hydrocarbon, which was remarkably higher than that of higher QGs. Pyrazines are generally the products of the Maillard reaction between free amino acids and reducing sugars (Yu et al., 2021). The flavor characteristics of pyrazines are roasted and nutty, and are mostly found in roasted beef, coffee beans and nuts (Mortzfeld et al., 2020). This suggests that the roasted aroma from aldehydes in lower-QG Hanwoo striploin was obtained from pyrazines. Mottram and Edwards (1983) reported that the amount of pyrazines is negatively associated with the presence of the lipid fraction in beef. Therefore, the present results are in line with those of previous reports. Hydrocarbons, which are the main products of the oxidation of polyunsaturated fatty acids through thermal degradation, were higher in leaner striploins. This can also be associated with the higher proportion of PUFAs in lower QG striploin than in higher QGs. Legako et al. (2015) and Hunt et al. (2016) reported that higher QG beef is associated with more neutral lipids (MUFA) than polar lipids (PUFA).
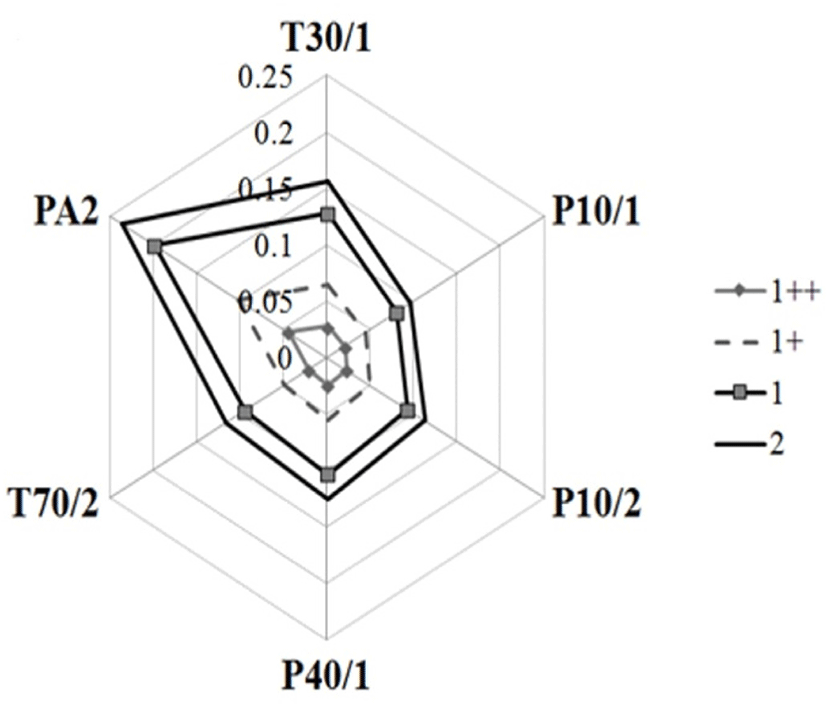
From electronic nose sensor data, the findings from gas chromatography can be associated with the highest intensity of beef volatile compounds released from the lowest QG group, wherein a significant proportion of pyrazines was observed. The sensor resistance ratios of the volatile compounds in the headspace derived from the heated samples are shown in Fig. 1. The resistance ratios of T30/1, P10/1, P10/2, P40/1, T70/2, and PA2 were significantly higher in the lower QG, indicating significant differences in the intensity of volatile compounds. The clustering is clear, indicating statistical discrimination (Utama et al., 2017). Among the volatile groups, aldehydes were positively correlated with the resistance ratio of the T30/1, P10/2, T70/2, and PA2 sensors, while hydrocarbons and pyrazines were positively correlated with the resistance ratio of all sensors (Table 4). Multiple regression models revealed that the combination of all volatile groups showed significant regression with the resistance ratio of each sensor (Table 5). However, each volatile group independently affected the resistance ratio of all sensors. Although the regression model is significant, the linearity or accuracy (0.57<r2<0.62) shows that the model is not good enough to predict the response of the sensor using the abundance of volatile groups.

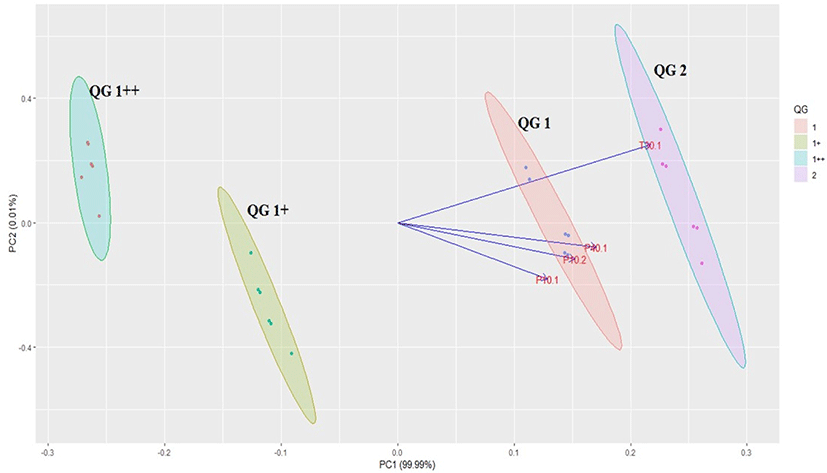
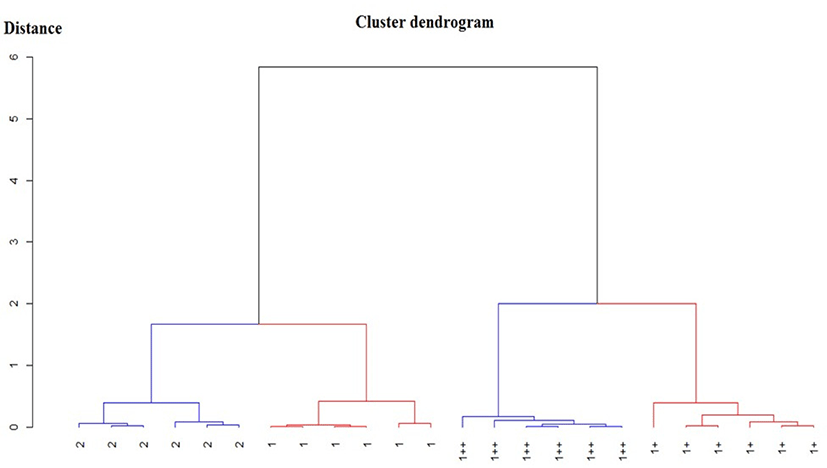
The PCA plot (Fig. 2) and cluster dendrogram (Fig. 3) revealed that the aroma profile differed according to QG. The loading plots and the resistance ratio of the sensors led to a group with a high intensity of volatile release. The aroma profile of striploin with different QGs was well-discriminated, indicating that marbling or the fat to lean muscle ratio affects the release of volatile compounds. However, the cluster dendrogram shows that the aroma profile between the higher quality grades (QG1++ and QG1+) and the lower quality grades (QG1 and QG2) is close to each other with a smaller distance than that between the higher QG group and lower QG groups.


Conclusion
The aroma profile of beef according to carcass QG can be discriminated using chemometrics approach. The higher the QG, the less abundant volatile compounds released from the beef. The chemometrics approach helps to confirm the effect of fat deposition on the differences in the aroma profiles of beef. The correlation between the sensor resistance ratio or the response of the electronic nose and the abundance of volatile compounds is strongly dependent on the intensity of the volatile compounds. Therefore, to predict the abundance of individual volatile compounds using the response of each sensor, pre-treatments, such as temperature adjustment prior to the extraction of volatile compounds, should be considered.


