


Introduction
Food poisoning can be caused by consuming food that is contaminated with pathogenic bacteria, parasites, viruses, or toxins (Dewey-Mattia, 2018). According to the Centers for Disease Control and Prevention (CDC; Dewey-Mattia, 2018), approximately 9 million people in the United States experience food poisoning each year due to contaminated foods. Of those, 3.6 million cases are attributed to bacteria, leading to 36,000 hospitalizations and 1,093 deaths annually (Dewey-Mattia, 2018). Major food poisoning outbreaks have been attributed to animal-origin foods (AOF), affecting approximately 4 million people annually (Painter et al., 2013). Therefore, research on methods for continuous monitoring of pathogenic bacteria in AOF is essential for ensuring food safety.
To ensure the microbial safety of AOF, a cold chain system is employed (Bassey et al., 2021). This system involves the transportation of food while sustaining a low-temperature environment, usually ranging between 2°C and 8°C. Maintaining a low temperature induces cold stress on microorganisms, leading to delayed growth and eventual death (Yu et al., 2023). Cold-stress reduces lipid bilayer fluidity, impairing membrane structural integrity and other cell membrane-related functions of bacteria (Bassey et al., 2021). Additionally, it leads to the increase of instability of RNA and DNA secondary structures, as well as the destabilization of cellular macromolecules, particularly ribosomes (Bassey et al., 2021). However, Listeria monocytogenes, a gram-positive, rod-shaped, non-spore-forming bacterium, can adapt to a wide range of temperatures (0°C–45°C; Yoon and Kim, 2022). Based on its high environmental adaptability, L. monocytogenes is commonly detected in foods such as meat and fish, unpasteurized milk, and ready-to-eat foods. It has the potential for contamination across various steps of food processing, distribution, and storage environments (Kramarenko et al., 2013). Consequently, L. monocytogenes has been reported to cause the highest hospitalization rate (91%) compared to other known foodborne pathogens in the United States upon infection (Dewey-Mattia, 2018). Thus, from the food safety standpoint, it is very important to understand metabolism of L. monocytogenes during cold-stress in managing its presence in refrigerated food such as AOFs.
Metabolomics could be used to investigate small molecules (<1.5 kDa) released from microbes for understanding their metabolic processes, both intracellular and extracellular (Aung et al., 2023). Intracellular metabolomics involves the study of metabolites within microbial cells that undergo changes during growth and differentiation. This encompasses metabolites located within mechanical barriers, cell membranes, or cell envelopes (Pinu et al., 2017). On the other hand, extracellular metabolomics explores metabolites that microbial cells secrete into the environment or culture medium (Pinu and Villas-Boas, 2017). Since extracellular metabolites are by-products of the intracellular metabolic activities of microorganisms, they can serve as indicators of microbial growth in specific environments, encompassing outcomes both intracellular and extracellular metabolism (Pinu and Villas-Boas, 2017). The metabolism of central carbon, energy production, amino acid supply, and protein synthesis varies depending on the microbial species and environment in which they grow (Chubukov et al., 2014; Kim et al., 2021). Especially, in foods like AOFs, changes in bacterial intracellular metabolism can result in modifications of various extracellular metabolites, affecting AOFs quality through alterations in parameters such as pH and amino acid composition (Kim et al., 2022a). Therefore, given the significant correlation between intracellular and extracellular metabolites (Pinu et al., 2017), measuring extracellular metabolites allows for a comprehensive understanding of both the microorganisms and the conditions of AOFs. In our previous study, we identified the presence, species, and quantity of pathogenic microorganisms by analyzing extracellular metabolites present in the media (Kim et al., 2022b). Moreover, the method of analyzing extracellular metabolites is easy compared with intracellular metabolites (Pinu and Villas-Boas, 2017). This approach, when applied to studying L. monocytogenes, could help to enhance the safety of AOFs by providing critical basic information at the point of the metabolic change of pathogens.
Therefore, we aimed to investigate the extracellular metabolite profiles in 3 strains of L. monocytogenes under cold-stress. Furthermore, we evaluated the change in metabolic patterns of L. monocytogenes during exposure to cold-stress. Finally, we attempted to introduce a new approach for identifying L. monocytogenes responses to cold-stress through the analysis of extracellular metabolites.
Materials and Methods
Tryptic soy broth, tryptic soy agar, Mueller Hinton broth, and 3-(trimethylsilyl) propionic-2,2,3,3-d4 acid (TSP) were purchased from Sigma-Aldrich (Mannheim, Germany). Perchloric acid and potassium hydroxide were purchased from Duksan Pure Chemical (Ansan, Korea). Deuterium oxide (D2O) was purchased from Eurisotop (Saint-Aubin Cedex, France).
The investigated L. monocytogenes strains (NCCP 15743, NCCP 16594 and ATCC 19111) were obtained as clinical isolates from the National Culture Collection for Pathogens (NCCP, Cheongju, Korea) and American Type Culture Collection (ATCC). Details of the clinical isolates of L. monocytogenes are provided in Supplementary Table S1. Each strain was preserved at –80°C in 40% (v/v) glycerol. For resuscitation, strains were cultured in 25 mL of tryptic soy broth and incubated at 37°C for 24 h. The cultures were then streaked onto tryptic soy agar places and incubated at 37°C for 24 h. The single colonies were transferred to Mueller Hinton broth and incubated at 37°C for 18 h. After incubation, the cultures were centrifuged at 3,000×g for 10 min. The pelleted cells were washed twice with saline solution and adjusted to an optical density of 0.1 at 600 nm to standardize the bacterial concentration. These cells were further diluted to a final concentration using a dilution factor of 1×10⁷ with saline solution. Finally, 0.1 mL of each diluted bacterial strain was introduced into 9.9 mL of Mueller Hinton broth to achieve an initial count of approximately 1 Log CFU/mL. Mueller Hinton broth without any inoculation served as the control (labeled M), while broths inoculated with L. monocytogenes strains NCCP 15743, NCCP 16594, and ATCC 19111 were labeled L5, L6, and L9, respectively. All samples were immediately placed in an 8°C incubator after preparation and incubated for up to 22 d. The temperature of 8°C was selected because it is a typical temperature used in domestic refrigerators (Roccato et al., 2015) and has been used in previous studies on meat storage under cold conditions (Kaur et al., 2021; Mataragas et al., 2006; Park et al., 2008; Sørheim et al., 1999).
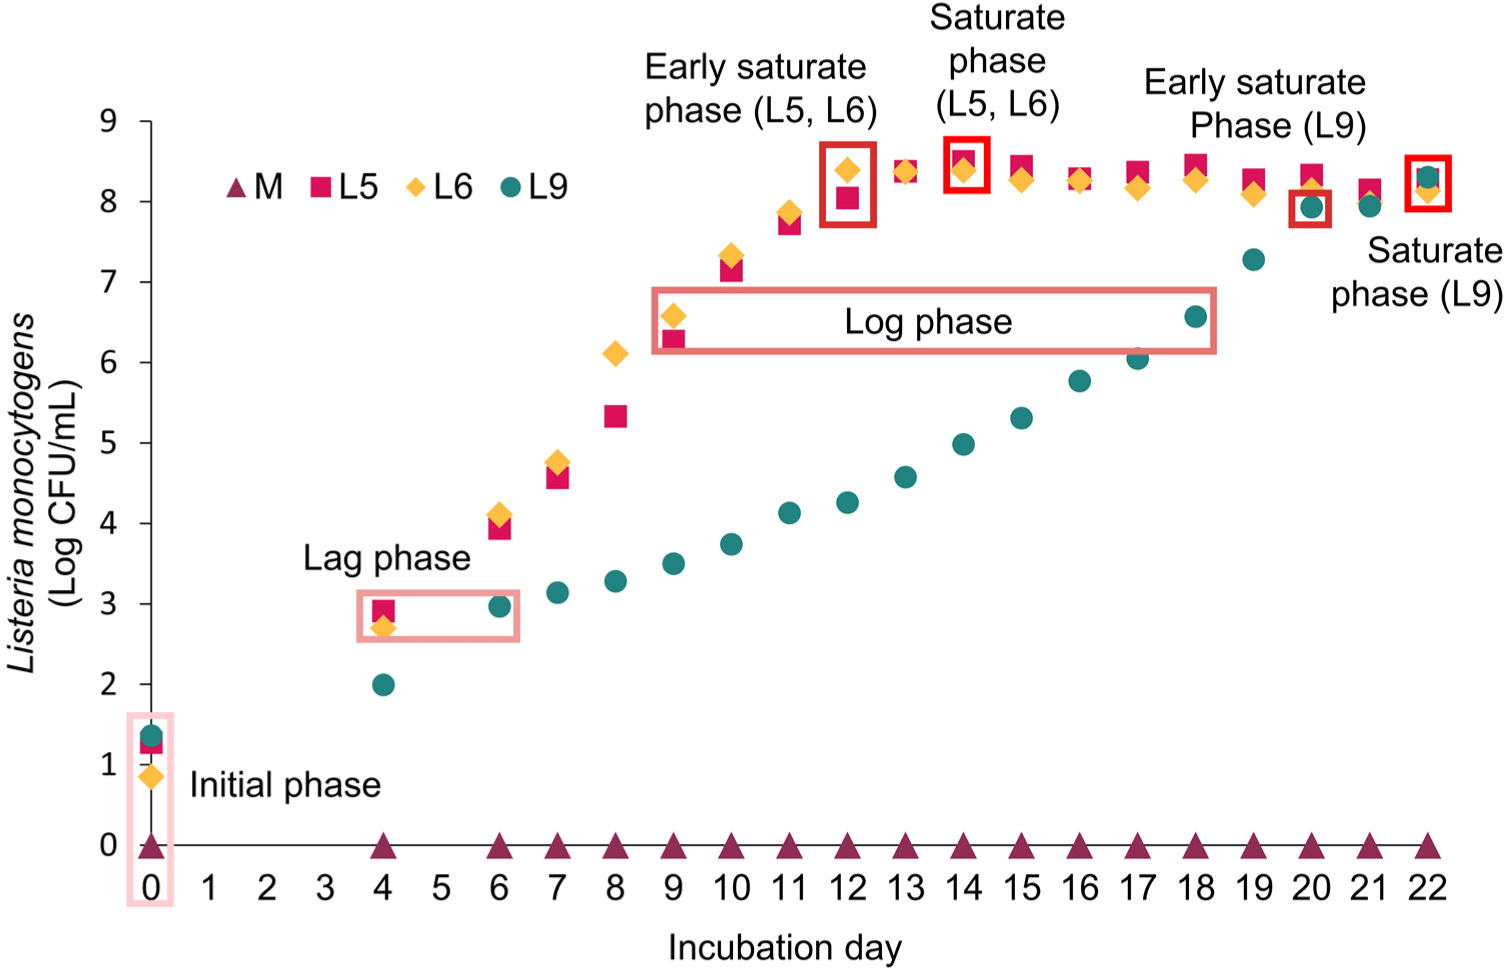
Microbial growth for each strain was measured at 24 h intervals, starting after the initial 5 d, with measurements replicated 3 times at each time point (n=3). The characterization of microbial growth phases (initial, lag, log early saturate, and saturate phase) was based on the growth curves (Willey et al., 2013). A microbial population reaching approximately 3 Log CFU/mL was identified as being in the lag phase, indicating adaptation to the culture medium. When the population reached approximately 7 Log CFU/mL during exponential growth, it was considered to be in the log phase. Completion of exponential growth marked the transition to the early saturation phase, and samples that remained in saturation for an additional 2 d were categorized as being in the saturation phase. Metabolites were extracted from all strains when they reached each designated growth phase (early, late, log supersaturated, and saturated phases), with extractions performed from 5 separate culture tubes prepared for each phase (n=5). Selected samples for metabolite extraction underwent centrifuged at 12,000×g for 20 min. The supernatant was then filtered through a 0.22 μm syringe filter (PTFE, Corning, NY, USA) and plated on a non-selective medium to ensure the absence of cells. The cell-free supernatant was then stored at –80°C until metabolite extraction.
The procedure for extracting polar metabolites was based on the method described by Kim et al. (2021). Initially, 5 mL of filtered media was combined with 5 mL of pre-cooled 0.6 M perchloric acid and vortex-mixed for 1 min. The mixture was then centrifuged (Continent 512R, Hanil, Incheon, Korea) at 3,000×g for 20 min. The supernatant was transferred to a new test tube and neutralized to a pH of 7.0 using 1 M potassium hydroxide. After neutralization, the sample was centrifuged again under the same conditions, filtered (Whatman No. 1, Whatman PLC, Buckinghamshire, UK), and subsequently lyophilized (Freeze Dryer 18, Labco, Kansas City, MO, USA) in preparation for nuclear magnetic resonance (NMR) analysis.
Polar metabolites were identified and quantified using an 850 MHz cryo-NMR spectrometer (Bruker BioSpin, Rheinstetten, Germany). The lyophilized extracts were reconstituted in 1 mL of D2O (20 mM phosphate buffer, pH 7.0) with an internal standard (1 mM TSP). The reconstituted samples were then warmed in a water bath at 35°C for 10 min. Following centrifugation at 17,000×g for 10 min, the supernatant was transferred into a 5 mm NMR tube for NMR analysis.
NMR spectra were acquired in D2O at 298 K using an 850 MHz cryo-NMR spectrometer. A modified standard zg30 pulse sequence (with a recycle delay of 1 s) was employed for one-dimensional 1H NMR analysis in Topspin 4.1.1 (Bruker). This sequence was executed with 64K data points, a sweep width of 17,007.803 Hz, and 128 scans. The chemical shifts (δ) were calibrated relative to the TSP resonance, and manual adjustments were made for baseline corrections. As described by Kim et al. (2021), metabolite identification utilized heteronuclear single quantum coherence (HSQC), correlation spectroscopy (COZY) and Chenomx deconvolution programs. The HSQC was conducted with 2 K data points in the t2 domain and 512 increments in t1, each with 8 and 32 scans, respectively. COZY were performed with 2 K data points in t2 domain and 256 increments in t1 with 8 scans. The spectral widths were set at 12.0016 ppm for the f2 dimension and 180.0045 ppm for the f1 dimension. A coupling constant value of 145 Hz was used to define the delay duration for the short-range correlations. Using 1 mM TSP as the internal standard, metabolite quantification was achieved. The following equation was used for quantifying the concentrations of metabolites:
Partial least squares-discriminant analysis (PLS-DA) was utilized as a multivariate analysis technique to optimize the separation between different groups (Allen et al., 2019). PLS-DA recognizes class labels and combines individual variates to reduce dimensionality (Allen et al., 2019). For extracellular metabolite results, the changing pattern of L. monocytogenes during the incubation period and metabolic differences between strains (L5, L6, L9) were confirmed using the PLS-DA model. Prior to conducting the multivariate and pathway analyses, the quantified data were subjected to a Log 10 transformation and autoscaling to normalize the distribution and scale of the variables. The differentiation in metabolic patterns observed over the incubation period and between the strains was further analyzed using orthogonal partial least squares-discriminant analysis (OPLS-DA; Galindo‐Prieto et al., 2014).
Pathway analysis was performed according to Xia and Wishart (2011), focusing on the comparison between the baseline (day 0) and each growth phase (lag, log, early saturate, saturate), respectively. The Human Metabolome Database (HMDB; www.hmdb.ca) ID of each metabolite was used, and the annotated metabolome pathway was cross-referenced with the Kyoto Encyclopedia of Genes and Genomes (KEGG) pathway database. Multivariate analysis (PLS-DA and OPLS-DA) and pathway analysis was performed on MetaboAnalyst 5.0 (www.metaboanalyst.ca). Significant differences in the identified metabolites were determined using the Tukey’s multiple range test, executed with SAS software (SAS 9.4, SAS Institute, Cary, NC, USA), with a confidence level set at p<0.05.
Results and Discussion
The three L. monocytogenes strains were cultured under the cold-stress conditions. All strains were initially inoculated at an average concentration of 1 Log CFU/mL. Throughout the duration of the cold-stressed culture, all strains proliferated and reached a concentration of 8 Log CFU/mL (Fig. 1). To assess the growth patterns of each L. monocytogenes strain across different phases, we identified five distinct phases (initial, lag, log, early saturation, and saturation) based on the L. monocytogenes growth curve (Willey et al., 2013). Initial phase refers to the inoculation period where the bacterial concentration is at or around 1 Log CFU/mL. Lag phase is the period following inoculation during which bacteria adapt to growth conditions but have not yet begun to proliferate, characterized by a slow or negligible increase in cell numbers (Willey et al., 2013). To investigate changes in extracellular metabolites during the lag phase, we cultured the bacteria until they reached a concentration of 3 Log CFU/mL. The growth patterns of L5 and L6 differed from that of L9. L5 and L6 reached the lag phase on day 4, however, L9 reached it on day 6. The log phase is characterized by exponential growth, with bacteria rapidly multiplying and the population size increasing significantly (Willey et al., 2013). Accordingly, we selected the 7 Log CFU/mL to profile the extracellular metabolites during log phase. L5 and L6 showed similar exponential growth, reaching about 7 Log CFU/mL on day 9. However, L9 was approximately 7 Log CFU/mL on day 18. As the resources become limited, the growth rate starts to decelerate (Willey et al., 2013), signaling the early saturate phase. L5 and L6 reached the saturation on day 12, while L9 reached it on day 20. To assess the impact of reaching saturation, we continued to cultivate the cultures for 2 d beyond the point of early saturation. In the log phase, doubling times of L5, L6, and L9 were 11.25, 10.15, and 20.37 h, respectively. Cordero et al. (2016) reported that the doubling time of L. monocytogenes at 8°C varied between strains (5–14 h). This finding is in line with previous results, where the doubling times of different strains (Scott A, CA, V37CE, and V7) of L. monocytogenes in skim milk were 12.5, 13.25, 14.25, and 10 h, respectively, when cultured at 8°C (Rosenow and Marth, 1987). The result demonstrates that each strain exhibits different growth patterns in media under cold-stress. Consequently, the extracellular metabolites were measured to confirm metabolic patterns according to the growth phase and population at day 0, 4, 6, 9, 12, 14, 18, 20, and 22.
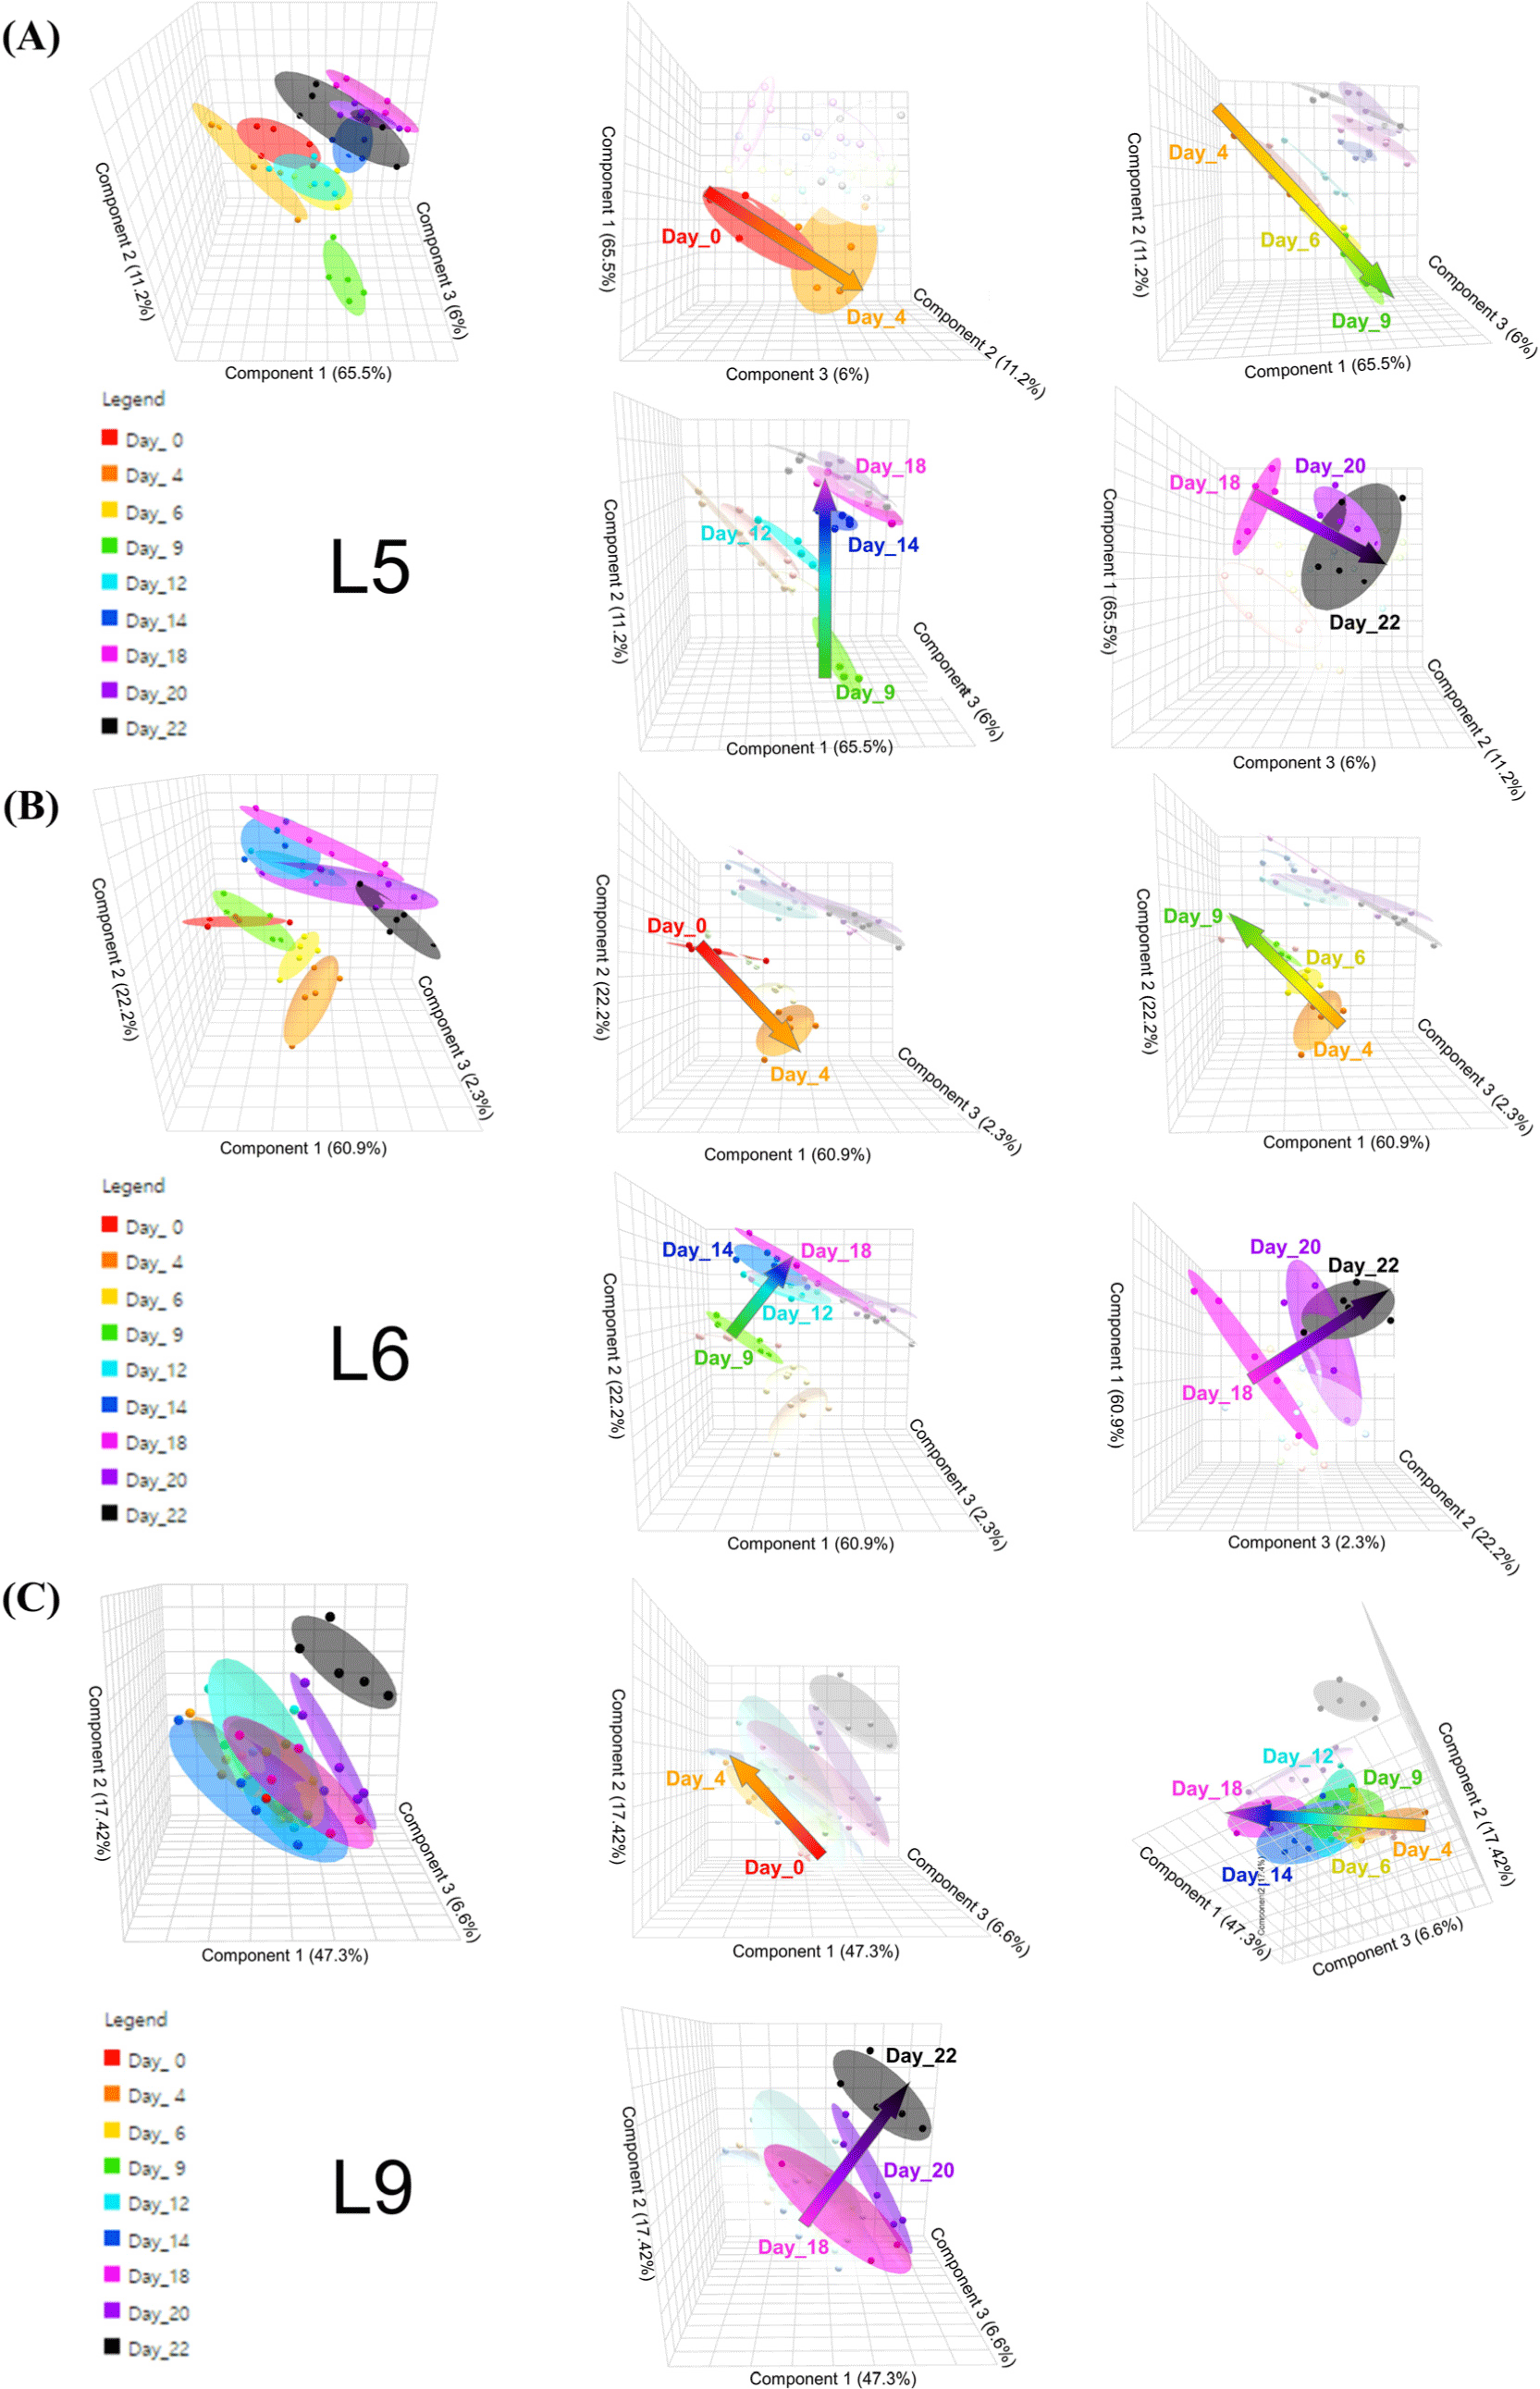
A total of 32 metabolites were identified and quantified (Supplementary Table S2). Although the metabolite profiles of the three strains showed similarities across all phases, the concentration of certain metabolites varied. The quantitative results of the analysed metabolites for each strain are presented in Supplementary Tables S3, S4, and S5. PLS-DA was employed to examine the trends based on these quantitative results (Fig. 2). Each strain exhibited distinct patterns over the culture period. In strains L5 and L6, the extracellular metabolite profile shifted along four vectors (day 0–4, day 4–9, day 9–18, and day 18–22; Figs. 2A and B), whereas this pattern was different in L9 (day 0–4, day 4–18, and day 18–22; Fig. 2C). These segments correlate with the growth phases observed in the growth curve (Fig. 1), suggesting that the alterations in metabolomic patterns were attributed to unique metabolic activities occurring within each growth phase (Robador et al., 2018). Similarly, Hain et al. (2008) reported that the stress response metabolism of L. monocytogenes was differentially regulated according to the bacterial growth phase.
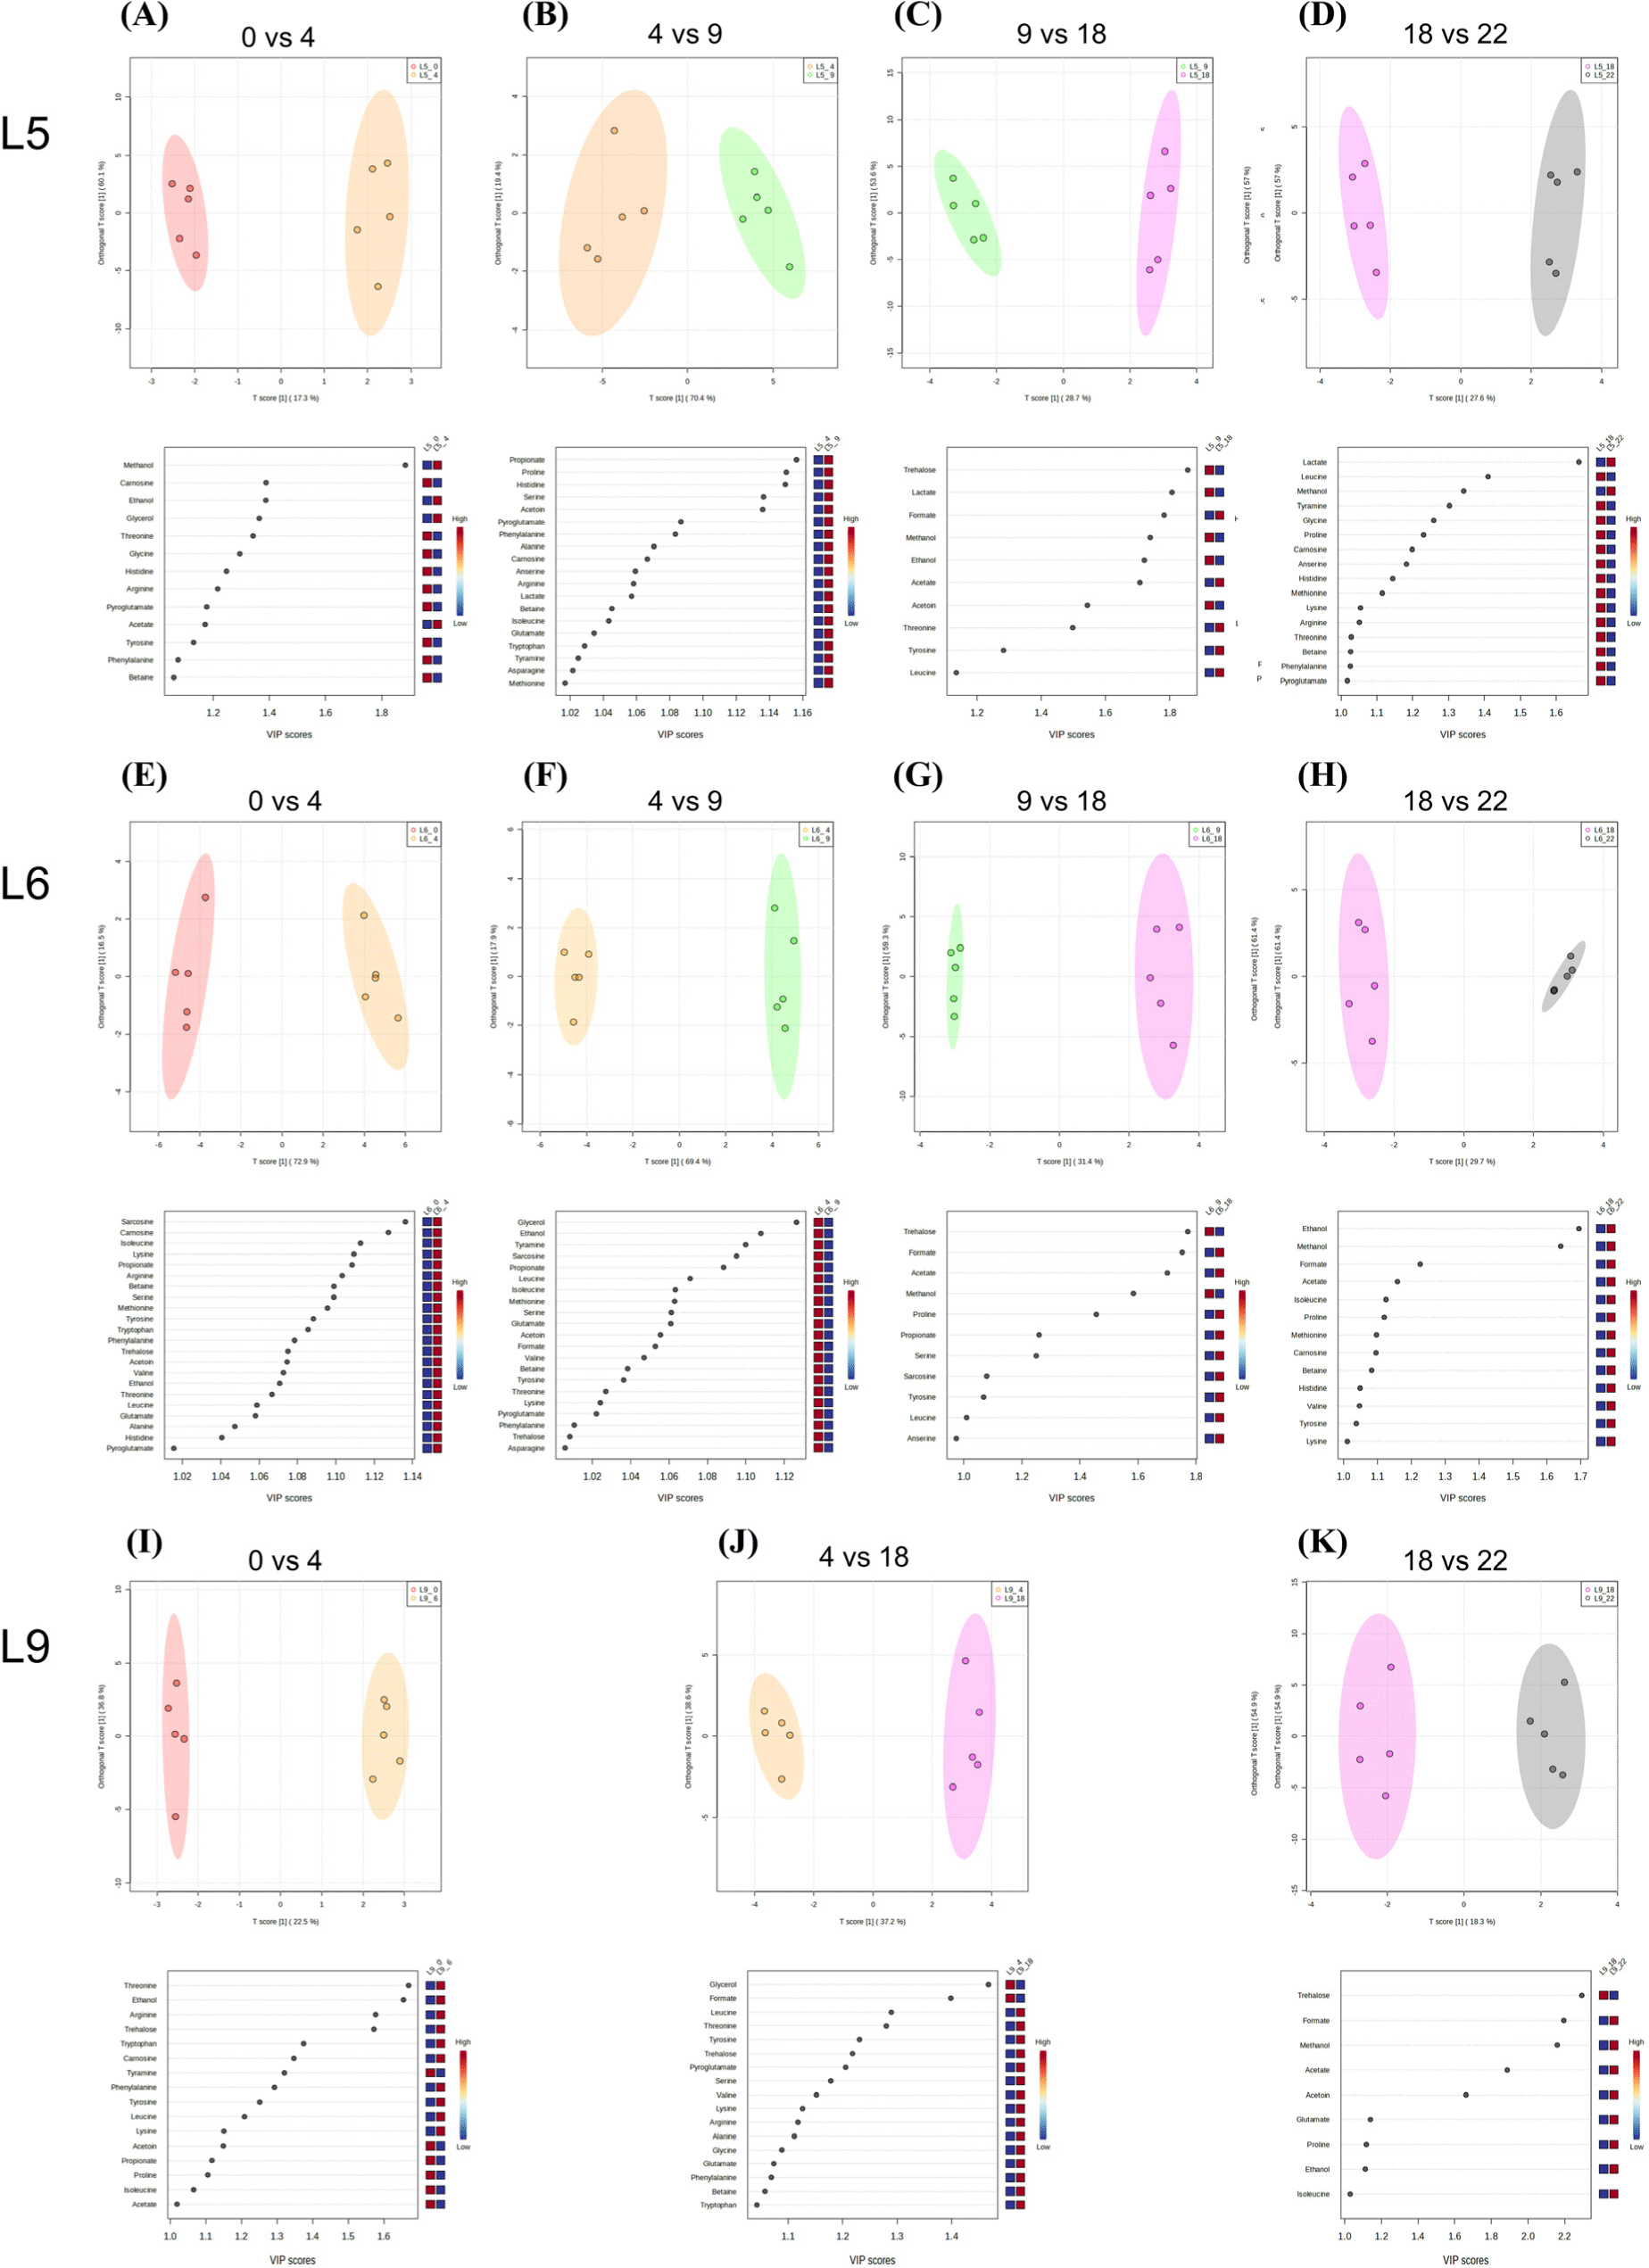
Common or unique metabolic patterns of L. monocytogenes strains (L5, L6, and L9) in the cold-stressed culture have been identified (Fig. 3). OPLS-DA was conducted between samples at the end of each vector and metabolites distinguishing each vector were expressed by their variable importance in the projection (VIP) scores (VIP>1.0). Metabolites such as arginine, carnosine, ethanol, phenylalanine, threonine, and tyrosine were identified in VIP score chart, discriminating the day 0 vs 4 vector across all three strains (Figs. 3A, E, and I), corresponding to the lag phase (Fig. 1). The day 4 vs 9 vector in L5 and L6 corresponded to period range from lag phase to log phase (Fig. 1). The day 9 vs 18 vector represented the range from log phase to saturation phase in L5 and L6 (Fig. 1). Meanwhile, L9 had the range of lag phase to log phase corresponded to the day 4 vs 18 vector (Fig. 3). Formate, leucine, serine, threonine, trehalose, and tyrosine were plotted in VIP score chart among the day 4 vs 9, day 9 vs 18, and day 4 vs 18 vectors (Figs. 3B, C, F, G, and J). The day 18 vs 22 vector was distinguished by methanol and proline for all three strains, which corresponded to the log phase (for L5, L6) and saturation phase (for L5, L6, L9). Thus, the change in metabolites in L. monocytogenes under cold-stress was characterized by different growth stages and strains.
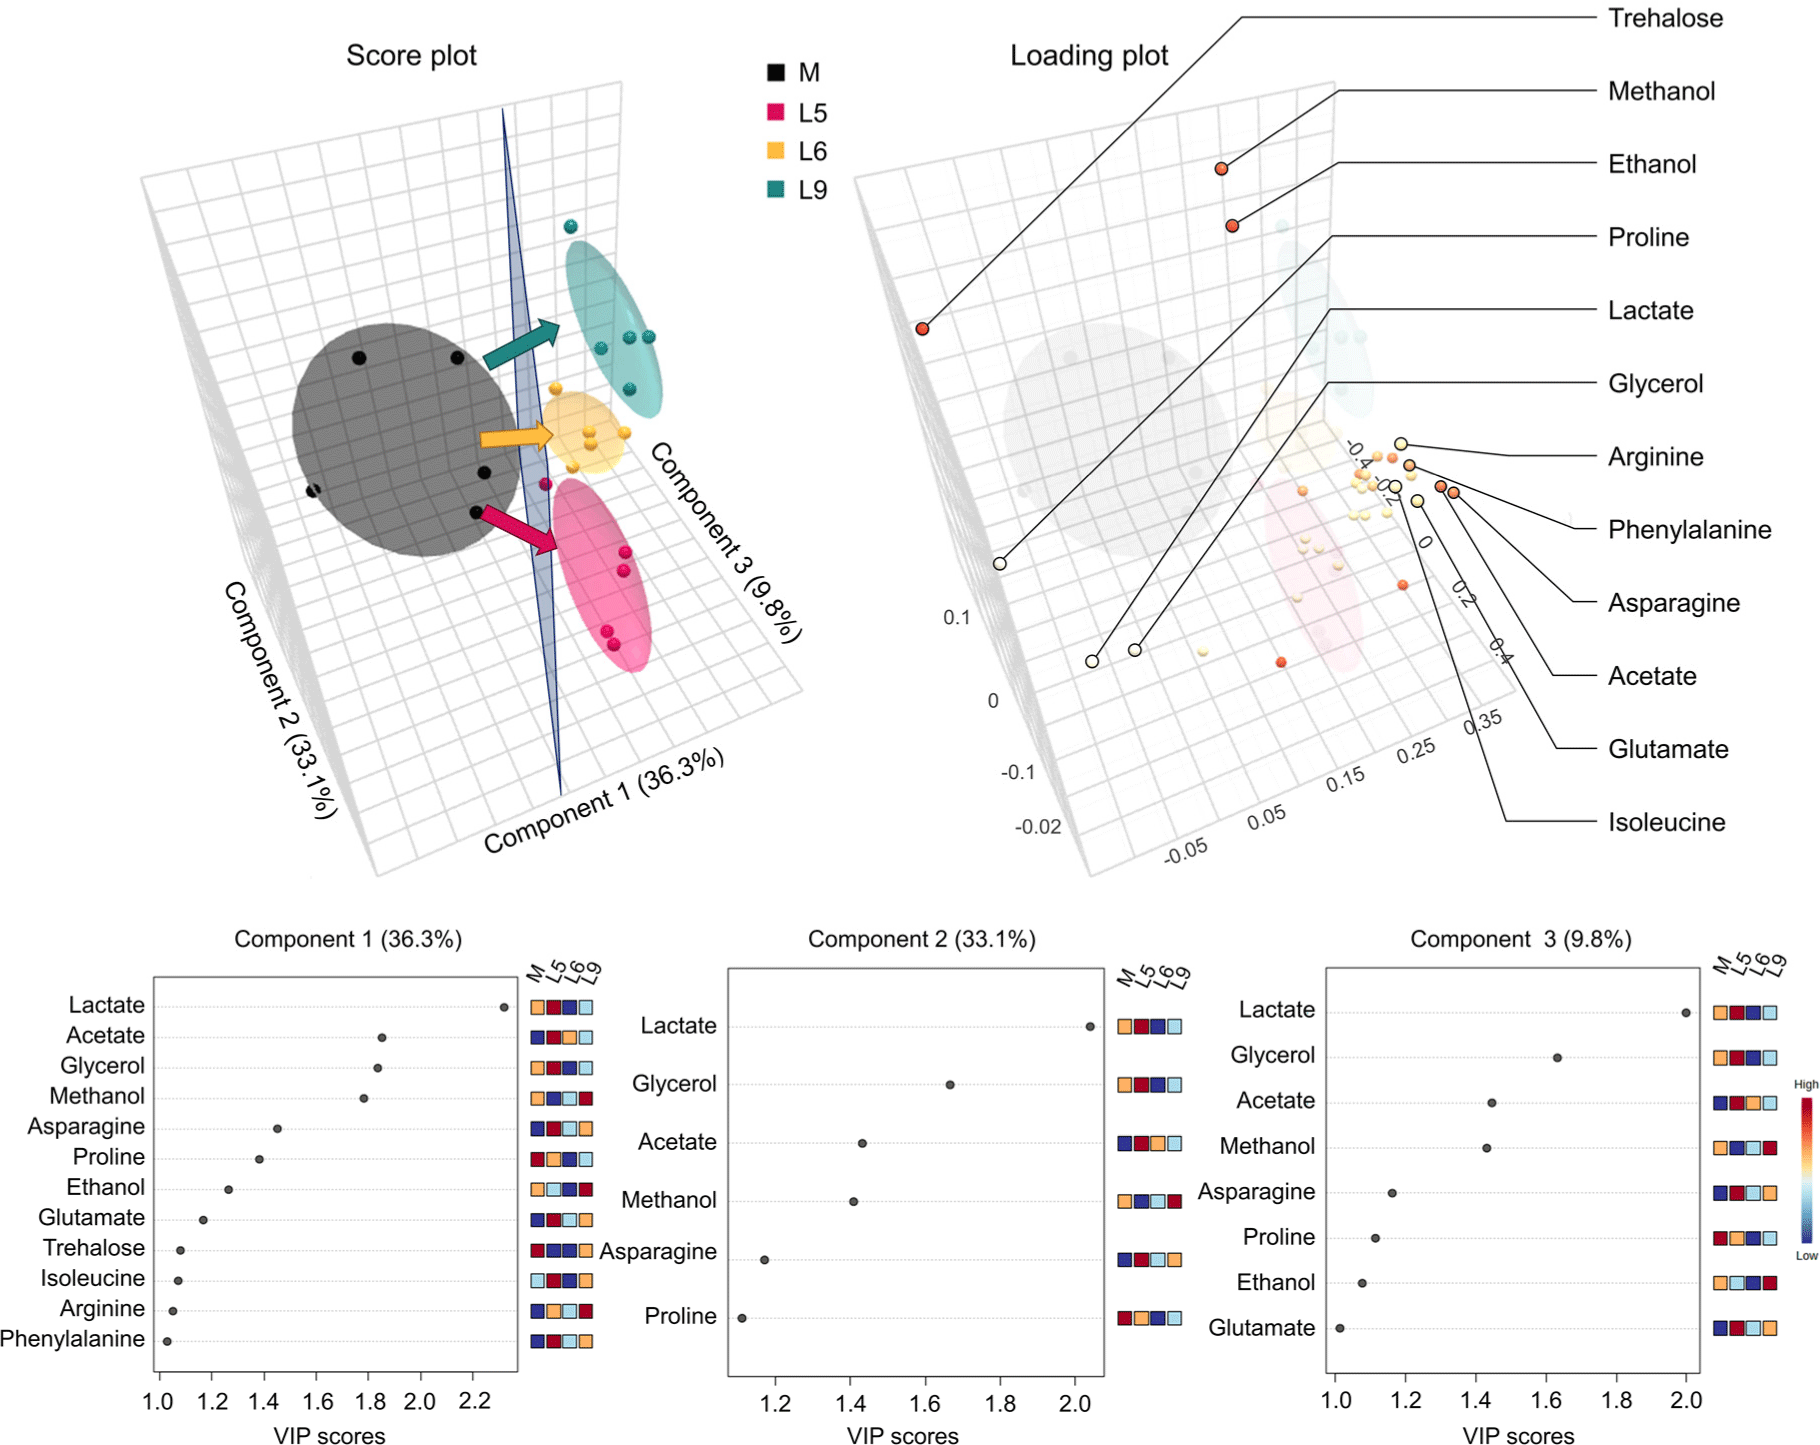
Metabolite profiling serves as a valuable tool for distinguishing between strains, similar to techniques like multiplex PCR, which is commonly used to distinguish L. monocytogenes serotypes (Doumith et al., 2004). In this study, PLS-DA was conducted to investigate the influence of different L. monocytogenes strains (L5, L6, L9) on extracellular metabolites under cold-stress, using samples from each strain at the saturated point (an additional 2 d following the attainment of a concentration of 8 Log CFU/mL). As shown in Fig. 4, component 1 effectively distinguished the un-inoculated sample (M) from all three strains. In contrast, differences among the strains were predominantly driven by components 2 and 3. Since trehalose, isoleucine, arginine, and phenylalanine were only found in VIP score plot of component 1, these extracellular metabolites may contribute to detecting the presence of every L. monocytogenes strain in this study. Meanwhile, the contents of lactate, glycerol, acetate, methanol, asparagine, proline, ethanol, and glutamate, which were used in component 2 and 3 (VIP>1), contributed to the differences among strains. Trehalose, a disaccharide composed of two glucose molecules, serves as an energy source through glycolysis and can resist oxidative stress by interacting with fatty acids featuring cis double bonds (Vanaporn and Titball, 2020). The essential amino acids (isoleucine, arginine, and phenylalanine) are employed as nutrients primarily for cell growth and metabolism (Sauer et al., 2019). Previous reports have suggested that isoleucine, arginine, and phenylalanine enhance the growth of L. monocytogenes (Sauer et al., 2019). Differences among L. monocytogenes strains may be due to their genomic diversity, which can lead to variations in metabolite production (Nightingale et al., 2005). As a result, trehalose, isoleucine, arginine, and phenylalanine significantly influenced the distinction between un-inoculated culture medium and L. monocytogenes inoculated (L5, L6, and L9) clusters, regardless of the strain. Meanwhile, lactate, glycerol, acetate, methanol, asparagine, proline, ethanol, and glutamate exhibited differential utilization based on the specific strains.
Metabolic pathway analysis was conducted using the 32 metabolites identified in L5, L6, and L9 strains, as shown in Fig. 5. This analysis verified the significant involvement of energy and glutathione metabolic pathways of L. monocytogenes in the cold-stressed culture. The marked metabolites identified in this study aligned with energy metabolic pathways, including carbohydrate metabolism (glycolysis/gluconeogenesis and glyoxylate, dicarboxylate metabolism, and pyruvate metabolism), propanoate metabolism, and methane metabolism (Fig. 5A). Specifically, carbohydrate metabolism and propanoate metabolism showed enhanced expression during the lag and log phases in all strains. Meanwhile, the expression of methane metabolism was enhanced during the early saturate and saturate phase. The increase in carbohydrate metabolism during the lag and log phases might be attributed to the adaptation to environmental stressors (Aertsen and Michiels, 2004). This adaptation might be due to metabolic reactions involving propionyl CoA, and changes in the fatty acid composition of the cell membrane (Rinehart et al., 2018). These changes might help the organism adjust to different nutrient levels and stress conditions (Rinehart et al., 2018). Most of glutathione-related metabolism, including pathways such as glutathione metabolism, D-glutamine and D-glutamate metabolism, arginine and proline metabolism, arginine biosynthesis, glyoxylate and discarboxylate metabolism, alanine, aspartate and glutamate metabolism, histidine metabolism, cysteine and methionine metabolism, and glycine, serine and threonine metabolism, showed enhanced expression during the lag and log phases in all strains (Fig. 5A). Meanwhile, sulfur metabolism was expressed more highly in the early saturate and saturate phases, indicating potential upregulation during later growth phases. Under cold stress, glutathione might show strong expression as it is used to degrade superoxide by glutathione peroxidase (Sibanda and Buys, 2022). The degree of expression was different for each strain (Fig. 5A). The energy and glutathione related metabolism exhibited strong expression at the lag phase of L6 and L9, while L5 at the log phase. This is because the stress response metabolism of L. monocytogenes is regulated differently depending on the bacterial strain (Hain et al., 2008). In L9, the overall metabolic expression level was lower than those of L5 or L6 (Fig. 5A), because its growth rate was slower (Fig. 1). Therefore, it was confirmed that energy metabolism and glutathione metabolism were primarily activated in L. monocytogenes during cold-stress.
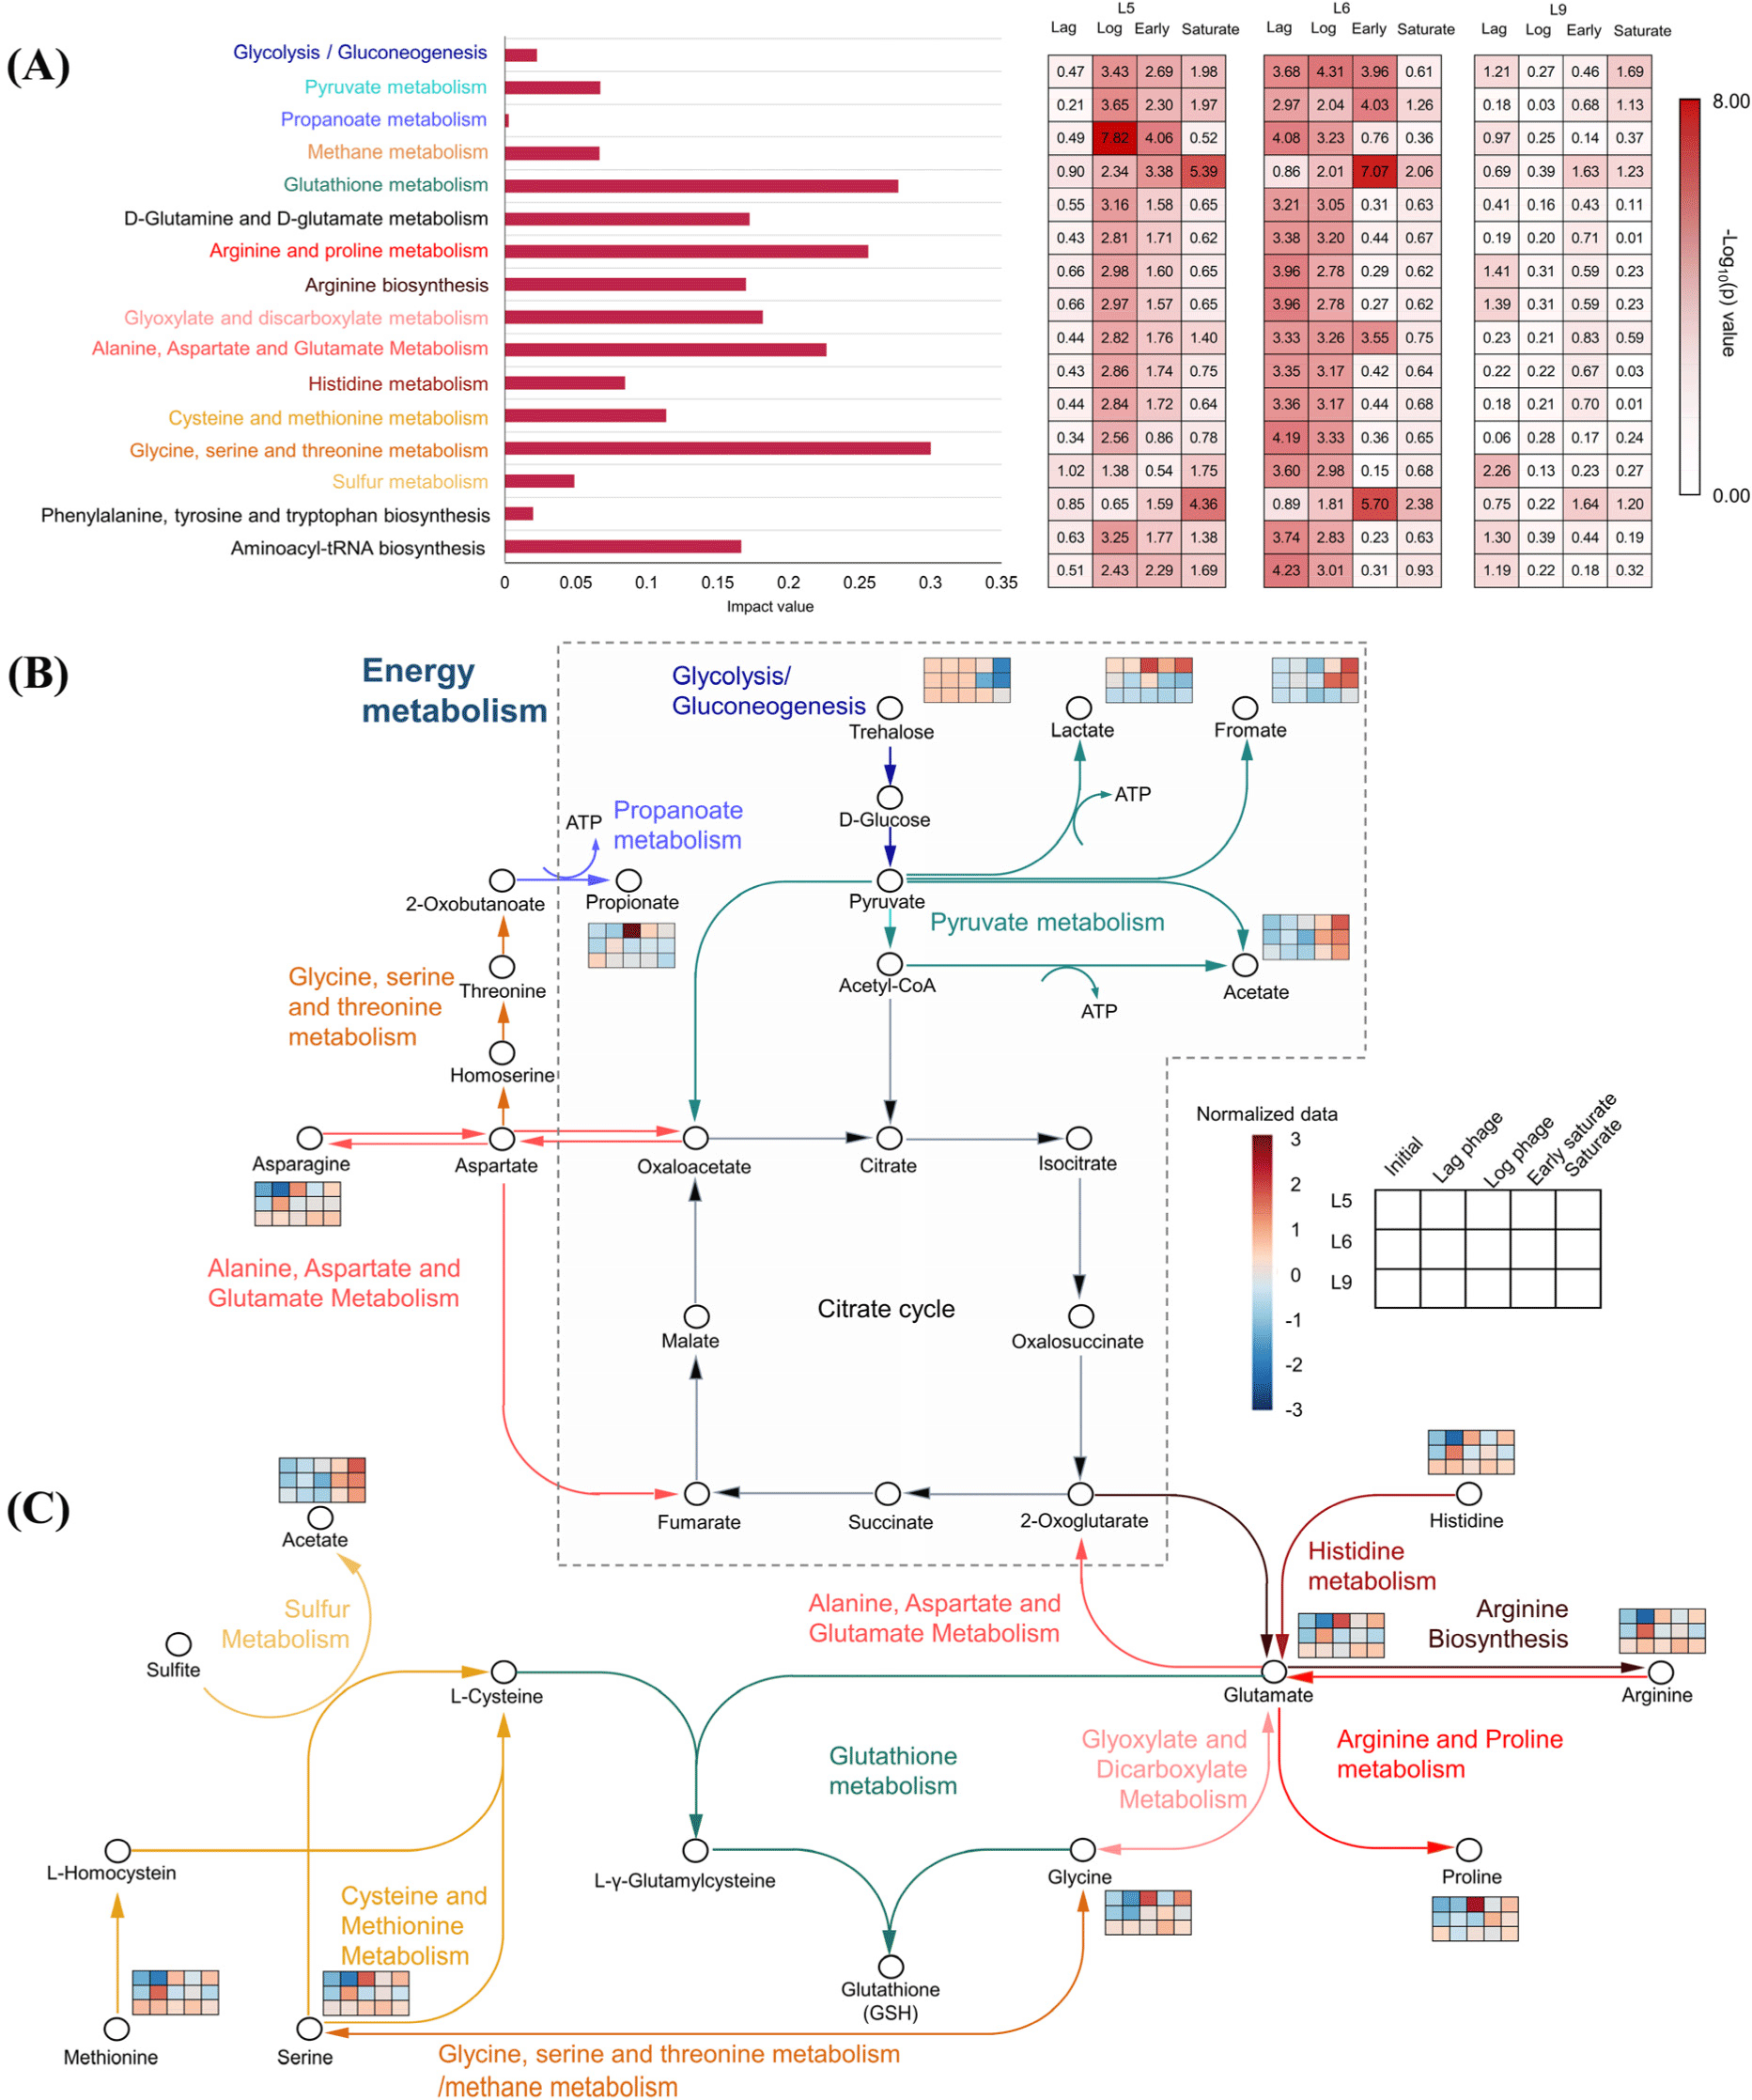
An overview of critical metabolic pathways and extracellular metabolites was created to examine the response of L. monocytogenes to cold-stressed culture (Figs. 5B and C). In the energy-related pathway, significant changes in trehalose, lactate, formate, acetate, and propanoate were confirmed during cold-stress (Fig. 5B, Supplementary Tables S3, S4, and S5). In all strains trehalose levels decreased, while formate and acetate increased as the cold-stressed culture period progressed. Lactate concentration was high in the log phase in L5 and L6, but no significant increase in L9 was observed in different phases during the cold-stressed culture (Supplementary Tables S3, S4, and S5). Propanoate was significantly higher in the log phase of L5, and in the lag phase of L6, while its concentration in L9 significantly decreased over the culture period (Supplementary Tables S3, S4, and S5). Trehalose, composed of two glucose units, is broken down into glucose molecules through glycolysis to be used for energy (Rinehart et al., 2018; Schär et al., 2010). From the breakdown of glucose, L. monocytogenes produces lactate anaerobically and acetate aerobically, deriving energy in the process (Garvie, 1980). Glucose obtained from trehalose breakdown could produce energy through pyruvate metabolism (Rinehart et al., 2018; Schär et al., 2010). 2-Oxobutanoate can be catabolized to propionyl CoA by propionate metabolism, and propionyl CoA is catabolized to propionate to generate ATP (Gonzalez-Garcia et al., 2017).
In this study, a rise in the concentration of distinct metabolites associated with glutathione metabolism was noted during the log phase in L5 and the lag phase in L6 (Fig. 5C). These metabolites encompassed metabolites related to glutamate production (histidine, arginine, and glycine), metabolites related to L-cysteine production (methionine and serine), and metabolites related to glutathione production (glycine). In addition, acetate, associated with L-cysteine production, demonstrated an increase during the cold-stressed culture. Glutathione plays a crucial role in maintaining redox homeostasis, protecting against reactive oxygen species (ROS), and donating electrons to reductases such as ribonucleotide reductase via NADH (Schmacht et al., 2017). The generation of ROS can stem from the conversion of mitochondrial energy (Tasara and Stephan, 2006), a process modulated by diverse antioxidative enzymes, such as superoxide dismutase, glutathione peroxidase, and glutathione reductase (Blagojevic et al., 2011). Cold-stress can induce ribosomal and mitochondrial damage, disrupting the balance of ROS in energy generation (Tasara and Stephan, 2006). Interestingly, L. monocytogenes demonstrates the capacity to both synthesize glutathione and acquire it from external sources (Sibanda and Buys, 2022), thereby aiding in the alleviation of oxidative stress. Subsequently, synthesis of L-γ-glutamylcysteine using glutamate, L-cysteine, and glycine leads to the production of glutathione (Asantewaa and Harris, 2021). Therefore, glutathione becomes vital for balancing ROS and enhancing stress resistance under cold-stressed conditions, highlighting its significance as a predominant pathway in L. monocytogenes.
While this study cultured L. monocytogenes in Mueller Hinton broth at 8°C to investigate its metabolic responses under cold stress, this medium does not fully replicate the complexity of actual meat environments or account for the influence of different temperatures on microbial metabolism. According to Kim et al. (2024), although Mueller Hinton broth includes beef extract, the nutrient composition can be compromised during the extraction and processing stages. Furthermore, their study found that L. monocytogenes grown in nutrient-preserving sterilized broth exhibited different intracellular metabolic profiles compared to those grown in Mueller Hinton broth (Kim et al., 2024). Additionally, Cacace et al. (2010) reported that varying temperatures can lead to different gene expression patterns related to stress responses and metabolic pathways, such as the upregulation of genes associated with glutathione metabolism at higher temperatures. Therefore, further studies are needed to investigate L. monocytogenes in actual meat and under various temperature conditions to better understand its metabolic responses in more realistic environments.
Conclusion
In conclusion, our study focused on the extracellular metabolites of three distinct strains of L. monocytogenes under cold-stressed culture. It was emphasized that the potential of extracellular metabolites examination as a tool for revealing metabolic alterations in L. monocytogenes during the cold-stressed culture. L. monocytogenes showed changes in the expression of energy metabolism-related metabolites (trehalose, lactate, propanoate, acetate, ethanol, and formic acid) and glutathione-related metabolites (acetate, histidine, arginine, proline, glutamate, glycine, serine, and methionine) during cold-stress. The differentiation among each strain (L5, L6, and L9) was confirmed by variations in the levels of lactate, glycerol, acetate, methanol, asparagine, proline, ethanol, and glutamate. Especially, the expression of energy and glutathione metabolisms significantly increased during the lag and log phases of L. monocytogenes growth under cold-stress conditions. This suggests that L. monocytogenes may enhance glutathione metabolism expression as a defensive mechanism in response to cold-stress. The observed changes in the metabolite profiles could be applicable in the food industry, particularly in the rapid detection of foodborne pathogens in cold chain system. In addition, the present results represent the fundamental and essential step toward achieving a holistic comprehension of L. monocytogenes metabolism under cold-stress, utilizing extracellular metabolites. However, to deepen our understanding, future research will need to include a broader range of bacterial strains and environmental conditions.