


Introduction
Beef is a source of high-quality protein containing essential amino acids, long-chain n-3 fatty acids, minerals, such as heme-iron, and vitamins in the human diet (Modzelewska-Kapituła et al., 2019). Holstein-Friesian (Holstein) cows are important dairy cattle raised to produce dairy and meat products. Similar to that of other livestock, Holstein meat is composed of various muscle types. Beef loin and ribs contain low connective tissue and high fat content, which correlate with better palatability, such as tenderness, juiciness, and flavor (Jung et al., 2016). However, beef round and chuck have a tough texture that can result in inconsistent tenderness in consumer, making them more suitable for low-cost ground meat, roasts, and steaks (Nyquist et al., 2018). Hence, meat containing less connective tissue, such as ribs, is more suitable for dry cooking, resulting in a tender texture without the shortening of contractile proteins and moisture loss (Herring and Rogers, 2003). However, in tough meat, such as beef round, cooking with water for an extended period slowly changes the texture from tough to tender through collagen dissolution and the reduction of inter-fiber adhesions (Baldwin, 2012). Therefore, a combination of moisture and long-term cooking methods can increase the tenderness and flavor of beef round.
Cooking is used to heat foods and improve its quality, palatability, and safety before consumption (Oz et al., 2017). When cooking meat, various changes occur, including protein denaturation, and alterations in color, structure, and the development of flavor compounds, which ultimately impart the final characteristics of the meat (Lorenzo and Domínguez, 2014). The cooking temperature and method are crucial factors that affect the quality and sensory characteristics of cooked meat (Lee et al., 2021). Cooking methods can be classified into moist, dry, and novel cooking, such as microwave and infrared heating and especially, moist cooking methods, such as boiling, sous-vide, and steaming, use hot water or steam to efficiently transfer heat to the meat surface (Chumngoen et al., 2018). Boiling is performed using relatively low-temperature water (~100°C) to preserve moisture and decrease the fat content (Chang et al., 2020). Sous-vide cooking is used to enhance product quality and shelf-life (Oz and Zikirov, 2015) and performed in a thermally-stable plastic vacuum packaging in a temperature-controlled water-bath, which can enhance heat flow and is accompanied by a low contamination rate and nutritional loss (Baldwin, 2012), making it suitable for tough meat. Microwave cooking is an innovative technology with food processing potential because of its efficiency, cooking time, and low energy consumption compared with that of traditional cooking methods (Wang et al., 2022). During microwave cooking, heat is transferred directly to the internal and external parts of meat through microwaving energy without the addition of liquid (Hu et al., 2022). Hence, microwave can effectively achieve uniform heating of thick material, reduce processing time, enhance the quality of products (Thostenson and Chou, 1999).
Meat flavor is an important organoleptic property, along with texture and appearance, and it influences purchasing decision of consumers (Jayasena et al., 2013). Boiling and sous-vide cooking generate fewer volatiles compared to dry cooking methods owing to the lack of an extremely dehydrating reaction on the meat surface as much as lead to the Maillard reaction (Ruiz-Carrascal et al., 2019). Nonetheless, moist cooking produces specific meat flavors owing to the effect of sulfur-containing heterocyclic compounds (such as thiophenes and trithiolanes), which contribute to boiled meat flavor through their low-odor threshold and meaty aroma (Jayasena et al., 2013). Similarly, during sous-vide cooking in which lipid oxidation is a major flavor-generating reaction, various types of volatiles are produced, and increased temperatures and extended cooking times can stimulate volatiles related to Strecker reaction (Roldán et al., 2015). Sous-vide cooking at mild cooking temperature also releases free amino acids (FAA) via the activation of proteolytic enzymes (Ruiz-Carrascal et al., 2019). In contrast, microwave cooking can accelerate protein hydrolysis and myofibril degradation, leading to the accumulation of FAA owing to the low degree of thermal reactions at temperatures limited at approximately 110°C (Wang et al., 2022). However, few studies have investigated comparing these cooking methods: boiling, microwave, and sous-vide cooking on meat quality and flavor compounds in Holstein beef round.
Thus, the objective of this study was to evaluate the physicochemical characteristics and flavor-related compounds in Holstein round meat cooked using different methods.
Materials and Methods
The dairy beef round (M. semimembranosus) meat (castrated males, 22 months old, 480±20 kg of carcass weight) was purchased from local market (Seoul, Korea) within 7 d post-mortem (Korean meat quality grade 2). The round meat was cut with uniform size (50×50×25 mm) and total 12 pieces of round meat was divided into four groups: raw meat and three different cooking methods; boiling, microwave cooking, and sous-vide cooking. All experiments were done in triplicate.
The dairy beef round was treated by three different cooking method. (1) Boiled beef round (BO); it was conducted in a domestic stainless pot with 5 times of distilled water and round meat at 100°C for 10 min. (2) Microwaved beef round (MW); it was conducted by a domestic household microwave oven (MW202LW, LG Electronics, Seoul, Korea) was used. One piece round meat was placed on the plate and cooked at 700 W for 80 s. (3) Sous-vide cooked beef round (SV); it was performed in temperature-controlled water-bath (JSWB-22T, Gongju, Korea). The round meat was vacuum sealed with polypropylene pouch and cooked at 60°C for 12 h. The core temperature of BO and MW was monitored using a digital cooking thermometer (HCP2, Habor Precise Industries, Zhejiang, China). All samples of BO and MW were completed when the internal temperature of meat reached 71±1°C.
Proximate composition of raw dairy beef round was determined according to the methods by Association of Official Agricultural Chemists (AOAC, 2012). The moisture and crude protein were conducted by 105°C oven drying, Kjeldahl method, respectively. The crude fat and crude ash contents were conducted by Soxhlet and 550°C furnace, respectively.
The collagen content was evaluated by measuring contents of hydroxyproline, according to the Kim et al. (2019). The 5 g raw dairy beef round was hydrolyzed using 30 mL 7 N sulfuric acid (105°C, 16 h). One milliliter acid hydrolyzed-diluted sample was mixed with 0.5 mL 1.41% chloramine T in the collagen buffer solution (pH 6.0) containing: sodium acetate trihydrate (90 g), sodium hydroxide (15 g), citric acid monohydrate (30 g), and 1-propanol (290 mL) per one liter of distilled water. The mixture was incubated (23°C, 20 min), then added 0.5 mL reactive color reagent (17.5 mL 60% sulfuric acid, 5 g 4-dimethylaminobenzaldehyde, and 32.5 mL 2-propanol) and incubated using water-bath (60°C, 15 min). Subsequently, absorbance was measured at 558 nm through a UV-VIS spectrophotometer (SpectraMax M2e, Molecular Devices, Sunnyvale, CA, USA). The content of hydroxyproline was obtained using a standard curve and then using a correction factor (8.0), and collagen content was calculated.
The 2 g of raw dairy beef round was ashed at 550°C to analyze the content of Fe, Ca, P, K, and Na. Subsequently, the ashed samples were dissolved in 65% nitric acid, transferred to volumetric flasks, and adjusted to 100 mL with distilled water, and then the mineral contents were analyzed using inductively coupled plasma optical emission spectrometer (Optima 7300 DV, Perkin-Elmer, Schwerzenbach, Switzerland).
To determine the pH of dairy beef round, 3 g sample was homogenized with 27 mL distilled water for 15 s through a homogenizer (Polytron PT-2500E; Kinematica, Lucerne, Switzerland) and then, pH was evaluated by Orion 230A pH meter (Thermo Fisher Scientific, Waltham, MA, USA), which was calibrated using pH 4.1 and 7.0 buffer before use.
Meat color of dairy beef round was measured by Chroma Meter CR-400 instrument (Minolta, Osaka, Japan) using CIE L*, CIE a*, and CIE b* after calibration the Chroma Meter using white plate references (Y: 93.60, x: 0.3134, y: 0.3194).
Cooking loss was obtained percentage of the difference between before and after cooking weights (Gajaweera et al., 2020).
Samples were prepared by cutting them into 2×1×2.5 cm pieces, measured by TA1 texture analyzer (Lloyd Instruments, Berwyn, IL, USA) with a Warner-Bratzler blade to obtain the Warner-Bratzler shear force (WBSF) value. The load cell of 500 N and a crosshead speed of 50 mm/min were used.
According to the methods of Chang et al. (2011), texture profile analysis (TPA) of dairy beef round was conducted. The samples were cut into 1.5×1.5×2.5 cm pieces and were analyzed using a TA1 texture analyzer (Lloyd Instruments) with a 5-mm-diameter aluminum cylinder probe. The experimental conditions were consisted of pre-test speed 10 mm/min, test speed 60 mm/min, compression ratio 75%, a rest time of 5 s between two cycles, and trigger force 20 gf. TPA parameters (hardness, springiness, gumminess, chewiness, and cohesiveness) were quantified by the software.
The FAA contents of dairy beef round were analyzed by Lee et al. (2019) with slight modification. The 2 g sample was homogenized (13,000 rpm, 30 s) with 27 mL 2% TCA solution, followed by centrifuging (17,000×g, 15 min). The supernatant was filtered with a 0.45 μm syringe filter and then analyzed by an amino acid analyzer (S433 A.A., Sykam, GmbH, Eresing, Germany). The condition was consisted of column size 4.6 mm i.d.×150 mm, lithium form resin, lithium citrate buffer (pH 2.9, 4.2, 8.0), flow rate 0.45 mL/min, and 0.25 mL/min for ninhydrin. The column temperature was 37°C, the reaction temperature was 110°C, and the analysis time was 120 min. The contents of the specific amino acids were determined from their respective absorption intensities which were calibrated to the known contents of amino acid standards.
The fatty acid composition of dairy beef round was conducted by Kim et al. (2019). The 2 g sample was homogenized with 15 mL Folch solution (2:1 mixture of chloroform and methanol, v/v) and 40 μL of butylated hydroxyanisole. Afterwards using Whatman No. 1 filter paper (Whatman, Maidstone, UK), the homogenates was filtrated and mixed with 4 mL 0.88% potassium chloride, vortexed, and centrifuged (196×g, 10 min). The lower part was condensed with nitrogen gas. A 30 μL lipid sample was obtained and mixed with 1.5 mL 0.5 N NaOH (in methanol) in glass tubes and heated (100°C, 5 min), then mixed with 2 mL 10% Boron trifluoride-methanol solution, and heated (100°C, 2 min). Two milliliters iso-octane and one milliliter saturated NaCl was mixed, samples were centrifuged (783×g, 3 min). The supernatant was injected into an Agilent 7890N gas chromatograph (Agilent Technologies, Santa Clara, CA, USA) equipped with an Omegawax 250 capillary column (30 m×0.25 mm×0.25 mm, Supelco, Bellefonte, PA, USA). The carrier gas, flow rate, and split ratio were He (99.99%), 1.2 mL/min, and 1:100, respectively. The analytical temperatures of the injector and flame ionization detector were 250°C and 260°C, respectively. The optimized column temperature program was as follows: initial temperature of 150°C, held for 2 min; a gradual increase in temperature to 220°C at a rate of 4°C /min, held at 220°C for 30 min. Each fatty acid was identified via matching its retention time with that of a respective standard using a commercially available mixture of fatty acids (PUFA No. 2-Animal Source, Supelco, Bellefonte, PA, USA).
Nucleotide content was analyzed according to Lee et al. (1984). The 5 g samples were mixed with 25 mL 0.7 M perchloric acid and homogenized (Polytron R PT-2500 E; Kinematica, Luzern, Switzerland), and then centrifuged (2,000×g, 15 min, 0°C), filtered using a Whatman No. 4. filter paper and the remained pellet was re-extracted under same condition. The supernatant was adjusted to pH 6.5 through 5 N KOH and placed in a volumetric flask and adjusted to 100 mL with 0.7 M perchloric acid (pH 6.5, adjusted with 5 N KOH). The mixture was centrifuged (1,000×g, 10 min, 0°C), the supernatant was filtered through a 0.22 μm syringe filter and analyzed by high-performance liquid chromatography (HPLC; Agilent 1260 Infinity, Agilent Technologies). The analytical conditions for HPLC included a Nova-pak C18 column (150×3.9 mm, 4-μm particles; Waters, Milford, MA, USA) eluting 1% trimethylamine · phosphoric acid (pH 6.5) at a 1.0 mL/min flow rate. Injection volume was 10 μL, and running time was 30 min. Column temperature was maintained at 40°C, and detection was monitored at a wavelength of 254 nm. Nucleotide content was determined from a standard curve obtained using the standards adenosine triphosphate (ATP), adenosine diphosphate (ADP), adenosine monophosphate (AMP), inosine monophosphate (IMP), inosine, and hypoxanthine (Hx; Sigma-Aldrich, St. Louis, MO, USA).
The volatile organic compounds (VOC) profile was analyzed by Lv et al. (2019). The volatile compounds were isolated by the headspace solid-phase micro-extraction method. The 5.0 g sample was put into a 20 mL glass vial and was incubated at 60°C for 25 min. Then, the fiber (DVB/CAR/PDMS—50/30 μm, needle length 1 cm, needle size 24 ga, Sigma-Aldrich) was exposed to the headspace for further 30 min.
GC/MS analysis was performed on an Agilent 8890 gas chromatograph coupled to an Agilent 5977B mass spectrometer (Agilent Technologies) and using a DB-5MS column (30 m, 0.25 mm i.d., 0.25 μm film thickness, Agilent Technologies). The carrier gas was He and flow rate was 1.3 mL/min. The liner (0.75 mm i.d.) was equipped the injection port. It was operated in the spitless mode for 5 min at 250°C. The oven temperature was maintained at 40°C for 5 min, programmed at 5°C/min to 250°C and held for 5 min. The interface temperature was set at 280°C. The mass spectrometer was operated in electron impact mode with the electron energy set at 70 eV and a scan range of 30–300 m/z (scan rate: 4.37 scans/s, gain factor: 1, resulting EM voltage: 1140 V). The temperature of MS source and quadrupole was set at 230°C and 150°C, respectively.
Identification of the compounds was conducted by comparing: (i) the linear retention index (LRI) based on a homologous series of even numbered n-alkanes (C8–C24, Supelco) with those of standard compounds and by comparison with literature data, and (ii) MS data with those of reference compounds and by MS data obtained from NIST 20 library (NIST/EPA/NIH Mass Spectral Library with Search Program) was used for the deconvolution of mass spectra and identification of target components. Values were expressed as the sum of the abundances of characteristic anions for each component (area×106). Flavor characteristics of VOC were searched from the database: Flavornet (http://www.flavornet.org/), FlavorDB (https://cosylab.iiitd.edu.in/flavordb/), and FooDB (https://foodb.ca/). VOC descriptor is given in brackets in the following discussion.
Sensory characteristics of dairy beef round were evaluated by 15 trained panelists who were provided with detailed information about the study trial. The cooked sample was served at 1×1×1 cm at a warm temperature, and after each sample, the panelists were provided with mouth-rinsing water and unseasoned cracker to eliminate any potential carry-over effect. According to 9-point hedonic scale, color, aroma, flavor, overall acceptability (1=extremely dislike, 9=extremely like), juiciness (1=extremely dry, 9=extremely juicy), and tenderness (1=extremely tough, 9=extremely tender) were evaluated. This process was approved by the institutional review board (IRB) of Kangwon National University (KWNUIRB-2021-05-003-001).
All analyses were performed three replications and data were expressed SEM. Statistical analysis was performed with SAS software v.9.4 (SAS Institute, Cary, NC, USA) using a one-way analysis of variance and Tukey’s test. The significant differences among means were considered as a value of p<0.05.
To identify the difference VOC of dairy beef round by cooking method, multivariate analysis was conducted by partial least squares-discriminant analysis (PLS-DA) and its variable importance in projection scores (VIP scores), using log-transformed and auto-scaled data through Metaboanalyst 5.0 (https://www.metaboanalyst.ca/) according to Lee et al. (2021). The validity of the PLS-DA model was verified using correlation coefficients (R2) and cross-validation correlation coefficients (Q2).
Results and Discussion
The moisture, protein, and ash contents accounted for 72.79%, 23.57%, and 1.19% of the total, respectively (Table 1). These results are similar to those of previous report on Semimembranosus muscle from Holstein cattle (Modzelewska-Kapituła et al., 2019). The crude fat content was 2.82% in our study, however, the cited authors reported fat contents 1.50% in Hanwoo and Holstein cattle, respectively. In contrast, some authors reported a similar tendency to our findings. For instance, select grade beef round had 2.68% fat content (Nyquist et al., 2018), while Australian beef round contained 1.7% and 2.0% fat in raw and cooked, respectively (Williams, 2007). The fat content in beef was influenced by various factors, such as genetic, feeding environment, and type of feed (Park et al., 2018). Regarding mineral contents, the raw meat contained 268.21, 85.98, 21.17, 4.48, 145.47, and 2.70 mg/100 g of K, Na, Mg, Ca, P, and Fe, respectively. Similar to other beef cuts, beef round contains high amounts of K, P, and Mg (Czerwonka and Szterk, 2015). Modzelewska-Kapituła et al. (2019) revealed that the mineral contents of raw Semimembranosus muscle of Holstein had higher K content and lower Na, Mg, Ca, and Fe levels than that in our outcomes. Compared with Australian beef from Williams (2007), the Ca content was similar; K, Mg, and P were lower; and Na and Fe were higher in our findings. The Fe content was similar to that of Holstein round meat from Czerwonka and Szterk (2015), whereas the Na content was higher, and K, Mg, and P were lower in our study. Valenzuela et al. (2009) reported a similar tendency where American beef round cut had the highest 55Fe percentage compared with that of other cuts, with a total Fe and heme Fe of 2.0 mg/100 g. Collagen, the most abundant protein in connective tissue, is defined as the ‘background toughness’ of meat and its characteristics, concentration, and architecture play an important role in raw meat texture (Li et al., 2022). Herein, the collagen content was 2.13 g/100 g, which is similar to the findings of Lee et al. (2009) and Gajaweera et al. (2020) who reported 1.84 g/100 g and 1.90 g/100 g of collagen in second grade Hanwoo round meat, respectively. However, Cho et al. (2007) reported 7.69 g/100 g of collagen in the round meat of third grade Hanwoo bulls.
The pH, color, and cooking loss of the beef round samples are listed in Table 2. The pH of raw beef round was 5.33 (data not shown), which is lower than that of Hanwoo (grade 1+) and Holstein round meat (pH 5.48 and 5.55, respectively; Kim and Jang, 2021; Kim et al., 2017). After cooking using the different methods, the pH of the round meat in this study ranged from 5.42–5.48. Cooking is known to increase the pH value by modifying the electric charge in the acid group, forming of new alkaline compounds, and separating peptide chains in general (Abdel-Naeem et al., 2021). The pH values for BO (5.42) and MW (5.43) were both very similar (p>0.05), whereas the highest pH value was observed in SV (5.48; p<0.05). This was contrary to the findings of Oz and Zikirov (2015) who reported that beef chops cooked in water at 95°C showed relatively increased pH values compared with those cooked in water at 75°C. Abdel-Naeem et al. (2021) reported a relatively lower pH value in roasted rabbit loin samples than in those that were microwaved and boiled and attributed this decrease to the short cooking time required for roasting. Therefore, cooking methods that use shorter cooking times, such as boiling and microwave cooking, result in a lower pH than in those cooked using the sous-vide method, as both boiling and microwave cooking may not provide sufficient opportunity for the pH to increase during cooking.
Meat color is an essential factor influencing meat product quality and consumer preferences. The raw round meat had 42.52 (CIE L*), 26.46 (CIE a*), and 14.84 (CIE b*) (data not shown). Both CIE a* and CIE b* were similar to those of Hanwoo round meat (grade 1+), whereas CIE L* was much lower than that of Hanwoo meat (Kim and Jang, 2021). Kim et al. (2017) reported lower CIE L*, CIE a*, and CIE b* in Holstein round meat than that in this study, which may be due to differences in slaughter age and meat grade. Meat color can be influenced by various factors including animal species, slaughter age, anatomical location of the muscle, fat content, and cooking condition (King and Whyte, 2006). Compared with that in raw sample, the color intensity of round meat was generally decreased by all cooking methods, except for the CIE L* of BO, which was higher than that of MW (p<0.05). This finding is inconsistent with that of Abdel-Naeem et al. (2021), who reported that microwaved rabbit meat had significantly higher CIE L* and lower CIE b* than boiled meat. Numerous literatures have shown that dry-heat cooking has been linked to decreased CIE L*, whereas meat cooked using the sous-vide and boiling methods have been associated with increased CIE L* (Oz et al., 2017). In this study, however, SV showed lower CIE L* than both BO and MW (p<0.05), which was similar to the findings of Rinaldi et al. (2014) who reported that beef cooked by sous-vide at 75°C exhibited significantly lower CIE L* and CIE a* than boiled beef. CIE L* is known to correlate with pH, with a lower CIE L* observed at high pH values in dry-aged beef (Kim et al., 2017). A similar trend was also confirmed in our study, SV had the highest pH and the lowest CIE L* (p<0.05), which might be due to its higher water-holding capacity at an increasing pH. The difference cooking methods had a significant effect on the CIE a* of round meat, with the lowest CIE a* observed in SV, followed by BO and MW (p<0.05). This remarkable decrease may be attributed to the denaturation of myoglobin, which leads to the formation of brown-colored ferrihemochrome and this denaturation typically occurs between 55°C and 65°C and is accelerated at 75°C or 80°C (King and Whyte, 2006). The low CIE a* of SV can be explained by the report of Baldwin (2012) who found that sous-vide slowly reaches the desired temperature and maintains it for a long time, resulting in a paler and less red meat. The CIE b* of all round samples was not significantly affected by the cooking methods. This result was similar with Nikmaram et al. (2011) who reported that cooking methods (microwave, roasting, and braising) were not significantly affected to the CIE b* of veal Longissimus dorsi.
Cooking loss has been considered key factor in the meat industry, as it can be accompanied by the loss of moisture and soluble nutrients (Pathare and Roskilly, 2016). Gajaweera et al. (2020) reported that the cooking loss of Semimembranosus muscles of Hanwoo steers of different carcass grades ranged from 33.86%–35.82%. The observed cooking loss in our result, which ranged from 28.32%–31.78%, was slightly lower than that of Gajaweera et al. (2020), which may be due to differences in breeds, intramuscular fat, and cooking conditions. The cooking methods had no significant effect on the cooking loss of round meat. However, BO showed relatively higher cooking loss than MW and SV (p>0.05). Modzelewska-Kapituła et al. (2019) reported a similar trend, in which a significantly higher cooking loss was observed in Holstein round meat cooked with steam than in meat cooked using sous-vide method. Abdel-Naeem et al. (2021) also demonstrated that boiling caused more cooking loss than microwave cooking in rabbit meat (p<0.05). Higher cooking loss may be associated with high cooking temperature, which causes denaturation of collagen and actin protein (it takes place above 60°C), shrinking the muscle fibers parallel to the fiber axis and squeezing out the water belonged in between fiber (Modzelewska-Kapituła et al., 2019). The lower cooking loss in SV may also be because of the effect of vacuumed plastic bags, which can prevent moisture evaporation (Baldwin, 2012).
The textural data of beef round meat samples are listed in Table 2. Meat tenderness is a critical factor associated with meat consumption and consumer satisfaction and is generally analyzed using panel tasting system or mechanical methods, such as the WBSF and TPA (Pathare and Roskilly, 2016). The cooking methods greatly influenced the WBSF value of round meat (p<0.05). BO had a significantly higher WBSF value (87.46 N) than MW (70.56 N) and SV (49.57 N). Gajaweera et al. (2020) and Kim and Jang (2021) reported that second and 1+ grade of Hanwoo round meat had WBSF value of 51.29 N and 60.12 N, respectively. In present study, however, both BO and MW had a higher WBSF value than that of those Hanwoo cattle, which may be due to difference species in cattle breeds. Modzelewska-Kapituła et al. (2019) reported that beef with a WBSF value ranging from 32.96–42.77 N is considered tender, those with a WBSF value ranging from 42.87–52.68 N is acceptably tender. Herein, only SV met the criteria for acceptable tender meat. Considering the effect of cooking method on WBSF value, Modzelewska-Kapituła et al. (2019) reported a similar trend that sous-vide cooking significantly decreased the WBSF value of Holstein Semimembranosus muscle compared with that cooked using the steam cooking. This decrease in the WBSF value in SV compared with that in other cooking methods, may be attributed to the activation of collagenase and the unfolding of the collagen helix, which allows for additional proteolysis (Powell et al., 2000). Meanwhile, the higher WBSF value of BO than that of MW can be explained by the findings of Abdel-Naeem et al. (2021), who reported a higher WBSF value and cooking loss in boiled rabbit meat than in microwaved meat, which may be due to a rapid increase in temperature that causes muscle tenderness through not only muscle fiber and collagen granulation but also myofibrillar structural disruption.
TPA provides the effect of heat treatment on textural changes in meat, which are typically expressed as indices, such as hardness and cohesiveness (Chang et al., 2011). The different cooking methods significantly affected the hardness, gumminess, and cohesiveness of round meat. Similar to the WBSF results, BO had a significantly higher hardness than SV and slightly higher than MW (p>0.05), which indicated that BO may require more force to attain meat deformation. Chang et al. (2011) reported a similar trend between beef Semitendinosus muscle cooked using the microwave and a water-bath (65°C–90°C); however, the higher hardness was observed in water-bath cooking ranging from 50°C–60°C. Microwave cooking can easily cause dehydration of the meat surface, which is responsible for the weakening of the crosslinking effect of macromolecules, such as meat proteins, resulting in decreased hardness (Hu et al., 2022). The SV had a significantly higher effect on gumminess than BO, whereas the gumminess of MW was between that of SV and BO, which was opposite to the trend of hardness. The gumminess is the energy obligatory to crumble semisolid foods to a state prepared for swallowing and is associated with foods with a low hardness index (Novaković and Tomašević, 2017). Cohesiveness is known to contribute to a comprehensive understanding of viscoelastic characteristics, such as tensile strength (Chang et al., 2011). The MW resulted in a significantly higher cohesiveness in round meat than BO in which the cohesiveness in round meat was slightly higher than that of SV. Although both springiness and chewiness were not significantly affected by the cooking methods, MW showed relatively higher chewiness, followed by SV and BO.
In total, 26 different FAA were detected, most of which were significantly decreased after cooking (Table 3). MW resulted in higher tendency for total FAA among the cooking methods. According to Wang et al. (2022), microwave cooking can cause protein hydrolysis and penetrate proteins, causing myofibrilla disruption and, resulting in more FAA. Although the same cooking medium was applied to both the BO and SV process, SV tended to have a higher total FAA content. The probable cause of this trend might be that BO directly contacts water, causing more cooking loss, as well as the exudation of water-soluble FAA to the cooking medium. Pereira-Lima et al. (2000) reported that more FAA was observed in beef broth cooked at 95°C than that in 85°C when cooked for 15 min. Carnosine and anserine are peptides associated with a bitter taste in meat (Dashdorj et al., 2015) and are abundant in meat cooked using all cooking methods, as well as in raw meat. Carnosine levels reduced by more than 50% after cooked by all cooking methods than that in raw meat (p<0.05). Nevertheless, MW resulted in a higher carnosine content tendency in round meat, whereas a lower tendency was observed in beef cooked using both moist cooking methods. Peiretti et al. (2012) reported that carnosine content was considerably decreased in boiled beef compared with that in microwaved beef because carnosine has high water-solubility characteristics, making it easily transferred from meat to broth, and microwave cooking can produce a hard surface layer on meat, which prevents carnosine degradation. The anserine content of round meat decreased by all cooking methods (p<0.05). Anserine was considered as an important flavor contributor to beef broth than carnosine (Pereira-Lima et al., 2000). Similar to the trend for carnosine, MW resulted in higher remaining anserine content, followed by BO and SV (p>0.05). Glutamic acid and aspartic acid are related to the umami taste (Kim et al., 2017), which was described as the umami score in this study. The umami score was higher for SV than for MW and BO (p<0.05). The high concentrations of glutamic acid and aspartic acid in SV compared with those in BO may be attributed to the preservation effect of sous-vide condition on the loss of moisture and soluble nutrients. Rotola-Pukkila et al. (2015) demonstrated that relatively lower glutamic and aspartic acid levels were existed in pork meat compared with those in its cooking juice cooked at both 70°C and 80°C. Sulfur-containing amino acids, such as methionine can produce a meat-like sweet flavor, and both L-phenylalanine and L-tyrosine play a vital role in improving the umami/savory taste when free acidic amino acids are present (Dashdorj et al., 2015). Herein, SV had higher amounts of methionine, tyrosine, and phenylalanine than MW and BO (p<0.05). Bitter and acidic FAA contents remained higher in SV than in those cooked by other cooking methods, whereas sweet FAA content of SV was higher than that of BO (p<0.05) but was not different with MW. Nevertheless, several significantly abundant FAA in SV, such as branched-chain amino acids, tyrosine, and phenylalanine belong to the bitter taste FAA family, which may have undesirable effects on the flavor of round meat (Dashdorj et al., 2015).
The cooking methods caused changes in most fatty acid compositions in the beef samples (Table 4). Oleic acid was the most abundant fatty acid in BO, MW, and SV, followed by palmitic acid. This phenomenon was in accordance with the findings of Badiani et al. (2002), who reported a similar trend in fatty acids composition in beef round cooked through roasting and microwave cooking. Alfaia et al. (2010) identified that the majority of fatty acids in Longissimus lumborum muscles of Alentejano purebred bulls cooked through boiling and microwave cooking showed similar compositions between the two cooking methods. In contrast, in our findings, BO and MW showed significantly different compositions of most of the detected fatty acids, which might be attributed to the different breeds, meat sources, and cooking methods. Beef round has a higher iron content than other beef cuts, such as loin, which can act as an important oxidation promoter despite being cooked using the same methods (Kim and Jang, 2021). SV had a significantly higher oleic acid, followed by MW and BO, suggesting that its content could be significantly changed through various cooking methods. Vaccenic acid is a conjugated linoleic acid that plays a key role in human health (Alfaia et al., 2010). Herein, dry-heat (MW) more effectively resulted in vaccenic acid production than moist heat (BO and SV) during cooking. Alfaia et al. (2010) demonstrated that the higher levels of vaccenic acid were present in beef Longissimus lumborum muscle cooked through grilling, followed those cooked through microwave cooking, and boiling (p>0.05). MW had a higher unsaturated fatty acid (UFA) and polyunsaturated fatty acid (PUFA) content than BO and SV (p<0.05). This trend might be affected by the higher linoleic and arachidonic acid content in MW. In contrast, SV had more monounsaturated fatty acids (MUFA) than those cooked using the other cooking methods (p<0.05), which may be due to the higher amount of some MUFA, such as palmitoleic acid and oleic acid, in SV than those of BO and MW (p<0.05). Higher oleic acid and MUFA contents are positively associated with organoleptic characteristics (Kim et al., 2019); therefore, SV may provide a better beef flavor than MW and BO. Additionally, the American Heart Association recommends that the SFA:MUFA:PUFA ratio be approximately 1:1.5:1 and MW was similar to that of the recommended ratio compared with BO and SV. Therefore, MW may be considered more suitable than the other cooking methods because of its nutritional advantages. Furthermore, the polyunsaturated fatty acid/saturated fatty acid (PUFA/SFA) ratio can be used to evaluate the nutritional quality of meat fat and more than 0.4 to 0.5 is recommended (Kim et al., 2019). Herein, higher and lower PUFA/SFA ratios were observed in the MW and SV, respectively (p<0.05). Consequently, fatty acid analysis indicated that the SV had better sensory properties than the other groups, whereas MW was more proper cooking methods to achieve higher nutritional value.
Cooking significantly altered the nucleotide content in round meat (Table 5). During meat breakdown, ATP is converted into ADP, AMP, and IMP, which contribute to meat flavor, and IMP is further broken-down into inosine, which can be converted into Hx, resulting in a bitter taste (Dashdorj et al., 2015). The inosine and Hx contents were higher in SV and lower in BO, respectively (p<0.05). The significantly higher concentration of inosine in SV may be thought as an indicator that a higher decomposition of IMP occurred in SV than that in BO and MW. The degradation and reaction of non-volatile compounds, such as nucleotides and FAA, can be influenced by cooking conditions, resulting in a variety of tastes and aromas in meat (Rotola-Pukkila et al., 2015). However, MW showed a significantly higher IMP content than BO, which may be attributed to the water-solubility properties of nucleotide compounds, including IMP (Dashdorj et al., 2015). Hence, a relatively higher amount of IMP could be released from meat into water when cooked using BO and SV compared with that using MW. The AMP content was significantly higher in both BO and MW than that in SV, similar to the trend observed for IMP. As explained by Dashdorj et al. (2015), AMP contributes sweet taste at low concentrations (50–100 mg/100 mL) and works synergistically with IMP to elicit an umami taste. Therefore, BO and MW, which contained high concentrations of IMP and AMP, had more umami and sweet intensities in terms of nucleotide-related taste compared with that of SV. However, Rotola-Pukkila et al. (2015) revealed that cooking temperature did not significantly affect IMP content, whereas AMP content increased significantly in both pork meat and cooking juice, when cooked at 80°C compared to those cooked at 60°C. Thus, higher cooking temperatures, such as BO and MW, tended to increase AMP content, whereas cooking at lower temperatures, such as SV, tended to decrease AMP content during cooking. In contrast, the lower IMP content and higher inosine content of SV might be attributed to the influence of the enzymatic system, in which IMP could be reduced during heating (above 40°C) and decomposed to inosine by the temperature-dependent IMP decomposition enzyme (Ishiwatari et al., 2013). Therefore, the low temperatures during SV did not allow opportunity to completely inactivate those enzyme activities compared with that during MW and BO. Regarding ATP and ADP contents differences between cooking methods, MW had the highest content of those compounds, followed by BO and SV (p<0.05); ATP was not detected in SV. ATP can rapidly decrease after slaughter or by enzyme degradation, such as ATPase and ADP deaminase, resulting in intermediate compounds, such as ADP and AMP (Dashdorj et al., 2015). In our findings, MW and BO may have deactivated these degradation enzymes at higher temperatures, similar to the trend of IMP, whereas SV could not eliminate such enzymes, resulting in less adenosine compounds.
Flavor is a complex organoleptic property mainly consisting of taste and aroma. Raw meat only has bloody and metallic flavors, whereas cooked meat contains numerous VOC generated by complicated reactions (Sohail et al., 2022). VOC can be classified into several groups, such as acids, alcohols, and aldehydes, which all can play a role in specific meat flavors (Bassam et al., 2022). In total, 132 VOC were identified and grouped into hydrocarbons (50), aldehydes (31), alcohols (21), esters (9), ketones (7), acid (7), and other compounds (7) (Table 6). Ester represented a large VOC group in raw meat (Fig. 1A), which is consistent with the results of Lorenzo and Domínguez (2014), who reported that fresh foal meat had the highest ester composition, which was also reduced after cooking. However, Rasinska et al. (2019) showed that esters were not the most abundant VOC in raw rabbit meat. Although various hydrocarbons were detected (Table 6), their compositions ranged from 10.73%–20.91% in cooking groups. Alcohol and aldehyde levels increased during cooking and were high in SV and MW, respectively.
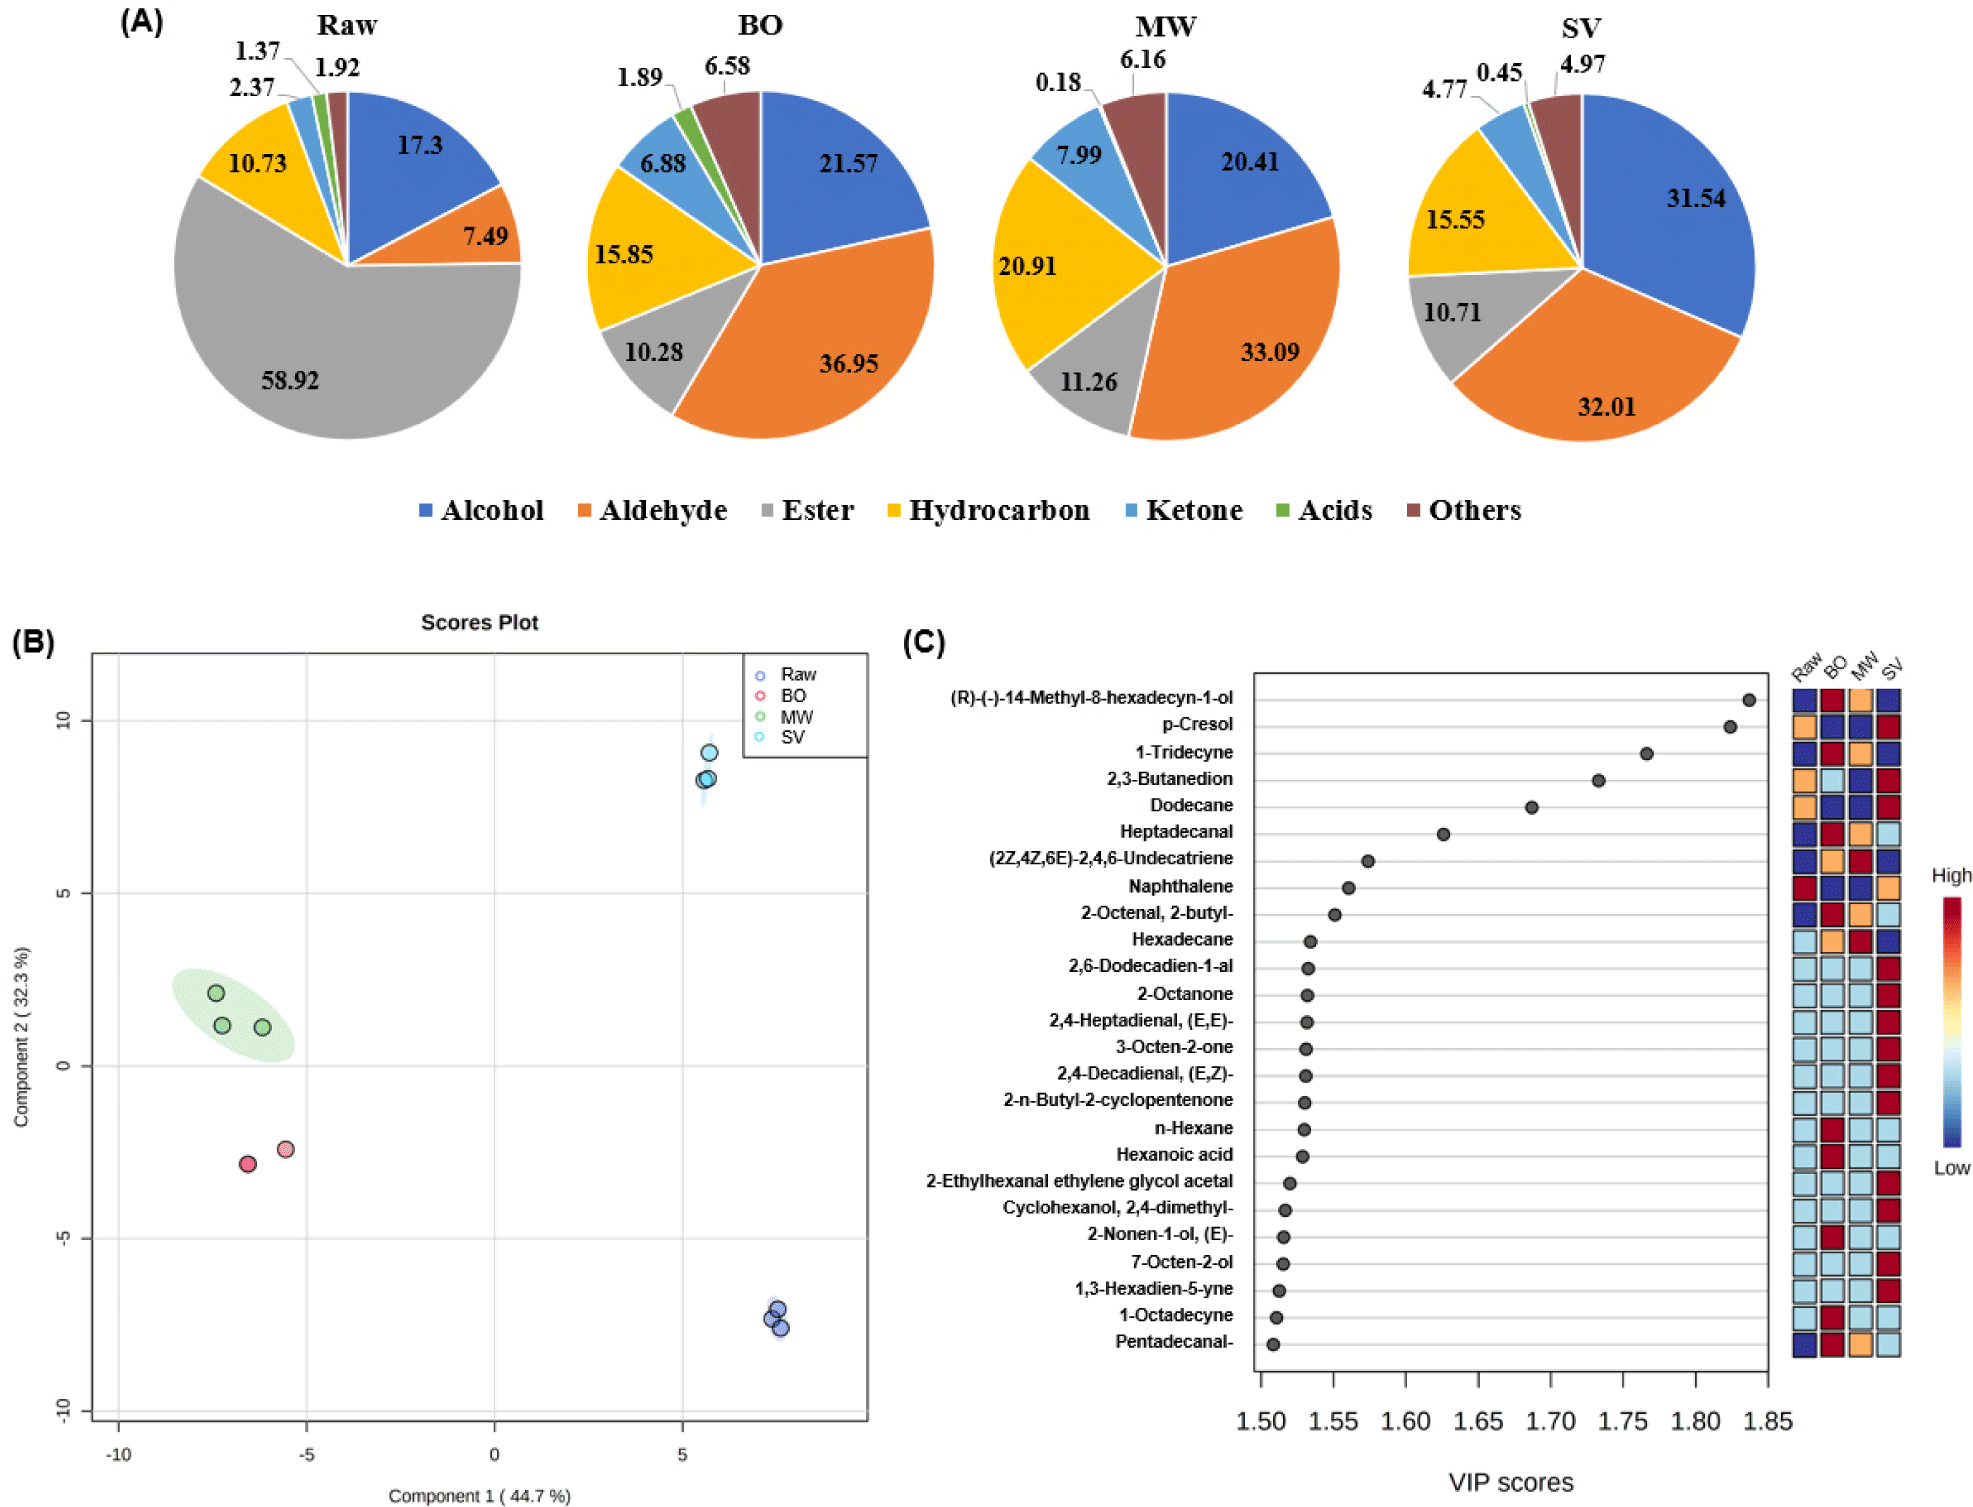
Acids can be produced by lipid oxidation or secondary degradation of oxidative products, such as hexanal (Chang et al., 2020). Among the cooking methods, BO resulted in the highest total acid content, followed by SV and MW (p<0.05). Heptanoic acid (sour, cheese, sweat), nonanoic acid (cultured dairy, waxy, green), and n-decanoic acid (sour, fat, unpleasant) were not detected after cooking (p<0.05). Hexanoic acid (cheese, fatty, sour, sweet) was found only in the BO (p<0.05). Octanoic acid (cheesy, sweat, vegetable, rancid) was found in all samples, which was not in accordance with Ramírez et al. (2004) and Domínguez et al. (2014), who did not observe octanoic acid in pork loins (raw and some fried meat) and foal meat (raw, microwaved, fried, and grilled meat), respectively.
Alcohol is most likely formed via the oxidative decomposition of UFA (Chang et al., 2020). Some alcohols, such as 1-octen-3-ol (raw, fishy, oily, earthy, mushroom), 2-ethylhexanal ethylene glycol acetal, and 2-octen-1-ol, (E)-(citrus, green, plastic, soap) were higher in SV (p<0.05), resulting in SV to have the highest alcohol composition (Fig. 1A). Among them, 1-octen-3-ol is considered a warmed-over flavor compound (Bassam et al., 2022) and a typical volatile marker of raw and unprocessed meat (Karabagias, 2018) that is mainly derived from arachidonic acid oxidation (Sohail et al., 2022). Hence, it can be inferred that SV had a significantly lower arachidonic acid composition than round meat cooked using other cooking methods. In contrast, Rasinska et al. (2019) reported that rabbit meat cooked using sous-vide method contained significantly lower levels of 1-octen-3-ol than that cooked using boiling, which might be due to different cooking times (rabbit meat was cooked for 2.5 h). However, alcohols are not considered as important flavor contributors in meat products because of its high-odor thresholds (Domínguez et al., 2014).
The degradation of UFA is a major source of aldehydes, which can be used to indicate the oxidation level of meat and contribute to meat aroma, owing to their low thresholds (Bassam et al., 2022). BO had the highest total aldehyde content, followed by MW and SV (p>0.05). Cooking or reheating meat at high temperatures favors rapid fatty acid oxidation, generating more aldehydes (Domínguez et al., 2014). BO and MW contained higher nonanal (citrus, rose, fishy, fresh, fatty, aldehydic) levels than SV (p<0.05), whereas octanal (lemon, soap, fat, aldehydic, green) levels were not significantly different between the cooking methods. Octanal and nonanal are known to have a pleasant aroma (Bassam et al., 2022). Benzeneacetaldehyde (hawthorn, honey) was the highest in SV compared with that in the other cooking methods (p<0.05). This compound has been established as a major flavor contributor to some dry-cured hams, with a low threshold and distinctive cured and fermented descriptors (Pham et al., 2008). The highest amounts of 2,4-decadienal, (E,Z)- (fat, fried, green) and 2,4-decadienal, (E,E)- (fat, fried) were detected in the SV (p<0.05). 2,4-Decadienal can be considered a positive meat flavor compound, but it may produce undesirable flavors at higher concentrations (Rasinska et al., 2019).
Esters arise from the esterification of alcohols or carboxylic acid in meat (Domínguez et al., 2014). The total ester content was higher in MW and SV than in raw and BO (p<0.05). Rasinska et al. (2019) reported that the total ester content was higher in raw rabbit meat than in meat subjected to boiling, roasting, and sous-vide cooking. Benzoyl isothiocyanate and Arsenous acid, tris(trimethylsilyl) ester were the most abundant esters in all cooking methods. Esters can provide a unique meat flavor owing to their low-odor threshold, imparting fruity or slightly fatty notes (Lorenzo and Domínguez, 2014).
Hydrocarbons are produced by UFA oxidation, free radical reactions, and the thermal decarboxylation of SFA (Chang et al., 2020). All cooking methods resulted in higher hydrocarbon content in cooked round meat compared with that in raw meat (p<0.05). MW contained significantly higher levels of total hydrocarbons and various types of hydrocarbons (35 types) than BO (28 types) and SV (24 types). Lorenzo and Domínguez (2014) suggested that cooking for short time, such as microwave cooking, could lead to a greater amount of aliphatic hydrocarbons than other cooking methods, such as roasting and grilling. Herein, cyclotetrasiloxane, octamethyl- was the most abundant hydrocarbons, followed by oxetane, 3-(1-methylethyl)-, comprising approximately average of 68% and 14% of the total hydrocarbons in all cooking methods, respectively. Unlike esters, hydrocarbons cannot be considered as particular odorants because of their high-odor threshold; therefore, they do not contribute significantly to meat flavor (Lu et al., 2008).
Ketones are formed via lipid oxidation and the Maillard and Strecker reaction under various cooking condition; in particular, methylketone, a product of beta-keto acid, imparts a meat aroma (Bassam et al., 2022). In our findings, all cooking methods increased the total ketone content in cooked beef compared with that in raw round meat. MW had the highest ketone volume, followed by BO and SV (p<0.05). Furan, 2-pentyl-(greenbean, butter) is the most abundant ketone in all cooked meats, comprising approximately 77% to 83% of ketones. 2-ketones are considered a crucial aroma contributor to meat (Bassam et al., 2022). In this study, 2-octanone (soap, gasoline) and 3-octen-2-one (nut, herbal, sweet, mushroom, spicy) were only observed in the SV (p<0.05). In contrast, 2,3-butanedione (butter, caramel, sweet) and 2-butanone (acetone, camphor, ether, fruity) were detected in all cooked meat samples. SV had significantly higher levels of 2,3-butanedione, which considered a relatively sensorily important VOC because its threshold is lower than that of other ketones (Giri et al., 2010), and could be mainly developed in vacuum-packaged meat (Bassam et al., 2022).
The results of PLS-DA and its VIP scores for VOC are shown in Figs. 1B and C. The correlation coefficients and cross-validation correlation coefficients of PLS-DA were R2 (0.8838) and Q2 (0.7714), respectively. The VOC clusters in the beef round were completely separated according to the different cooking methods. The VOC clusters of MW and BO were close. However, the VOC cluster of SV was distant from those MW and BO, suggesting that sous-vide cooking can generate a distinct VOC profile. The sum of components 1 and 2 was 77.0%, which explained 77.0% of the total variance in the effect of cooking methods on the aroma profile formation of beef round (Al-Dalali et al., 2022). The effect of different cooking methods on beef round was screened by VIP methods, and the high VIP scores (>1.50) determined the potential aroma compounds to differentiate each treatment. A VIP score >1.0 was used as a marker to distinguish the effects of different cooking methods (Al-Dalali et al., 2022). A total of twenty-five different components were screened, and most of the selected markers comprised alcohols, aldehydes, and hydrocarbons, indicating that these compounds originated from lipid oxidation during cooking. Some compounds, such as (R)-(-)-14-methyl-8-hexadecyn-1-ol, 1-tridecyne, heptadecanal (blackberry, lemon), and hexadecane (alkane), were relatively higher in BO and MW but lower in SV. On the other hand, ten compounds, including 2,6-dodecadien-1-al (citrus, deep, melon), 2-octanone (soap, gasoline), and 2,4-heptadienal, (E,E)- (cinnamon, hazelnut), were only observed in SV. Interestingly, among these ten compounds, the amount of 2-ethylhexanal ethylene glycol acetal was approximately fourteen times more (14.13 A.U.×106) than the other nine compounds. We assumed that this compound may have been derived from the polypropylene bag during sous-vide cooking. Therefore, it can be used as a marker to distinguish beef round meat cooked using the sous-vide from meat cooked using other methods. Some authors have reported the possibility of several by-products derived from polypropylene degradation during sous-vide cooking, such as 2,4-dimethyl-1-heptene (Nieva-Echevarría et al., 2017). However, this compound was not detected in our study; therefore, further studies should be conducted to evaluate the exact mechanisms of 2-ethylhexanal ethylene glycol acetal production.
Except for color and juiciness, five sensory parameters, including aroma, taste, flavor, tenderness, and overall acceptability, were significantly affected by the different cooking methods (Table 7). SV had a higher aroma and flavor score than BO (p<0.05), whereas that of MW was not significantly different, which may be attributed to the effects of higher contents of esters and 2-ketone in SV. The aromatic VOC can be created at 70°C, which affect the palatability of cooked meat and sous-vide may have intense aroma, because of the products of Strecker reaction of amino acid and thiamine and its concentration can be increased with cooking time (Modzelewska-Kapituła et al., 2019). In terms of taste, SV had the highest sensory score compared with that of the other cooking methods (p<0.05). These results might be due to the high concentration of taste-related compounds, including glutamic acid, aspartic acid, and oleic acid, in SV. A similar trend was observed by Modzelewska-Kapituła et al. (2019), who found that Semimembranosus of Holstein cooked using sous-vide method accepted significantly higher tenderness, taste, juiciness, and overall linking scores than those cooked using steaming. In terms of tenderness, SV appeared to have a significantly higher tenderness than the other cooking methods, which might be related to the low WBSF value and hardness of TPA. Baldwin (2012) explained that, when heated up to 65°C, meat is tenderized by sarcoplasmic protein aggregation and gelation so that it could easily disintegrate in the mouth. However, the cited author further explained that, when heated up to 80°C, meat becomes tougher due to an increase in elastic moduli. Although there were no statistical differences in juiciness between the cooking methods, SV got relatively higher juiciness score than the other groups, which might be due to relatively lower cooking loss of SV compared with that of BO and MW. Overall, SV showed a higher tendency of overall acceptability score than BO and MW, which might be attributed to its high flavor and tenderness score. This phenomenon may be due to the influence of the combination of fatty acid degradation products and non-volatile compounds (Modzelewska-Kapituła et al., 2019).
Conclusion
In conclusion, this study confirmed the effectiveness of sous-vide cooking in improving dairy beef round meat tenderness through mechanical and sensory analyses. SV showed higher aspartic acid, glutamic acid, and oleic acid contents, lower IMP, and higher hypoxanthine and lipid oxidative volatiles, including 1-octen-3-ol than beef cooked using other methods. BO exhibited lower tenderness, and oleic acid, PUFA, IMP, and hypoxanthine contents than MW. In contrast, MW indicated higher MUFA/SFA, PUFA/SFA, and IMP contents compared to BO and SV. Compared with other cooking methods, SV has resulted in significantly higher levels of certain VOC, such as 1-octen-3-ol, 2-ethylhexanal ethylene glycol acetal, and 2-octen-1-ol, (E)-, in beef round, while also lowering levels of nonanal, which may be considered a volatile marker for distinguishing SV from BO and MW. This study provides preliminary data on the effect of different cooking methods, particularly sous-vide cooking, on the quality properties and flavor-related compounds of dairy beef round.