


Introduction
Attempts to develop meat alternatives have begun worldwide with concerns about increasing meat consumption, environmental crises, food competition with animal, and ethical issues from slaughtering animals (Kadim et al., 2015; Post, 2012). Although it had a late start relative to plant or insect-based meat, cultured meat has drawn the most attention in the meat-alternative industry because it can be similar to conventional meat (Ismail et al., 2020). Research is being conducted on methods to produce cultured meat by culturing cells from various animals such as lobsters and kangaroos. In particular, technology using cow and pig cells for producing cultured meat has progressed rapidly (Lee et al., 2022). However, studies using chicken cells for producing cultured meat are relatively lacking despite the high contribution and consumption of chicken in the world’s total meat consumption (Liu et al., 1999; Whitton et al., 2021).
Most studies on the production of cultured meat used muscle satellite cells, known as skeletal muscle precursor cells, which are most likely to differentiate into muscle tissue (Bischoff, 1997; Clevers, 2015; Mauro, 1961; Zammit and Beauchamp, 2001). The isolation of only satellite cells from tissue, as the first step in the production of cultured meat, is an important process for determining the purity of the cells to be contained in cultured meat. Centrifugation allows satellite cells to be isolated from most extracellular substances, such as the extracellular matrix, fat, bones, and cartilage, contained in tissue (Matsuyoshi et al., 2019). Also, studies on the taste and nutritional characteristics of cultured meat have also begun beyond the stage of cell culture (Ismail et al., 2020; Joo et al., 2022). However, there are limitations in separating materials with no significant difference in size or density from satellite cells, such as fibroblasts and epithelial cells, so more accurate cell sorting methods have been used (Plouffe et al., 2015).
Recent studies that cultivated satellite cells for cultured meat generally used fluorescence-activated cell sorting (FACS), magnetic-activated cell sorting (MACS), and pre-plating to purify the cells. However, purification can biochemically stimulate cells, so there are problems using FACS and MACS for food production processes. FACS, which can isolate cells with high purity, requires expensive equipment and skilled experts, and can also cause cell death by the high pressure and laser applied to the cell suspension during sorting (Benedetti et al., 2021; Matsuyoshi et al., 2019; Yoshioka et al., 2020). MACS has the advantage of less apoptosis but results in less accurate purification than FACS by negatively selecting cells using labeling magnetic bead-conjugated cell antibodies (Benedetti et al., 2021). In addition, FACS and MACS have a common drawback that studies on specific antibodies for cell sorting have not been conducted in various animal species except for cattle and pigs because of the risk that the cell-staining antibodies themselves might be toxic (Choi et al., 2020; Ding et al., 2017; Ding et al., 2018; Liu et al., 1999; Yoshioka et al., 2020).
Pre-plating is a method commonly used to isolate specific cells from various cell types, and studies using pre-plating have been continuously conducted to purify various types of cells in diverse fields (Bakhtiari et al., 2016; Doumit and Merkel, 1992; Park et al., 2006; Rouger et al., 2007). Based on research to date, pre-plating is more efficient than other sorting methods in the aspects of cost and safety. However, it is necessary to establish a specific pre-plating method because of the large difference in attachment time depending on the cell characteristics of the animal species or individuals (Guan et al., 2022). In particular, a cell sorting method to be used for food production needs to be safe and have the potential for mass production. Therefore, in this study, we tried to investigate the optimal pre-plating method of chicken satellite cells, considering a few of the aforementioned reasons, such as the riskiness of the antibody, food safety, and relative shortage of research on the use of chicken cells for cultured meat.
Materials and Methods
The treatment and use of experimental animals were approved by the Institutional Animal Care and Use Committee (IACUC) at Gyeongsang National University (approval no. GNU-210308-C0028). All experimental steps complied with the IACUC standard procedures.
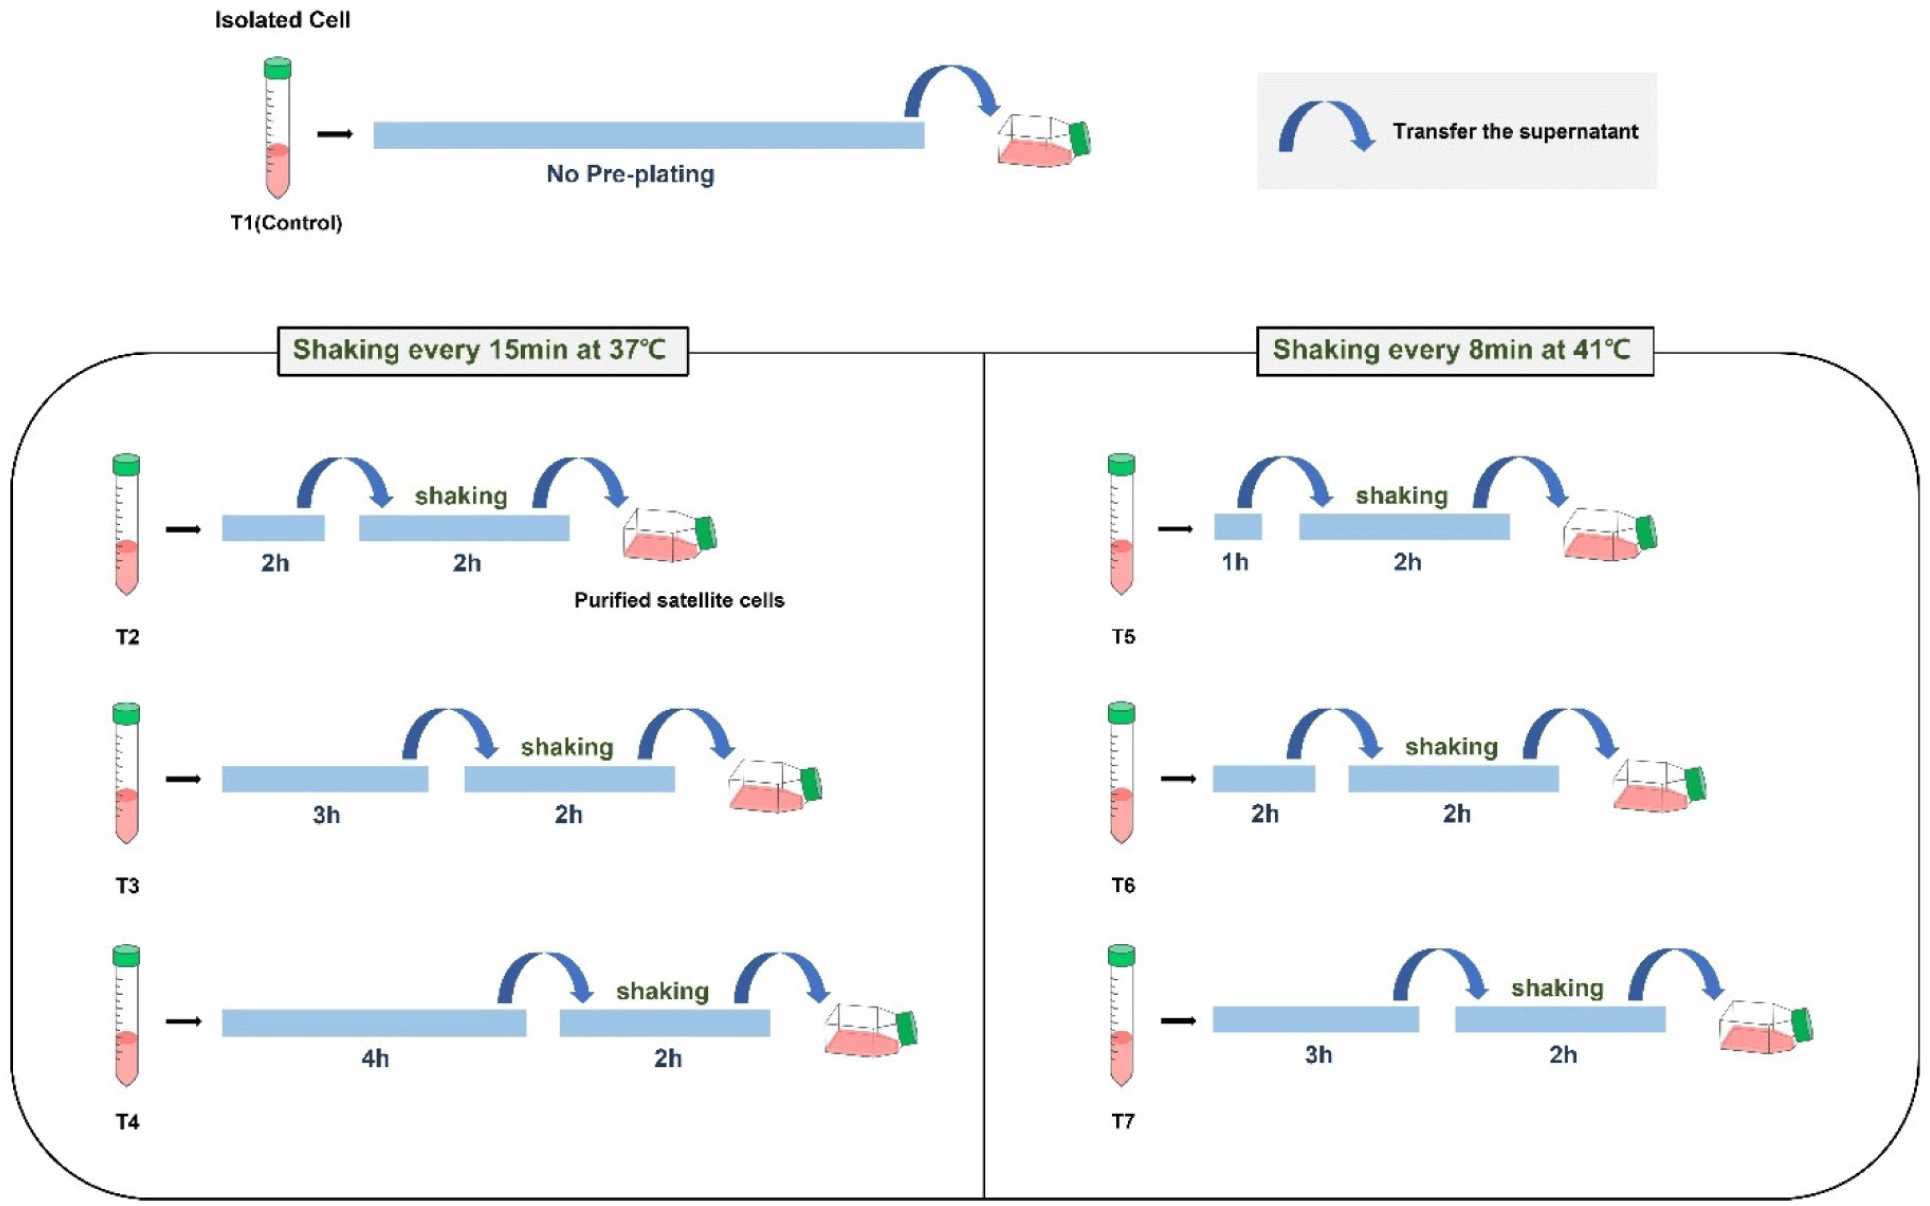
Chicken cells were secured through an isolation process from muscle tissue separated from six chicken embryos. After the isolation, the cell suspension, in which several cell groups were mixed, was purified by pre-plating. Seven groups (T1–T7) were classified according to time conditions, and 2 groups (T8 and T9) were classified according to temperature conditions (Fig 1). Thus, a total of 9 groups were pre-plated. The cells were stained with paired box protein 7 (Pax7) to confirm purification levels after proliferation, and myosin heavy chain (MHC) was stained to determine temperature suitability after differentiation. The immunofluorescence staining results were used to determine whether the pre-plating conditions were suitable for chicken satellite cell purification.
The Hindlimb muscle tissue of 18-day-old chicken embryos was dissected and collected, minimizing bone and cartilage collection. The tissue was washed with 70% ethanol to disinfect the surface and immersed in Hanks balanced salt solution (Welgene, Gyeongsan, Korea) containing 1% antibiotic-antimycotic (anti-anti; Thermo Fisher Scientific, Waltham, MA, USA) to remove extrinsic debris such as hair and blood. After collecting chicken muscle tissue, the samples were stored refrigerated at 4°C.
The tissue sample was placed in a dish, minced with small scissors until it became a thick liquid, and transferred to a 50-mL conical tube. Type I collagenase (0.1%; Worthington Biochemical, Lakewood, NJ, USA) was added to the conical tube containing minced tissue and was incubated at 37°C in a water bath for 1 h to achieve a cell suspension. During incubation, the tissue suspension was aspirated and discharged from a 50-mL syringe with an 18-gauge needle every 15 min. Then, the tissue was disrupted into smaller particles to maximize the collagenase reaction. The digested cell suspension was centrifuged at 4°C, 300×g for 5 min, the supernatant was removed, and 0.25% trypsin-EDTA (GibcoTM, Grand Island, NY, USA) was added to the pellet. The cell suspension underwent enzymatic digestion was incubated at 37°C for 20 min. To neutralize the trypsin, fetal bovine serum (FBS) was carefully added to the cell suspension along the wall of the conical tube. After neutralization, Dulbecco’s phosphate-buffered saline (DPBS; Welgene) was added to the cell suspension to a total tube volume of 35 mL and the conical tube was mixed gently in a circular pattern. The viscous connective tissue lump started to rise, which was removed by aspirating with a 15-mL syringe with an 18-gauge needle. During removal, cell suspension loss was minimized. For enzymatic digestion, the cell suspension was filtered through cell strainer (SPL life science, Pocheon, Korea) with pore sizes in the order of 100 μm and 40 μm, and centrifuged at 4°C at 300×g for 5 min. The supernatant was removed and red blood cell lysis buffer (InvitrogenTM, Carlsbad, CA, USA) was added to the pellet.
A shaking pre-plating method was used to attach fibroblasts to the culture dish and the flask containing the cells was shaken to prevent the adhesion of satellite cells (Rouger et al., 2007; Yoshioka et al., 2020). The cell suspension was transferred to a T75 flask coated with 0.1% collagen. The cell suspension was pre-incubated for cell stabilization and fibroblast adhesion (Fig. 1). The total time at 41°C in the pre-plating method was shorter than 37°C in anticipation of the faster adhesion of chicken cells during pre-plating and culture. Pre-plating was not performed for the T1 control. The other groups (T2–T7) were pre-plated from 1 h to 4 h because the temperature affects the attachment rate of different cells. To identify the attached cells supposed to be fibroblasts, the supernatant was transferred to another collagen-coated culture flask and incubated for 2 h. During incubation at 37°C, the flask containing the cell suspension was shaken at 60 rpm for 20 sec every 15 min with an orbital shaker (DAIHAN Scientific, Wonju, Korea) in an incubator to sufficiently swirl the supernatant. Previous studies showed that mouse and human fibroblasts adhered to flasks within 5 min after cell seeding and additional replating steps were required to eliminate the fibroblasts that were observed after pre-plating (Yoshioka et al., 2020). However, chicken fibroblasts took at least 15 min to attach to collagen-coated flasks at 37°C and 5% CO2 culture conditions in our experiment. Thus, the shaking pre-plating time was set to 8 min at 41°C, which was different from the 37°C used in other studies. Therefore, the flask was incubated at 41°C and shaken at 60 rpm for 20 sec every 8 min. Finally, the supernatant was transferred to another culture flask to start the main culture.
Cells were seeded in culture flasks at 5,000 cells/cm2 by counting the number of cells in the supernatant. When debris remained in the supernatant, the supernatant was centrifuged at 4°C at 300×g for 5 min. After centrifugation, the supernatant was discarded and growth media [GM; 20% FBS, 5 ng of human recombinant basic fibroblast growth factor (bFGF; Stemcell Technology, USA), 5 μM p38 inhibitor (MedChemExpress, Monmouth Junction, NJ, USA), 1% Glutamax supplement (Thermo Fisher Scientific), and 1% anti-anti in DMEM] was added to the pellet. The flask containing cells was incubated in 5% CO2. Cells were allowed to proliferate to 70% confluency for 3 days, and the GM was replaced with differentiation medium [DM; 2% FBS, 1% Glutamax supplement, 1% anti-anti in Dulbecco’s Modified Eagle’s Medium (DMEM)] to induce differentiation.
The cells were fixed with 4% paraformaldehyde for 15 min at room temperature (RT) and washed with DPBS for 5 min at least twice. The fixed cells were permeabilized with 0.5% Triton X-100 for 15 min and washed with DPBS for 5 min at least twice. After permeabilization, the cells were blocked with 3% bovine serum albumin (BSA; Sigma Aldrich, A9647) in DPBS, and incubated with primary antibodies including mouse anti-Pax7 conjugated with Alexa fluor 488 (1:200, Santa Cruz Biotechnology, Cat #sc-81648 AF488) and mouse anti-MHC (1:40, DSHB, MF20). The cells with were incubated with primary antibody at 4°C overnight and washed twice with DPBS for 5 min the next day. The secondary antibodies, goat anti-mouse IgG2b cross-adsorbed secondary antibody conjugated with Alexa Fluor 488 (1:500, Thermo Fisher Scientific), were diluted in 3% BSA in DPBS and added to cells for 2 h at RT. Nuclei were counterstained with Hoechst 33342 (InvitrogenTM, H3570), and a few drops of FluoromountTM Aqueous Mounting Medium (Sigma Aldrich, F4680) were dropped on. The samples were observed on an Olympus fluorescence microscope CKX 53 (Olympus, Tokyo, Japan). Immunofluorescence images were processed with ImageJ software to adjust the brightness and contrast and ViaFuse macro program to calculate fusion index (FI, %; Hartig, 2013; Hinkle et al., 2021).
All statistical analyses were performed using SAS (Version 9.4, SAS Institute, Cary, NC, USA). The data are presented as the mean±SD and statistical significance was determined using one-way ANOVA and Student’s t-test. Duncan’s multiple range test was performed to compare the means. All error bars in the figures indicate SD. A p-value of <0.05 indicated statistical significance.
Results and Discussion
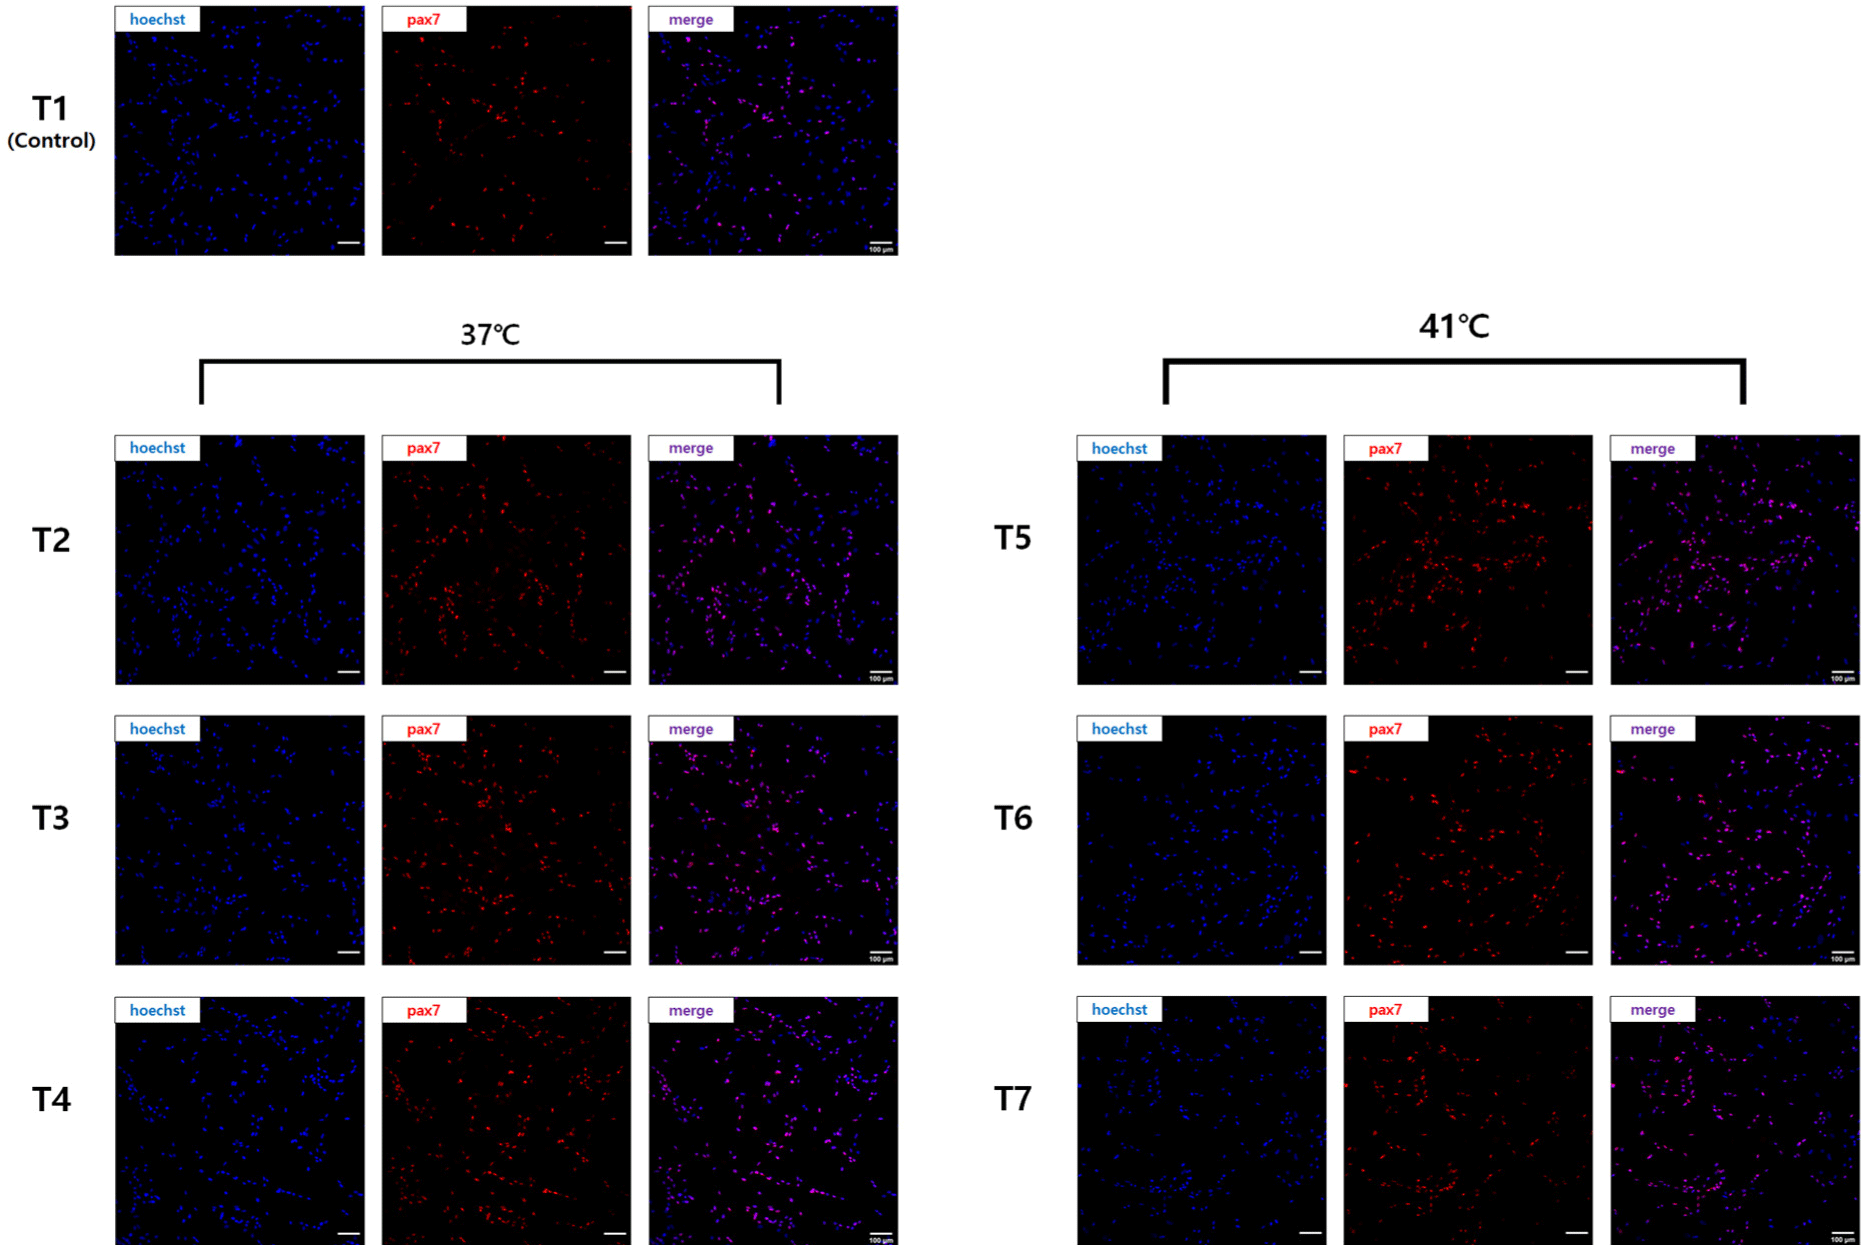
The cells purified with different pre-plating times at each temperature showed different Pax7 expressions (Fig. 2). In T1 (Control) without pre-plating, Pax7 expression was lower, as shown by the number of nuclei observed with Hoechst staining. In the other six groups (T2–T7) with pre-plating, Pax7 expression was higher than in the T1 group, but it was not easy to compare them visually. Pax7-positivity (%), which compared Pax7 expression to Hoechst staining, was significantly lower in the T1 group compared to the other groups because the satellite cell purity was only 45% (p<0.05; Fig. 3). Satellite cell purity in the T2–T3 groups pre-plated at 37°C was significantly higher than in the T1 group, and the T3 group showed the highest Pax7 expression (p<0.05). Pax7 expression (%) was lower in the T2 group than in the T3 group (p<0.05) and expression in the T4 group was not significantly different from either the T2 or T3 group (p>0.05).
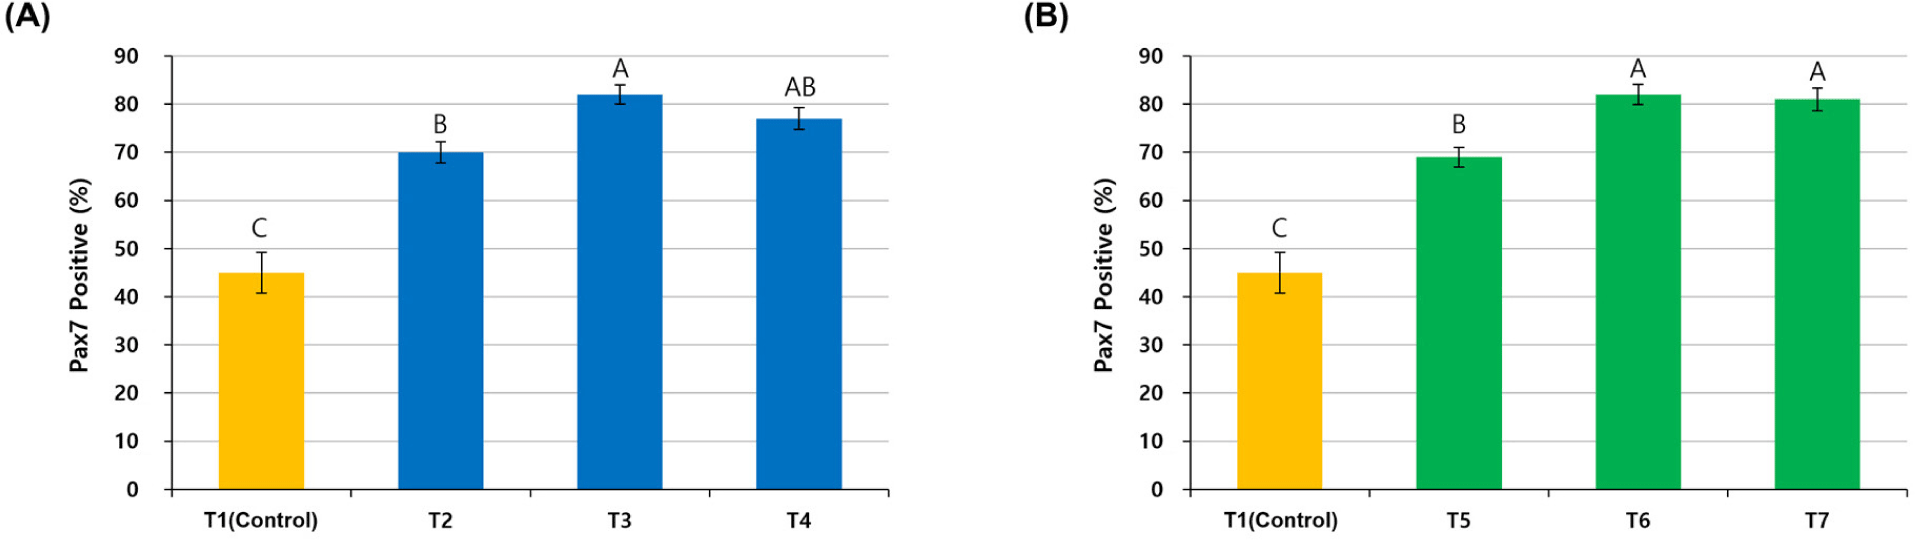
To establish an optimal purification method for chicken satellite cells using pre-plating, satellite cell purity was measured by staining the cells with Pax7. Pax7 is a representative marker of satellite cells and is a transcription factor that can be observed in proliferating satellite cells or myogenic progenitors (myoblasts), so it is suitable for checking the level of cell sorting by pre-plating (Allouh et al., 2008; Seale and Rudnicki, 2000). The T1 group without pre-plating showed a low Pax7 expression rate of 45%, which means that other cell types were not separated but included in the cell suspension and cultured together. Pax7 expression in the T2 group was lower than in the T3 and T4 groups due to insufficient pre-incubation time for the adhesion of fibroblasts to the flask. Pax7 expression in the T4 group could also have been reduced due to the relatively small number of satellite cells in the supernatant because satellite cells were removed by attachment during the long pre-incubation time of 4 h.
The relatively short pre-incubation time might have caused lower Pax7 expression in the T5 group than in the T6 and T7 groups because sufficient adhesion of fibroblasts did not occur. This suggested that a large number of fibroblasts was attached in 3 h, and shaking for 2 h during pre-plating allowed for a higher level of satellite cell purity without additional re-plating when chicken cells were pre-incubated at general conditions of 37°C and 5% CO2. In addition, the purity of satellite cells at 41°C was similar to that at 37°C, although the pre-incubation time at 41°C was shorter than at 37°C. This implied that chicken satellite cells adhered faster at 41°C than at 37°C.
In general, satellite cell purity could be measured by the Pax7 staining of cells pre-plated for the same time but at different temperatures (Zammit et al., 2006). In this study, the visual expression of Pax7 in the T9 group, which was pre-plated at 41°C, was higher than that of the T8 group (Fig. 4A). The T9 group showed a smaller error range and significantly higher Pax7 expression (%) of more than 80% compared to the T8 group pre-plated at 37°C (p<0.05; Fig. 4B).
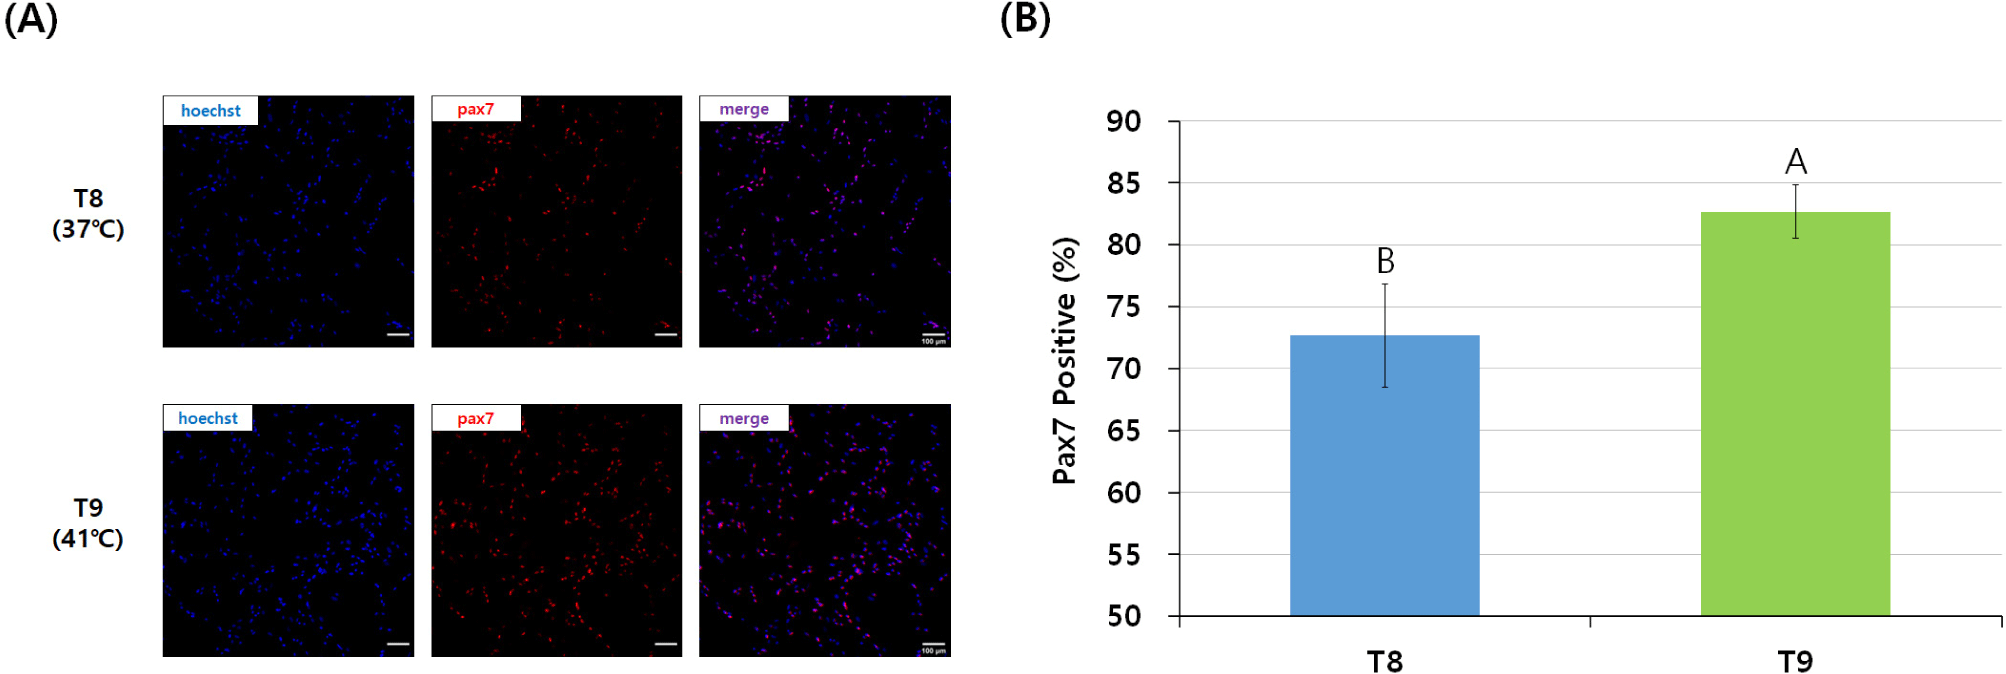
Shaking was used in the pre-plating method every 15 minutes after 2 h of pre-incubation in this study because the difference in the adhesion speed of various cell types at different pre-plating temperatures determined the purity of the cells remaining in the supernatant (Yoshioka et al., 2020). In the T8 group, Pax7 expression was relatively lower than in the T9 group because many fibroblasts remained in the shaking pre-plating stage due to the insufficient adhesion of fibroblasts at 37°C. Remaining fibroblasts are a major problem that occurs when pre-plating chicken satellite cells for 2 hours at 37°C, which is an appropriate temperature for mammalian cell culture, and used in many pre-studies for cultured meat and satellite cells regardless of the animal species (Baquero-Perez et al., 2012; Benedetti et al., 2021; Lee et al., 2022). Considering the adhesion time of chicken fibroblasts, 3 h of pre-incubation at 37°C, as in the T3 group, was more suitable for chicken cells. Also, the T9 group showed a high Pax7 expression (%) of more than 80%, which implies that setting the shaking pre-plating time to 15 minutes did not negatively affect the purity of chicken satellite cells.
When pre-plating was conducted at different temperatures, as in the T3, T6, and T7 groups, which showed a high Pax7 expression (%) of more than 80%, cells were differentiated at each pre-plated temperature and stained with anti-MHC (Fig. 5). The FI (%) was the highest in the T6 group cultured at 41°C from pre-plating to differentiation, and there was no significant difference between the T6 and T7 groups (p>0.05; Fig. 6A). The T3 group showed significantly lower FI (%) values than the T6 and T7 groups (p<0.05). The myotube formation area (MFA; %) was also the highest in the T6 group among the three groups and the T3 group showed a relatively lower MFA (%) value than the T6 and T7 groups (p<0.05). There was no significant difference between the T6 and T7 groups (p>0.05).
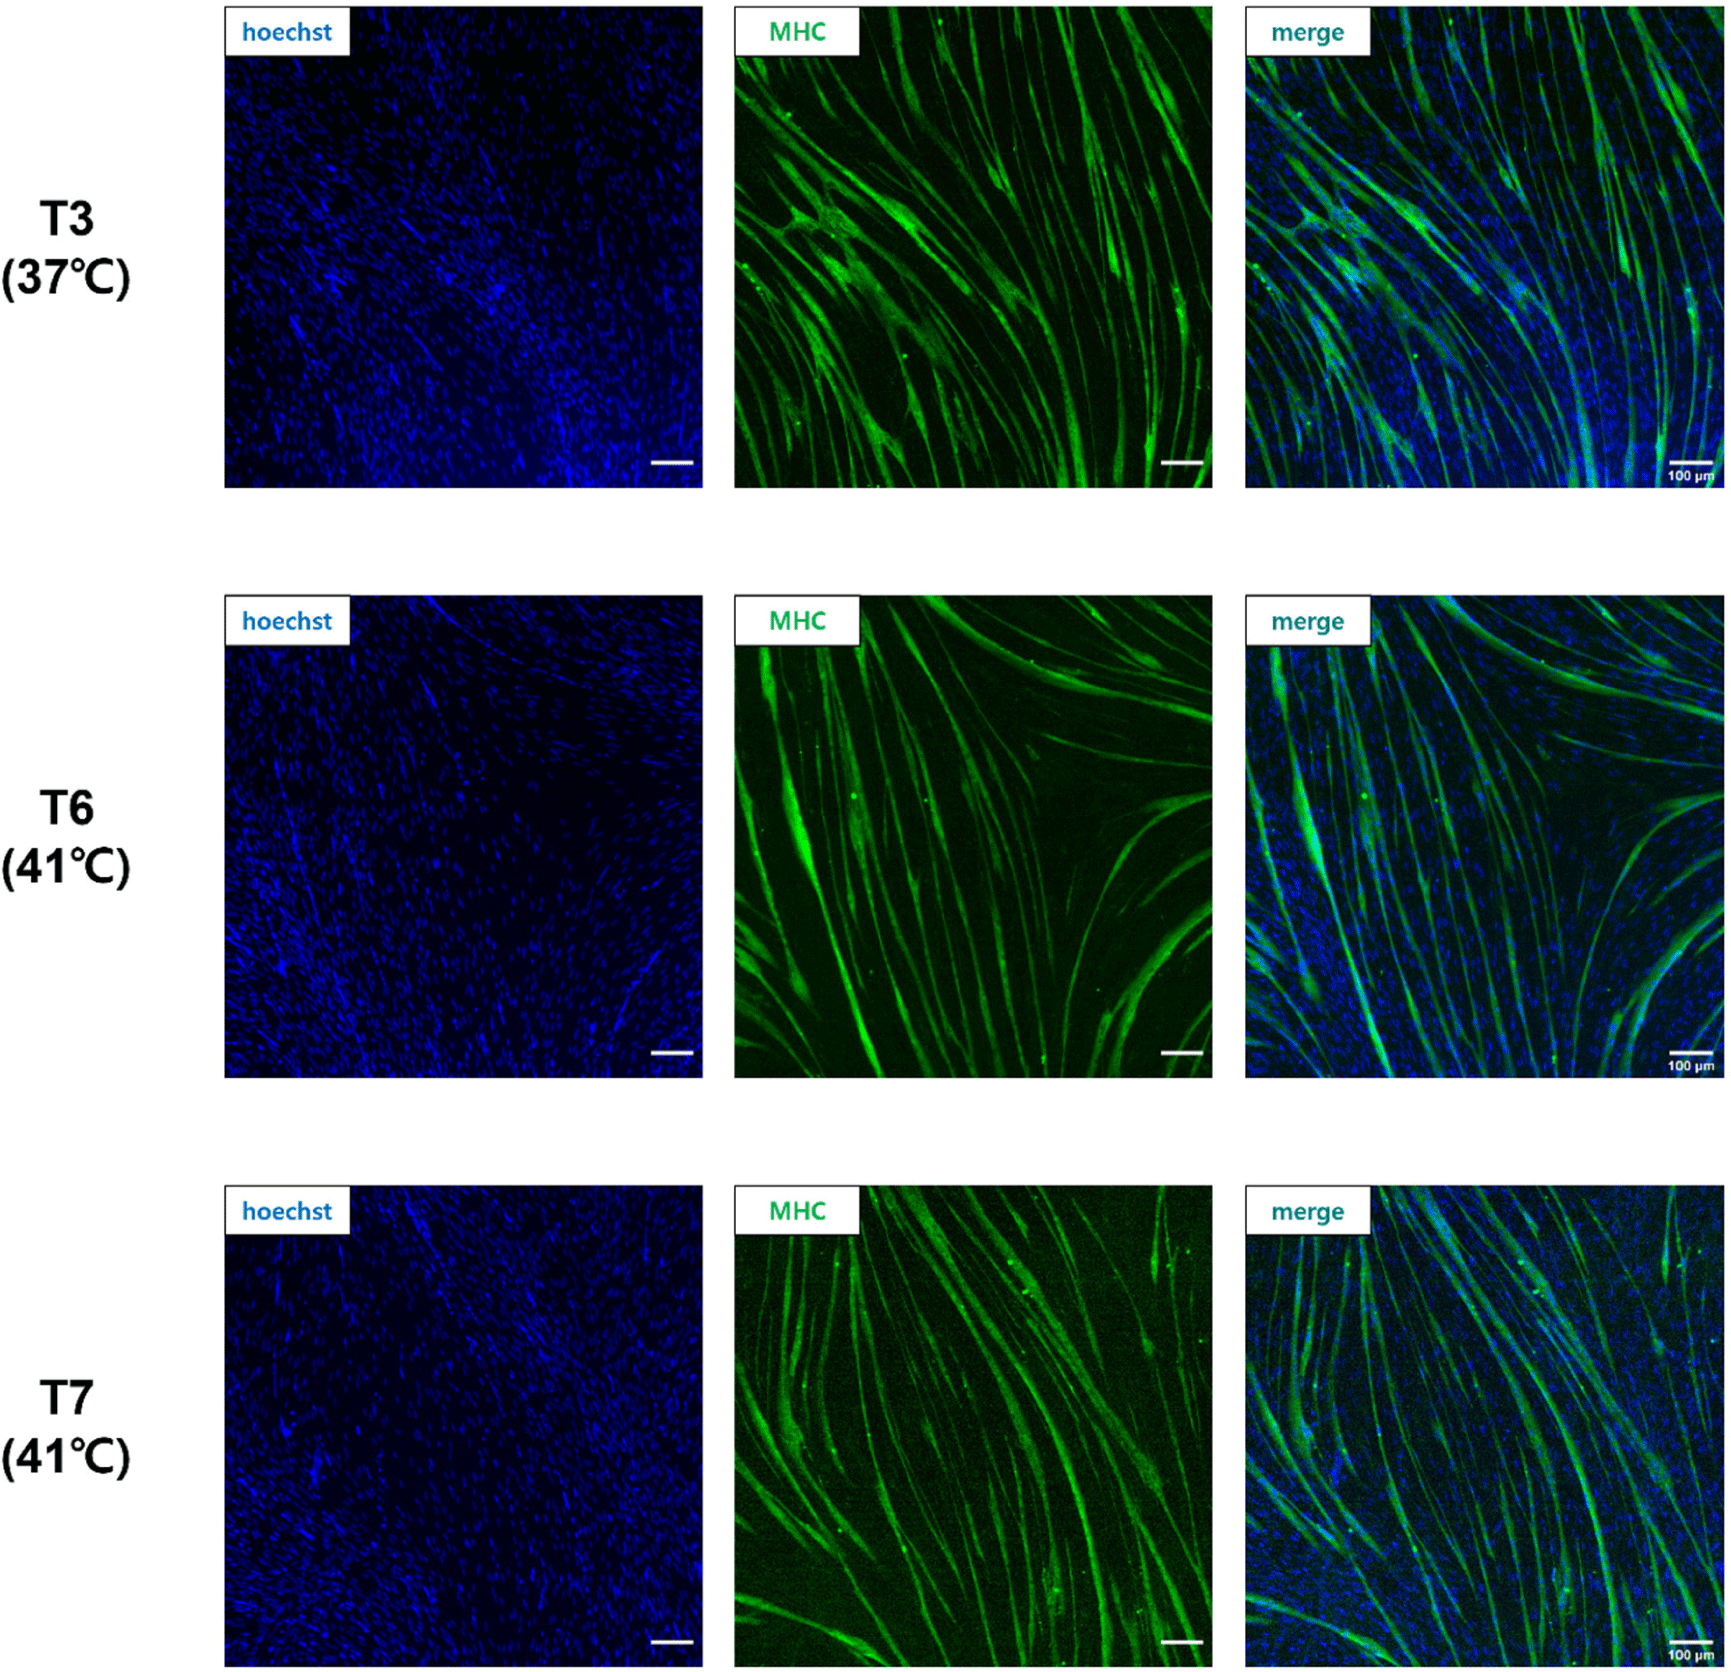
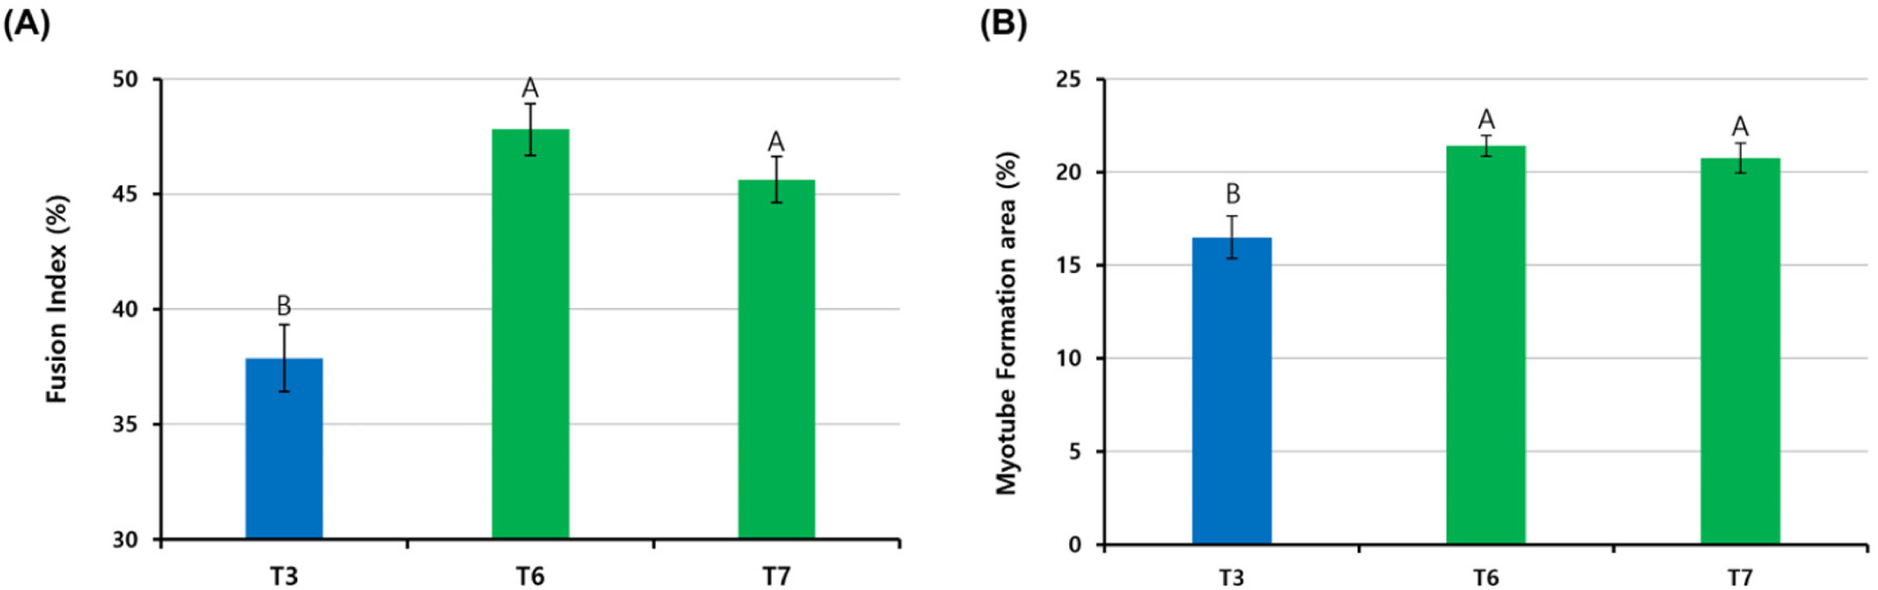
Fig. 5 shows the fusion of nuclei in satellite cells and the formation of myotubes in the T3, T6, and T7 groups. The FI (%) is the percentage of nuclei inside myotubes and can be used as an indicator of the myotube-forming state (Hinkle et al., 2021). The MFA (%) describes the percentage of the myotube area in the field. Pax7 expression in the T3, T6, and T7 groups was about 80%, indicating high satellite cell purity, but cells in the T3 group proliferated and differentiated at 37°C, showing relatively low FI (%) and MFA (%) compared to the T6 and T7 groups. This difference suggests that different culture temperatures, especially 37°C, were not optimal for the differentiation of chicken satellite cells. It is well known that the body temperature of chickens is 41°C, which is higher than mammals such as cows and pigs. Consequently, our data confirmed that chicken satellite cells were more active in terms of cell signaling and myotube formation at 41°C, which is chicken body temperature.
Conclusion
When chicken satellite cells were pre-plated for the production of cultured meat, it was time-efficient to pre-plate chicken cells at 41°C for a total of 4 h in consideration of the average body temperature of chickens. Specifically, the most effective way to minimize fibroblast contamination was to pre-incubate the cell suspension for 2 h before the flask containing cells was shaken every 8 min for 2 h. Furthermore, satellite cells could differentiate and form myotubes better when chicken satellite cells were incubated at 41°C from pre-plating through differentiation.