


Introduction
Polyunsaturated fatty acids (PUFA) are well recognized essential fatty acids (FA) because they are the major components of cell membranes, which play an important role to control cardiovascular diseases in humans (Sargent, 1997; Sanders, 2000). The correct balance of essential FA in the human diet can increase the consumption of these beneficial n-3 FA in order to enhance health status. Oily fishes are the main resource of PUFA (Howe et al., 2002; Sargent, 1997) but not among the popular foodstuffs in most of the countries. Pork is the most popular meat worldwide in terms of consumption rate, but mainly contains only a small amount of n-3 FA (Olsson and Pickova, 2005). A strategy to enhance the n-3 FA concentration of the diets would be an acceptable way to enrich the foodstuffs with high popularity such as pork. There has been a considerable increase in the n-6 consumption over the past decades due to a higher intake of vegetable oils from sunflower seeds, soybeans, and corn, which contain considerable amounts of n-6 PUFAs (Corino et al., 2002; Sanders, 2000). Furthermore, animal diets are based on grains with a high content of n-6 PUFAs, which led to the production of high n-6 content meat. In addition, animals are not able to produce n-3 PUFA by converting n-6 PUFA due to the lack of n-3 FA desaturase genes. It is logical to increase the ratio of essential n-3 FA in pork by providing high n-3 in pigs diet.
Linseed, as a good α-linolenic acid source, has gained attention as an alternative to fish oil in swine diets. The n-6:n-3 ratio in the food is reduced by supplementing linseed into pig feed, which possibly can reduce the n-6:n-3 ratio in the meat as well. However, the high content of unsaturated FA may decrease the meat quality by increasing in carcass fat softness and also changing the flavor and odor by decreasing the oxidative stability. It is well known that FA oxidation reaction in meat initiates by unsaturated FA (Wood et al., 2008). The oxidation reaction can adversely affect color, flavor, of meat (Corino et al., 2002; Howe et al., 2002). Thus, it seems essential to produce a diet containing an appropriate ratio of linseed over a period in order to improve the required requirement of n-3 in tissue without adverse effects on meat shelf-life, flavor and texture. The aim of this experiment was to evaluate the influences of different n-6:n-3 on the FA composition of adipose tissue, lipogenic enzyme activity, meat quality, and carcass characteristics.
Materials and Methods
The protocol for this study was approved by the ethics of the Institutional Animal Care and Use Committee of Kangwon National University. This study was conducted at the swine research station at the Kangwon National University, Chuncheon, Korea.
A total of 108 finisher pigs (Landrace×Yorkshire×Duroc) was assigned to 3 dietary groups including control (basal diet; 18:1) and low ratios (4:1 and 2:1) of n-6:n-3 with average body weight (BW) of 84.2±0.74 kg. The treatments were divided into 6 replicate pens of 6 pigs for each treatment. The pigs in all the treatments were fed isoenergetic diets with different ratios of n-6:n-3, prepared using 3.00%, 1.50%, and 0% of expended linseed to replace of animal fat to set the dietary n-6:n-3 ratios of the 3 diets about 18:1, 4:1, and 2:1 respectively. The experimental diets (meal form) were formulated to meet or exceed the current nutrient requirements for finisher pigs (NRC, 2012). Table 1 and Table 2 show the ingredient, chemical composition, and FA composition of the diets. The finisher pigs were housed (2.80 m×5.00 m) in partially slatted and concrete floor pens. Each pen was equipped with an automatic nipple waterer.
1) Supplied per kilogram of diet: 16,000 IU vitamin A, 3,000 IU vitamin D3, 40 IU vitamin E, 5.0 mg vitamin K3, 5.0 mg vitamin B1, 20 mg vitamin B2, 4 mg vitamin B6, 0.08 mg vitamin B12, 40 mg pantothenic acid, 75 mg niacin, 0.15 mg biotin, 0.65 mg folic acid.
All animals were weighed before being placed into pens, and daily feed intake (FI) was measured to calculate ADG, FI, and gain to feed ratio (GF). Relative gene expression levels of enzymes including hormone-sensitive lipase (HSL), acetyl CoA carboxylase (ACC), fatty acid synthase (FAS), and lipoprotein lipase (LPL) were investigated in FA tissue of two pigs per pen in the range of average BW on d 35 of study. About 50 g adipose tissue were separately collected from the longissimus dorsi (LD; 10–11th rib) of pigs and stored at −80°C to evaluate FA composition and gene expression of enzymes (HSL, ACC, FAS, and LPL).
All FA samples from adipose tissues were converted to methyl esters as described previously (Lepage and Roy, 1986). The prepared methyl esters were analyzed to separate the FA by gas chromatography (Shimadzu, GC-17A, Kyoto, Japan). The initial temperature of oven was set at 175°C for a period of 30 min, constantly increased to 235°C. The temperature (260°C) of injector and detector was kept constant. The identification of FA methyl ester samples was operated by methyl ester standards.
Total ribonucleic acid (RNA) extraction was performed using TRIZOL reagent on adipose tissue samples (Invitrogen, Carlsbad, CA, USA) as suggested in the manufacturer’s guideline. The ratio of absorption (260/280) for all samples was in a range of 1.6 to 1.8 using a Nanodrop 1000 (NanoDrop Technologies, Wilmington, DE, USA). Aliquot of polyadenylated RNA samples were electrophoresed to assess integrity. Real-time reverse transcription was operated by using ImProm-IITM kit (Promega, Madison, WI, USA). The reverse transcription was conducted on 1 μg of total RNA into cDNA in 20 μL reaction volume including 1 μL of random oligonucleotide primer. Reverse transcription was performed by a thermal program of 75°C for 5 min and 4°C for 5 min, followed by 25°C for 5 min, 42°C for 60 min, and 70°C for 15 min.
The cDNA samples were mixed with 10.0 μL SYBR® Green quantitative real-time polymerase chain reaction (Toyobo, Osaka, Japan). The mixtures were used in the presence of 0.50 μL of forward and reverse primers (10 pmol/μL) for porcine LPL, FAS, ACC, and HPL, then were used for qPCR under a standard condition. As a control, the similar reverse reaction mixes were selected to PCR using the pairs of porcine 18S rRNA primers. The sequences of primers (Kim et al., 2014) are given in Table 3. A Real-time PCR (Bio-Rad, Hercules, CA, USA) was used for mixtures incubation to perform in 20 μL of total reaction volume, according to the manufacturer’s guideline. An initial denaturation step PCR conditions were conducted at 95°C for 1 min, then 40 cycles of denaturation/primer annealing/elongation (at 95°C for 15 s, at 58°C for 30 s, and at 95°C for 15 s, respectively) with a final extension at 72°C for 10 min. Melting curve analysis was constructed on all reactions as a straightway for real-time PCR product specification and identification. Agarose gel electrophoresis was applied to confirm specificity. cDNA was synthesized, and control PCR assay was conducted in the absence of reverse transcriptase to excluded contamination in the total RNA preparation. In all samples, no further bands were detected. ΔΔ Ct method was used to analyze the results (fold changes). An 18S rRNA was considered as a ‘housekeeping gene’ for various gene expressions of the samples.
On d 35, blood samples (10-mL from jugular vein puncture) was taken by a vacutainer tube coated with sodium heparin (Becton Dickinson, Franklin, NJ, USA) from the selected pigs (2 pigs per pen around the average BW). The plasma was separated by centrifugation (3,000×g for 15 min at 4°C) and stored immediately at −20°C until required for further analysis including total cholesterol, high-density lipoprotein (HDL), low-density lipoprotein (LDL), triglyceride, white blood cell, red blood cell, lymphocytes, and cortisol). Blood profile analyzed using blood analyzers (HEMAVET, Drew Scientific, Oxford, CT, USA).
The 12 finisher pigs from each treatment (around the average BW; 2 pigs per replicate) were weighed, then euthanized and prepared for carcass evaluation. Carcass samples were split down from the dorsal midline, weighed, and chilled overnight. After chilling at 4°C for 24 h, LD between the 10th and 11th ribs area and backfat thickness (10th rib; three-quarters of the distance along the LD toward the belly) were examined. After slaughtering, initial pH (pH 45 min) in the muscle (muscularis LD) was evaluated at the last rib by a pH meter (IstekNeoMet 77P, Istek Inc, Seoul, Korea). The ultimate pH was obtained at 24 h and 48 h after slaughter. Minolta CR-310 (Yasuda Seiko Instrument Co., Tokyo, Japan) was applied to evaluate the color score among visual scores, redness (a*), lightness (L*), and yellowness (b*) at 24 h of refrigerated storage (Mohammadi Gheisar et al., 2016). The drip loss measurement was carried out on the sample slices (approximately 100 g weight and 2.54 cm thickness). Slice samples were weighed and then kept in sealed polyethylene bags at 4±0.8°C. The samples were used for drip loss decantation, and after this, the samples were weighed again to measure final drip loss as a percentage (Shim et al., 2018). Cooking loss was evaluated by water cooking (in vacuumpack bags) of the meat samples (200 g and 2.54 cm thickness) at 81°C with an inner temperature of 73°C. Before weighing, the meats were chilled and kept at 25°C. The calculation of cooking loss was performed according to the weight of the initial sample as explained by Hosseindoust et al. (2016). To evaluate the shear force, porks were cooked at 80°C. After this, the porks were kept at 25°C. Five rectangular blocks cut (1 cm×1 cm) with parallel direction to the muscle fibers were divided from cooked samples. A texture analyzer was applied to measure the required force (TA-XT2i, Stable Microsystems Ltd., UK).
The experimental values were analyzed by GLM procedure of SAS Statistics (SAS Institute Inc., Cary, NC, US). The difference of means was tested by Tukey’s multiple range test. A significant difference was expressed either p<0.01 or p<0.05, however p-values 0.05 to 0.1 were sometimes given to indicate if the values are tended to differ.
Results
Among saturated FA (Table 4), no difference was detected for the content of lauric acid, myristic acid, and palmitic acid (p<0.05). However, with the increase of n-6:n-3 ratio in the pigs diet, the content of stearic acid was increased (p<0.05) in adipose tissue. Among monounsaturated FA, a decreased (p<0.01) concentration of palmitoleic acid was observed in LD muscle of pigs fed linseed supplemented diets (ratios of 4:1 and 2:1). The concentration of oleic acid in adipose tissue was not influenced by the treatments. There was no significant difference between the treatments in the linoleic acid concentration of LD muscle. However, pigs fed dietary n-6:n-3 ratio of 4:1 and 2:1 had greater (p<0.05) α-linolenic acid concentration of LD muscle than the control pigs. The concentration of short-chain fatty acids (SFA) was decreased (p<0.01) in pigs fed linseed supplemented diets (ratios of 4:1 and 2:1). However, the total MUFA concentration was unaffected. Additionally, pigs fed dietary n-6:n-3 ratio of 4:1 and 2:1 had greater (p<0.05) concentration of PUFA and lower n-6:n-3 ratio than that of the control pigs.
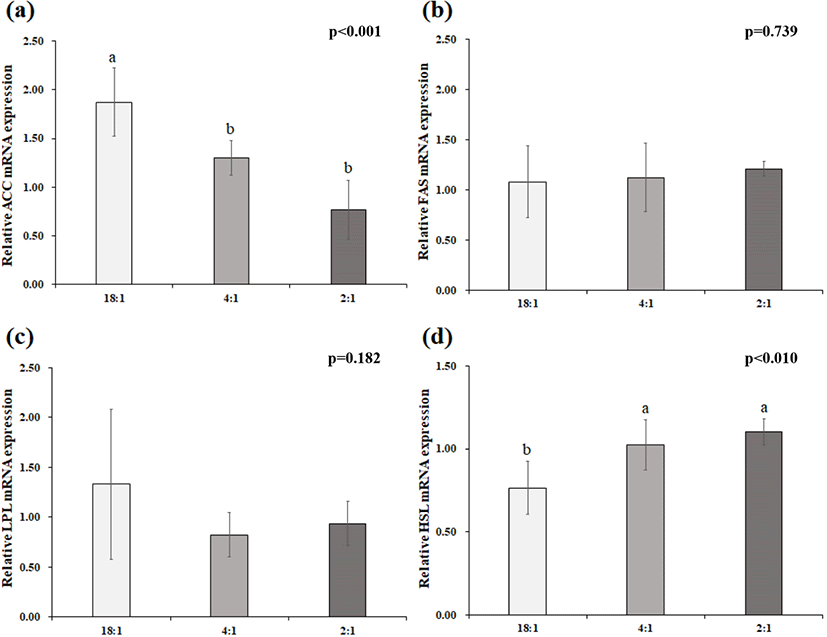
The expression of ACC, LPL, FAS, and HSL in adipose tissue is presented in Fig. 1. The relative expression level of the ACC gene was decreased (p<0.05) in pigs fed 4:1 or 2:1 diets compared with the control. However, no difference was shown for the relative expression of the FAS and LPL genes (p<0.05). The relative gene expression level of HSL was greater (p<0.05) in pigs fed 4:1 or 2:1 diets compared with the control.
In pigs fed 2:1 and 4:1 diets, total cholesterol levels increased (Table 5). However, the concentration of HDL, LDL, and triglyceride in blood were not affected by the treatments.
Carcass characteristics (dressing percentage, backfat thickness, and Loin eye area) were not influenced by different n-6:n-3 ratios (Table 6). Longissimus muscle pH (pH at 45 min, 24 h, and 48 h post-slaughter) and color parameters (Lightness, redness, and yellowness) showed no difference between treatments. Meat drip loss and shear force were not influenced by the diets, however, meat cooking loss was decreased in linseed supplemented diets (2:1 and 4:1 ratios).
The ADG, FI, and GF of finishing pigs fed different dietary n-6:n-3 ratio is shown in Table 7. Supplementing the dietary n-6:n-3 ratios of 4:1 and 2:1 showed greater (p<0.05) final BW and ADG than pigs fed the control diet. No significant variation was detected in FI and GF among the treatments.
Discussion
Several researchers have previously identified that the source of fat in the diet influences the composition of FA in tissues (Corino et al., 2002; Enser et al., 2000). Among the oil sources, it is believed that the supplementation of linseed oil changes the FA composition of adipose tissues in pigs (Guillevic et al., 2009; Kim et al., 2014; Wood et al., 2008). Therefore, accurate information about the ratio of FA in tissues and physical characteristics of meat are required. In this study, the 4:1 and 2:1 treatments showed a higher α-linolenic acid concentration nearly 4 fold in adipose tissue, whereas palmitoleic acid (C16:1c-9) concentration of SFA was reduced accordingly in comparison to pigs fed the control diet. In agreement, Leikus et al. (2018) reported an improvement in the content of essential FA in adipose tissues of finishing pigs fed linseed. Additionally, Duran-Montgé et al. (2009) indicated that the addition of linseed into diet showed a greater ratio of linolenic acid in adipose tissue of pigs. A higher ratio of PUFA and α-linolenic acid in adipose tissues of pigs fed 30 g/kg linseed may be attributed to the higher dietary content of PUFA. Because of the much higher α-linolenic acid concentration of adipose tissue in linseed supplemented diets, it can be reasonably postulated that this nutritional improvement may significantly affect human health. Therefore, it is possible to manipulate the composition of FA in adipose tissue even in a short period of 35 days. In our study, even the 4:1 ratio significantly decreased n6:n3 ratio. Our results show that linseed even at a low level (15 g/kg) can be added to the diet to alter the FA content of adipose tissue in meat to produce healthier food for consumers.
The rate of FA biosynthesis in adipose tissue can be alerted by regulating the expression of lipolytic enzymes (LPL and HSL) or lipogenic enzymes (FAS and ACC) (Clarke 1993; Zhao et al., 2010). Acetyl CoA carboxylase is a determinant factor in FA oxidation or synthesis through the de-novo pathway (Doran et al., 2006); whereas, FAS is a crucial factor to maximize the de-novo FA production in tissues (Bee 2001; Clarke 1993). This study showed that the change in dietary n6:n3 ratio did not affect the expression of FAS genes; however, low n6:n3 ratio diets down-regulated the ACC expression in adipose tissue. Duran-Montgé et al. (2009) reported that supplementing 100 g/kg linseed to pig diet showed a higher expression of ACC in adipose tissue compared to high dietary n6:n3 ratio, but no effect was observed on FAS gene expression in adipose tissue. The down-regulated ACC gene expression indicates that there is a reduced capacity of de-novo FA synthesis in pigs fed diets with a high n6:n3 ratio. In addition, LPL is a key enzyme for LDL and triglycerides hydrolysis in chylomicrons to utilize free FA in tissue; but HSL is associated with FA catabolism for oxidation and exportation of intracellular triacylglycerol (Kim et al., 2014). The current results obtained in this study indicated that the dietary supplementation of linseed resulted in an up-regulated expression of HSL in pigs, but the source of fat in the diet showed no change was the gene expression of LPL in adipose tissue. Therefore, it can be suggested that the reduction of dietary n6:n3 ratio increases the rate of free FA release in adipose tissue and regulates the lipolysis and mobilization of stored FA in adipose tissues.
The result of the current study showed lower blood total cholesterol in pigs fed linseed (4:1 and 2:1 diets). The positive association between PUFA and blood total cholesterol in the present study is compatible with those of human studies that used high dietary PUFA to decrease blood cholesterol (Horrobin et al., 1983), although the results of adding linseed into the diet among animal-based studies have been inconsistent (Kouba et al., 2003). Therefore, the lower blood cholesterol may theoretically imply the better health status of pigs.
The present study showed no clear relationship between dietary linseed and carcass characteristics such as dressing percentage, backfat thickness, and loin eye area, but linseed supplementation to the diet significantly decreased cooking losses systematically across both level treatment groups. These effects of dietary linseed inclusion are in contrast to the results reported for gilts and barrows by Juárez et al. (2011) who showed no difference in pork cooking loss between treatments with different dietary linseed supplementation. The significant cooking loss differences for linseed-included diets were unexpected and no studies were showed similar results with similar dietary treatments for cooking loss parameter. The difference shown in this study was small, however, it would be expected to have a positive effect on meat quality. Overall, as there was no difference between treatments for the other meat quality characteristics such as meat color, pH, drip loss, and shear force, it can be concluded that dietary linseed at 3% had no adverse impact on the meat quality characteristics measured.
This study confirms the possibility of increasing n-3 PUFA content in adipose tissues with supplementation of linseed to the diets without any adverse influences on meat quality characteristics or gain to GF of finisher pigs. In addition, dietary supplementation of linseed showed even a greater final BW in pigs. These findings are in agreement with the reports of a previous study (Juárez et al., 2011), which showed an improved ADG and FI in pigs fed linseed. Conversely, several studies reported no influences of dietary linseed on ADG, FI, or GF of pigs (Guillevic et al., 2009; Kim et al., 2014; Upadhaya et al., 2015). These variations may be related to the differences in the composition of diet, feeding periods, or levels of linseed. Several studies have shown that the low levels of linseed (less than 5%) or short feeding duration (less than 60 d) may not improve growth performance (Guillevic et al., 2009; Kouba et al., 2003). This is in contrast to the result of the present study that showed a significantly greater ADG when 3% linseed (2:1) was added to the diet in a period of 35 days. A slightly greater FI in pigs fed linseed may imply that the palatability can also be considered as another effective factor in improving final growth performance.
Conclusions
Decreasing dietary linoleic acid to linolenic acid ratios (4:1 and 2:1) improves the growth performance, linolenic acid content of adipose tissue, and cooking loss. Therefore, linseed, as a dietary linolenic source, can be a suitable alternative to animal fat. Moreover, regarding the insignificant growth performance difference between 4:1 and 2:1 ratios, the 4:1 ratio can be recommended to reduce the cost of diet.