


Introduction
With the recent increase in the national income and the development of the food service industry, the rate of meat consumption has been steadily increasing. In particular, the individual consumption rate of chicken has increased from 6.0 kg in 2000 to 12.8 kg in 2014. In 2005, it became the second-most consumed type of meat after pork (MAFRA, 2015). This rapid increase in the consumption of chicken can be explained by the fact that it is lower in saturated fatty acid content than other livestock products and high in unsaturated fatty acid contents, while also being a source of protein, with over 40% of the total amino acids being essential ones (Chae et al., 2002b; Kim et al., 2015).
Currently, the average most-consumed type of chicken meat in Korea is the broiler, which is an imported, foreign chicken meat type (Lee et al., 2012). It is favored by poultry farmhouses in Korea for its short raising term and its cost-efficiency. The distribution of chicken meat is normally divided into two types: whole chickens and meat by parts. Meat by parts is further divided largely into three parts, and sometimes into six parts if split into smaller parts (Chae et al., 2002c). While the cooking use of each part is different, chicken is highly versatile as a cooking ingredient since it can be cooked with all methods.
Research on chicken in Korea has mostly involved comparative studies of the physicochemical characteristics of various breeds of chicken, including native breeds, crossbred breeds, silky fowl (Korean ogol chicken), meat chicken, Korean chicken, and imported chicken (Ahn and Park, 2002; Chae et al., 2002c; Kim et al., 2001; Lee et al., 2012; Lee et al., 2016; Park et al., 2011). There have also been comparative studies of the nutrient components of different chicken parts, such as the general components, fatty acids, total amino acids, and minerals, and comparisons of these nutrient components with those in duck, horse, pork, and beef meat (Chae et al., 2002c; Kim et al., 2015; Koh and Yu, 2015;). With respect to studies that have used different cooking methods, there have been comparative research analyses of the general component amino acids and fatty acids in fried chicken breasts and legs cooked in a regular fryer and in an ultrasonic fryer (Jung et al., 2005). In addition, there has been a comparative study of the fatty acids and the fat soluble nutrient components in chicken wings, breasts, and legs cooked using different methods, including boiling, grilling, deep-frying, pan-frying, steaming, roasting, and microwaving (Jeong et al., 2014; Lee et al., 2015). Research conducted outside of Korea has included studies of the effects of different methods to cook chicken breast and duck breast on the formation of heterocyclic aromatic amines (Liao et al., 2010). Furthermore, Joseph et al. (1997) studied the internal temperature and the difference between each type of poultry based on the property changes of the meat according to the internal temperature. Moreover, there has been research on the general components and the specific components of different parts of chicken with different cooking methods and cooking levels (Kumar and Aalbersberg 2006; Oz et al., 2010). However, the current literature on this topic lacks studies on the effects of various cooking methods on the amino acid contents and the retention rate of chicken.
Domestic nutrient content data shows the nutrients of food before cooking (MFDS, 2017; NIAS, 2011). But a great many people eat more cooked food than uncooked food. Since meat such as chicken is mostly cooked, analysis of nutrients after cooking provides important information.
All ingredients were either preserved or lost nutrients during the cooking process. Also, since the type of tissue and moisture content differed for each ingredient, the nutrient content may vary depending on the cooking method. It was difficult to know whether the nutrients were actually preserved or lost, by simply calculating the weight of the nutrient to the appointed weight of the sample. Therefore, it was necessary to study the actual reduction of nutrients through the nutrient retention rate.
This study examined the amino acid component of the 90 kinds nutritional analysis of chicken meat and cooking methods. Therefore, this study was designed to examine and compare the changes in and the retention rates of the protein and essential amino acid components in chicken wings, breasts, and legs cooked using seven different cooking methods. Through this, the study aimed to provide basic data for the establishment of national health nutritional policies.
Materials and Methods
Three different parts (wing, breast, and leg) of broiler (Cobb broiler, 30-32 d of age, and approximately 1.5-1.6 kg in live weight) were purchased from Harim Co., Ltd. The bones and inedible parts were removed from the raw wing, breast, and leg. A total of 1,800 g of meat were prepared for each part. The breast and leg were cut into 3 cm cubes.
Table 1 provides information about the cooking methods. The experiment was repeated 3 times to reduce the risk of errors. The cooking methods (boiling, pan-cooking, pan-frying, deep-frying, steaming, roasting, and microwaving) were as follows. After cooking, the parts were put in a sieve to remove water or oil for 2 min.
Boiling: Set the induction range (DIH-261 DC, Daeryung, Korea) to 2,500 W. After boiling 1,000 mL of distilled water and lowering it to 1,600 W, add the chicken and cook for 8 min.
Pan-cooking: Set the induction range (DIH-261 DC, Daeryung, Korea) to 2,500 W. After cooking for 3.5 min on each side, put in the sieve for 2 min.
Pan-frying: Pan-fry using 20 mL of refined oil (18L, Beksul, Korea) for 4 min on each side. Set the induction range (DIH-261 DC, Daeryung, Korea) to 2,500 W.
Deep-frying: Set the electric deep-fryer (DK-201, Delki, China) to 180°C, cook for 7 min.
Steaming: Place 1 L of distilled water in a steamer (25 *15 cm, Living Art, Korea) and bring to the boil with an induction range (DIH-261 DC, Daeryung, Korea) of 1,600 W. Cook for 5 min on each side.
Roasting: Cook at 170°C for 7.5 min on each side in an oven (FSCCWE61, FUJIMAK, Germany).
Microwaving: Cook for 7.5 min on each side in a microwave oven (RE-GT700ST, Samsung, Korea).
The protein contents of the samples were analyzed using the Kjedahl method (AOAC, 1995). The amino acid contents were determined according to the procedures described by the AOAC (2005). About 1.0 g of each sample was weighed into a protein digestion tube. 10 mL of 6 M HCl were added, and nitrogen gas was also added to displace the oxygen. The protein digestion tubes were sealed and hydrolyzed at 115°C for 24 h. After completion of the hydrolysis, the solutions were opened, placed in a 50 mL constant volume flask, and adjusted with distilled water. The solutions were then filtered, and 1 mL of the filtrate was taken and adjusted to 10 mL. All of the analysis samples were filtered through 0.2 µm membrane filters prior to the amino acid analysis. An auto-amino acid analyzer (AAA L-8900, Hitachi, Japan) was used for the analysis. The column was an ion exchange column packed with Hitachi custom ion exchange resin (4.6 × 60 mm), and the mobile phase was a ninhydrin buffer solution from Mitsubishi (Japan).
The term “processing factor” refers to the increase or decrease that occurs during a process. It is calculated by measuring the weight of a sample before and after cooking and inputting the measurements into the following equation.
Nutrition analyses analyze the nutrients contained in samples of a specific weight. As the weight changes before and after cooking, it cannot be assumed that the same amounts of nutrients are distributed equally before and after cooking. Therefore, the following equation (Murphy et al., 1975) needs to be applied in consideration of the different weights before and after cooking. An over-100 retention factor is given as 100 (USDA, 2007).
All statistical analyses were performed as two-way ANOVA (two-way analyses of variance) and one-way ANOVA (one-way analyses of variance) with PASW Statistics Ver. 18.0. To assess the interaction effects of the component content change, we analyzed the data using a two-way ANOVA. In cases in which the one-way ANOVA revealed significant differences (p<0.05), a post-hoc test was conducted using Duncan’s multiple-range test. Principal component analysis (PCA) was used as an extraction method, and was performed on the correlation matrix. The PCA calculation was done with the XLSTAT software (XLSTAT ver. 2016.02. 28540, Addinsoft, USA).
Results and Discussion
Table 2 shows the cooking processing factors for the different chicken parts. It demonstrates that the weight of every meat part was reduced after cooking. This reduction in weight after cooking is due to the contraction of the muscular fibers and myomeres, regardless of the cooking method. The results further show that the weight reduction rate increased with the cooking time and the temperature (Bowers et al., 1987; Joseph et al., 1997).
1)Mean±SD. Means with different superscript capital letters in the same column and small letters in the same row were significantly different between groups at p<0.05 level by Duncan's multiple range test.
According to the cooking method, the chicken wings, breasts, and legs showed reduction rates of 61 to 76%, 61 to 72%, and 54 to 78%, respectively. Among all of the cooking methods, the chicken wings lost the most weight after deep-frying, while the chicken breasts and legs lost the most weight after roasting. In particular, steaming showed the lowest weight reduction rate of all the cooking methods for chicken legs, and all other cooking methods except for steaming showed an overall increase in the weight reduction rate as compared with that for the other meat parts. The results of previous studies have shown an approximate 11 to 30% reduction rate according to the cooking methods, and a higher weight reduction rate for leg meat than for breast meat. The present research matched some of these results (Jaturasitha et al., 2008; Jeon et al., 2014; Liao et al., 2010). The differences with previous studies seemingly arose from the experimental conditions and methods.
The present study analyzed the protein contents and a total of nine types of amino acids in each chicken meat part and for each cooking method. Table 3 summarizes the two-way analysis of variance for the effects of the meat parts and of the cooking methods on the protein and amino acids content changes. Overall, the protein and amino acids demonstrated a greater content change according to the meat part and the cooking method. While the protein and amino acids seemed to be more affected by the meat part than by the cooking method, arginine seemed to be more affected by the cooking method than by the meat part.
* p<0.05; ** p<0.01; *** p<0.001. NS, Not significant.
The changes observed in the protein and amino acid contents according to the chicken parts and the cooking methods were analyzed with a variance analysis. The results are presented in Table 4. The chicken wings showed content differences in amino acids – except for more methionine – according to the cooking methods. In chicken legs, the content differences in amino acids – except for leucine – were more pronounced according to the cooking methods. In chicken breasts, arginine, histidine, methionine, and valine showed differences by cooking method, and the content amount increased after cooking. In chicken wings, pan-frying, deep-frying, and microwaving yielded an overall higher content than other cooking methods. With respect to chicken legs, grilling, panfrying, deep-frying, roasting, and microwaving showed a higher content amount. Finally, in chicken breasts, there was no apparent content tendency by cooking method. Some authors reported that lysine was lost due to the formation of Maillard reaction products by heating, while threonine was converted to other compounds (Jannat-Alipour et al., 2010; Oduro et al., 2011; Sikorski, 2001). Sikorski (2001) reported that the pyrolysis rate of sensitive amino acids generally increases temperature and in the presence of oxygen and reducing saccharides. However, in this study, amino acid content increased, reducing water retention capacity to thermal denaturation of the protein. The resulting loss of moisture enhanced the contents of other nutritive components in the cooked meat (Lopes et al., 2015; Tornberg, 2005). The degree of protein denaturation was different for each cooking method temperature and chicken part, demonstrating a difference in protein and amino acid content.
1)Abbreviation denotes BO, Boiled; PC, Pan cooked; PF, Pan fried; DF, Deep fried; ST, Steamed; RO, Roasted; MI, Microwaved.
2)Mean±SD. Means with different superscript capital letters in the same column and small letters in the same row for each protein and essential amino acids were significantly different between groups at p<0.05 level by Duncan’s multiple range test.
Among the amino acids, histidine showed a content difference according to the meat part with all cooking methods, and the content was comparatively higher in chicken breasts than in other parts. Kim et al. (2015) found that chicken breasts contain more histidine than chicken legs. This matches the findings of the present study.
Among the essential amino acids in chicken, the contents (g/100 g) of arginine, leucine, and lysine are found within ranges of 1.08 to 3.64, 1.47 to 5.46, and 1.52 to 4.24, respectively. It is well-known that the contents of these essential amino acids are higher than those of other essential amino acids (Chae et al., 2002a; Chae et al., 2002b; Kim et al., 2015; Koh and Yu, 2015; Lee et al., 2012; Na et al., 2011; Park et al., 2011). It is also known that the overall amino acid contents are higher in chicken legs, wings, and breasts, in that order (Chae et al., 2002c).
After cooking, the protein content increases regardless of the meat part (Kumar and Aalbersberg, 2006). With respect to the amino acid content, this study found differences in the content amount according to the cooking method and to the temperature during cooking (Domínguez et al., 2015; Lopes et al., 2015; Wilkinson et al., 2014).
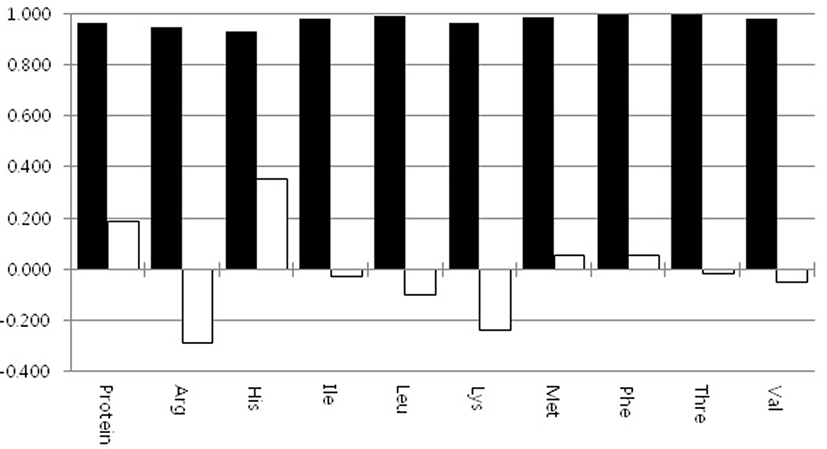
Figs. 1 and 2 showed the results of the principle component analysis that was conducted to explain the differences in the amino acid contents of the chicken samples according to the meat part and the cooking method. The total explanation power for the first principle component (PC 1) and the second principle component (PC 2) was 97.9%. There were clear distinctions between each chicken part. The differences before cooking and after cooking were also clear, and there were differences between boiling and steaming versus grilling, pan-frying, deep-frying, roasting, and microwaving (except for the wings). The differences found were greater than those based on the cooking method for the amino acid content of each part. This showed an identical pattern with the results of the two-way analysis of variance. Among the total amino acids, leucine, methionine, phenylalanine, and threonine were the major amino acids in PC 1, while protein, arginine, histidine, and lysine were the major amino acids in PC 2. For the meat parts, the breast was richer in protein, histidine, methionine, phenylalanine, and threonine than the other meat parts (legs and wings), while the leg was richer in arginine, isoleucine, leucine, lysine, and valine than the other meat parts (wings and breasts). The contents in breasts and legs were higher with roasting than with other cooking methods, while the wings showed comparatively lower content.
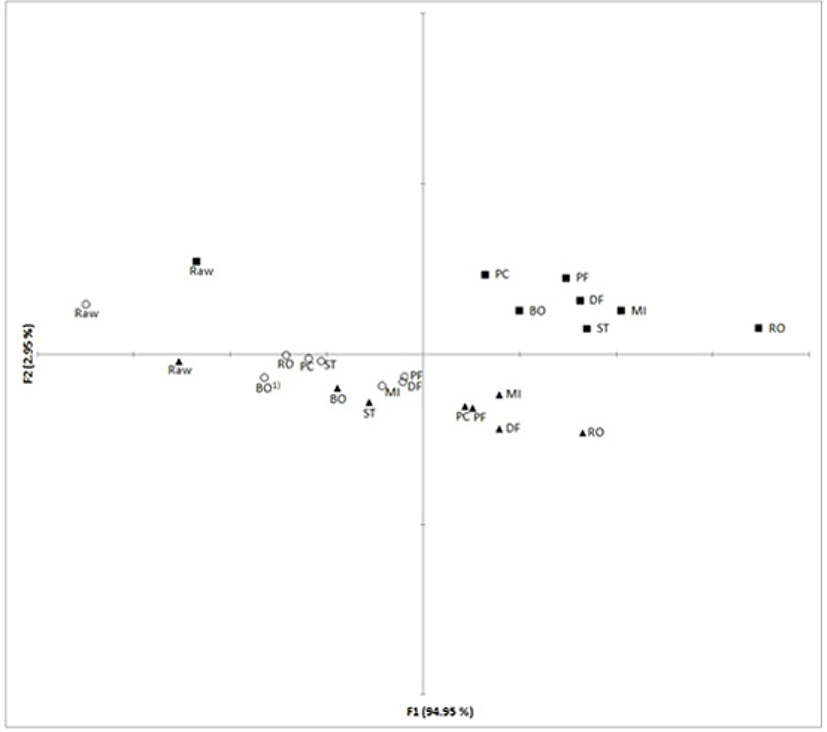
In a study that compared the amino acids according to the cooking time of grape musts purchased from different regions, the amino acid appearance was clearly divided according to the purchased region, while it was also shown that a more consistent appearance was observed as the cooking time increased (Montevecchi et al., 2010). In research results on the amino acid appearance in four types of beans cooked by boiling and pan-frying, the differences depended more on the cooking method than on the type of beans (Im et al., 2016). As such, the results of the present study varied from those of previous studies on similar topics.
Table 5 shows the retention rate of the protein and amino acids in each chicken meat part after cooking. Overall, the retention rate of the amino acids after cooking was highest in the breasts, wings, and legs, in that order. The retention rate ranged from 83 to 100% in wings, from 91 to 100% in breasts, and from 77 to 100% in legs. According to the analysis, the highest retention rate of all amino acids (100% or higher) was achieved by grilling for wings, roasting and microwaving for breasts, and steaming for legs.
Abbreviation denotes BO, Boiled; PC, Pan cooked; PF, Pan fried; DF, Deep fried; ST, Steamed; RO, Roasted; MI, Microwaved.
In lamb, the retention rate of protein is 80 to 90% when cooked using a regular cooking method (Ono et al., 1984). In pork, the persistent rate decreases as the cooking temperature increases, generally when cooked at a temperature of 60°C and 75°C. Histidine and taurine, in particular, have been found to show low retention rates of 69.8% and 52.4% when cooked at 75°C (Wilkinson et al., 2014). Veal show a high retention rate of over 100% for all amino acids when cooked by microwaving, boiling, and grilling, and it has been reported that the cooking method only shows a difference in the leucine rate (Lopes et al., 2015).
Conclusion
The present study showed that when chicken is cooked using various methods, protein and all essential amino acids are affected depending on the meat part and the cooking method. Only arginine was found to be more affected by the cooking method than by the meat part (p<0.01). Overall, the protein and amino acid contents increased after cooking, and the content differences by meat part and by cooking method were found to be different in each of the samples. There was a clear difference in the protein and amino acid contents according to the meat part, and except in chicken wings, there were differences between boiling and steaming versus grilling, pan-frying, deep-frying, roasting, and microwaving. The analysis of the retention rate of each content confirmed that there was a destruction or loss of protein and amino acids during the cooking process; however, the amino acid content was higher than 100% in pan-fried wings, roasted breasts, microwaved breasts, and steamed legs. When the findings about the meat parts and the cooking methods were combined, and in consideration of the content and retention rate, roasted breast had the highest protein and amino acid contents of all the compared samples.