Introduction
The “change-one-factor-at-a-time” method has traditionally been used in experiments with multiple factors. This is a method in which one factor is varied while all other factors are fixed under certain conditions (Logothetis and Wynn, 1989). However, this method does not take all factors into account at the same time. This can lead to unreliable results and incorrect conclusions. Considering all factors simultaneously, response surface methodology (RSM) can better handle experiments for modeling and optimization. RSM is a set of statistical techniques for designing experiments, creating models, evaluating the impacts of factors, and exploring optimal conditions for desirable responses (Myers et al., 2009).
Regarding experimental designs in RSM, central composite designs (CCD; Box and Wilson, 1951) have been used most frequently. A CCD is a three- or five-level design that can fit a second-order polynomial model to data within a cubic or spherical experimental region. For a second-order model to be a good predictive model, it should satisfy some criteria that the p-value of the model ≤ 0.05, the pvalue of the lack of fit > 0.1, and the adjusted R-square ≥ 0.8 (Myers et al., 2009). If the model fitted to the data does not meet these criteria, modeling and optimization results might not be accurate.
However, in reality, it is observed that the models that do not satisfy the above criteria are used in the analyses of response surface experiments. This seems to be because researchers have little knowledge of what to do in such a situation. A remedy in this case is to use a third-order model. Rheem and Rheem (2012) improved a second-order model with a significant lack of fit by adding cubic terms to it. However, cases can exist where a third-order model still falls short of such criteria for a good predictive model. In these cases, there arises a need to use a fullest model that has no lack of fit.
When a spherical CCD is used as an experimental design, fullest models with no lack of fit exist, but they are not unique. However, among them, a balanced model is unique. This article proposes such a model, which is called a fullest balanced model, and how to use it.
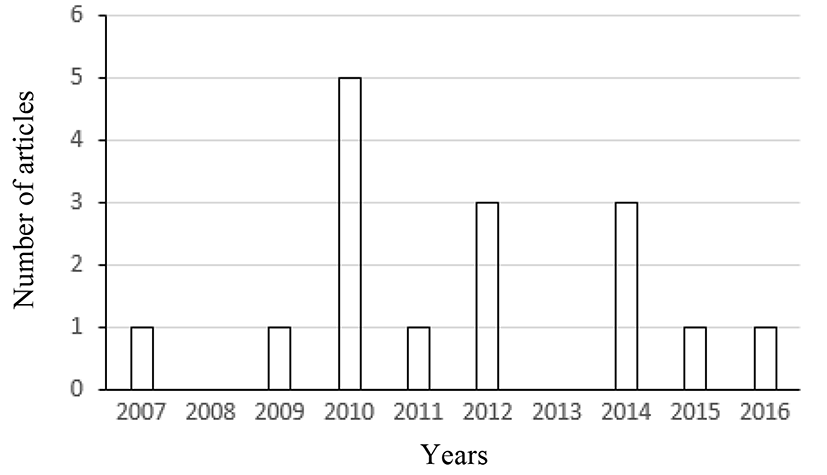
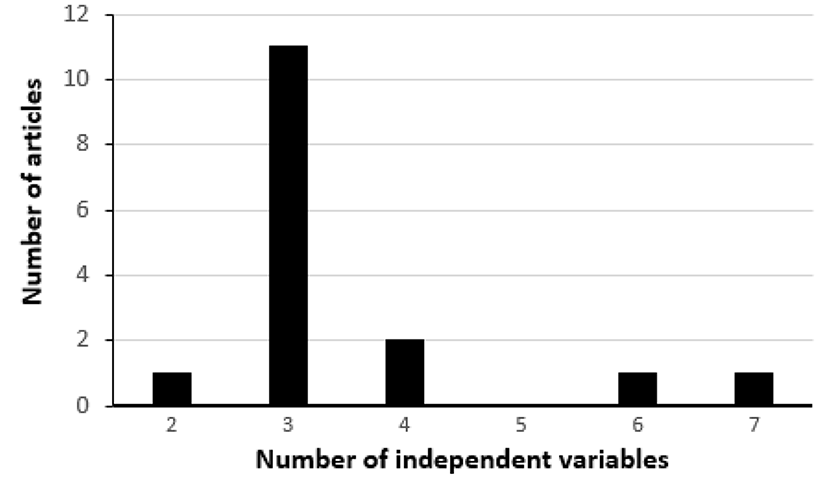
For the last ten years (from 2007 to 2016), sixteen articles using a CCD in RSM were published in the Korean Journal for Food Science of Animal Resources. The number of such articles published each year during that period is shown in Fig. 1. After examining these 16 articles, we found that three independent variables (three factors) were most frequently used in such articles (Fig. 2). Thus, a dataset with three factors, which is in Park et al. (2014) published in the Korean Journal for Food Science of Animal Resources, will be re-analyzed for the illustration of the method suggested in this article.
Materials and Methods
How to use a fullest balanced model will be explained through re-analysis of a dataset described in the article entitled “Application of Response Surface Methodology (RSM) for Optimization of Anti-Obesity Effect in Fermented Milk by Lactobacillus plantarum Q180” authored by Park et al. (2014). In this article, three factors were used in an experiment to model three responses. Among them, the third response, which was anti-adipogenetic activity (%), had the poorest fit of a second-order model. Thus, this response is used as the Y variable in this article. Factors (X variables) in this experiment and their coded and actual levels are given in Table 1.
The dataset to be re-analyzed is shown in Table 2. In this dataset, the experimental design is the CCD for three factors with an axial value of 1.68179 and three center runs. Using this design, to the data, we can fit a second-order model, a third-order model, and a fullest balanced model.
Data were analyzed using SAS software. SAS/STAT (2013) procedures were used for regression modeling. Optimum conditions were found through SAS data-step programming. Plots were generated using SAS/GRAPH (2013).
Results and Discussion
First, the second-order polynomial regression model containing 3 linear, 3 quadratic, and 3 interaction terms was fitted to the data by using RSREG procedure of SAS/STAT. Results of analysis of variance for the second-order model are shown in Table 3.
In Table 3, the p-value of the model = 0.0642 > 0.05, the p-value of the lack of fit = 0.0526 < 0.1, and the adjusted R-square = 0.5654 < 0.8; none of the three criteria are satisfied. Since this second-order model has a poor fit, next we will fit to the data a third-order model that consists of linear, quadratic, cubic, and two-way and three-way interaction terms, anticipating a possible improvement in modeling. Table 4 shows the results of analysis of variance for this third-order model.
In Table 4, the p-value of the model = 0.2627 > 0.05, the p-value of the lack of fit = 0.0230 < 0.1, and the adjusted R-square = 0.5221 < 0.8; none of the three criteria are satisfied. This third-order model is worse than the previous second-order model, let alone better. Now, the lack-of-fit part has 1 degree of freedom, which means that we can add one more term to the model. For the model to be balanced, this additional term needs to contain all of X1, X2, and X3. Then, since the latest term in the model is X1X2X3, the next term to enter the model should be X12X22X32. Now, we add this term to the model, expecting a possible improvement in modeling. Results of analysis of variance for this fullest balanced model are given in Table 5.
In Table 5, the p-value of the model = 0.0281 < 0.05, and the adjusted R-square = 0.9675 > 0.8; two criteria are satisfied. The lack-of-fit part has 0 degree of freedom, which means that this model has no lack of fit. And, the R-square is 0.9959, almost 1. Finally, we have obtained the improved model that will be used for optimization. Letting Ŷ denote the predicted value of Y, we specify this model as
Ŷ = b0 + b1X1 + b2X2 + b3X3 + b11X12 + b22X22 + b33X32 + b12X1X2 + b13X1X3 + b23X2X3 + b111X13 + b222X23 + b333X33 + b123X1X2X3 + b112233X12X22X32
where the coefficients b1, b2, …, b112233 are given in Table 6, which says that X12X22X32 is the most significant term among the model terms.
According to Park et al. (2014), the optimization objective for Y was maximization. Thus, through a search on a grid (Oh et al., 1995), we maximized the model with the coefficients in Table 5. In this experiment, the bounds are −1.682 ≤ Xj ≤ 1.682 for j = 1, 2, 3. In the CCD in Table 2, every design point is under the constraint X12 + X22 + X32 ≤ (±1)2 + (±1)2 + (±1)2 = 3, which makes the design region spherical with the radius . Thus, satisfying these bounds and constraint, we conducted a search on a grid using the SAS data step programming. Here, a search for the maximum on a grid was performed by calculating the Ŷ function over a grid of the values of X1, X2, and X3 with an increment of 0.01 under the bounds −1.682 ≤ Xj ≤ 1.682 for j = 1, 2, 3 and the constraint X12 + X22 + X32 ≤ 3, and then sorting the calculated function values in desc-ending order. The optimum point at which Ŷ is maximized was found this way and presented in Table 7.
| X1 | X2 | X3 | Distance from the origin | Skim milk powder (%) | Incubation temp. (°C) | Incubation time (h) | Anti-adipogenetic activity (%) |
|---|---|---|---|---|---|---|---|
| −0.42 | 0.03 | −1.68 | 1.73196 | 9.58 | 37.09 | 12.86 | 32.6492 |
In Park et al. (2014), the predicted maximum anti-adipogenetic activity was 31%. Their optimum conditions for this maximum were skim milk powder = 8.4677%, incubation temperature = 65.3815°C, and incubation time = 12.8412 h. These maximum and optimum conditions are different from our optimization results. Our predicted maximum was 32.6492%, which was greater than their predicted maximum 31%. A validation experiment is needed to verify the optimization results obtained by this methodology.
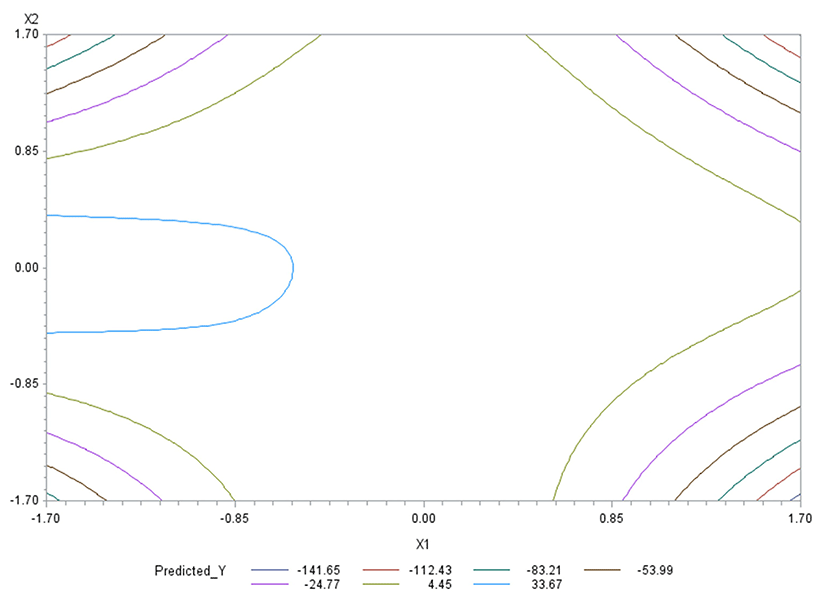
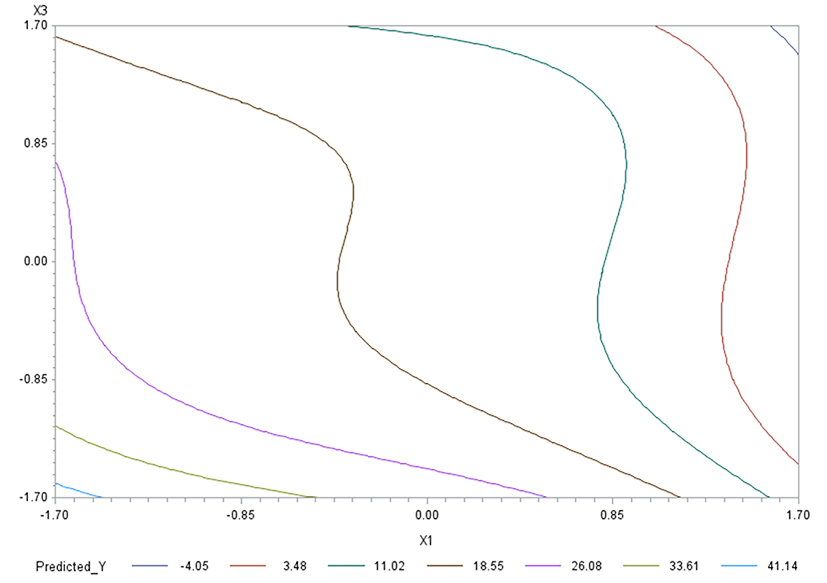
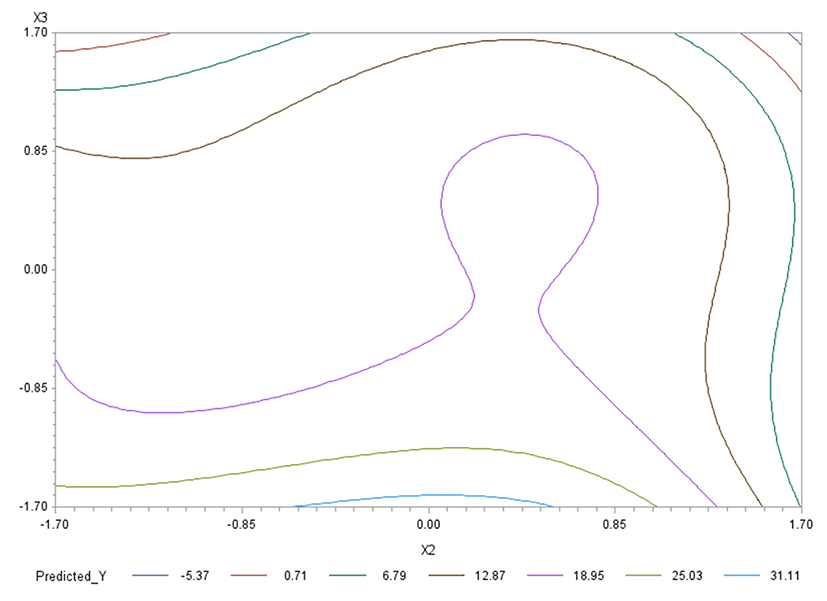
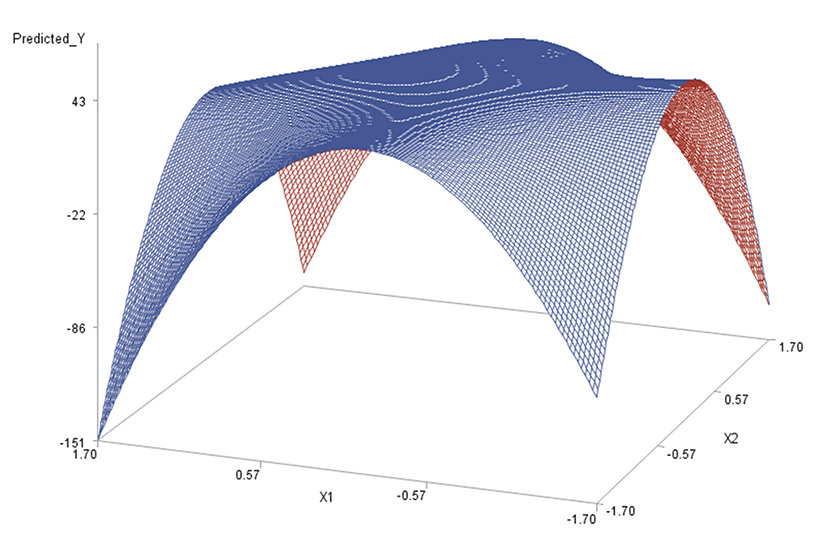
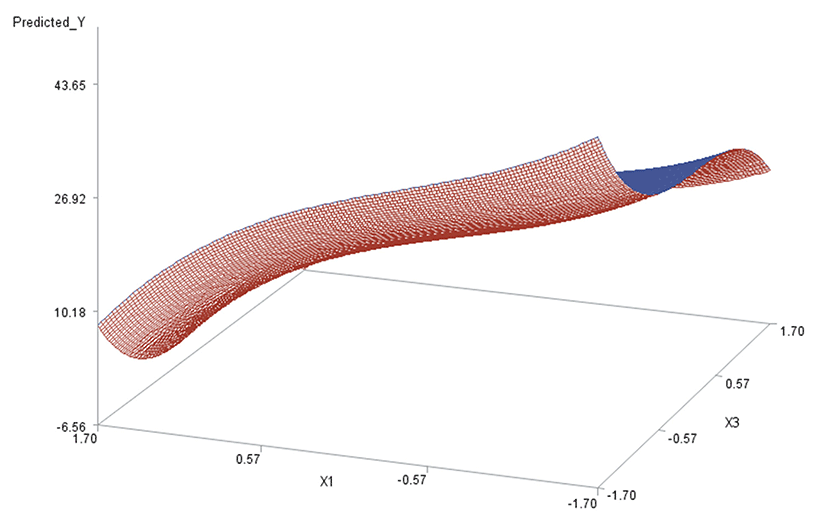
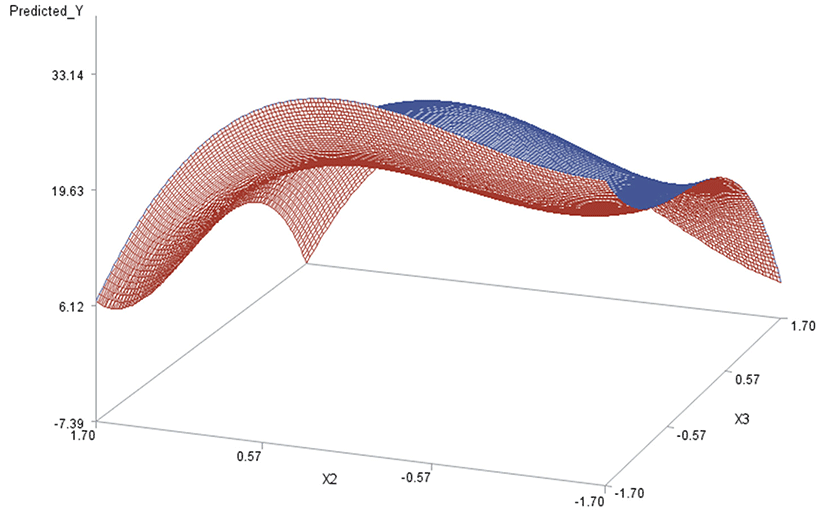
Like in Oh et al. (1995), for any two of the three factors, a three-dimensional (3D) response surface plot was drawn with the vertical axis representing the predicted response and two horizontal axes representing the coded levels of two explanatory factors. In each 3D plot, the factor not represented by the two horizontal axes is fixed at its optimum level. All three 3D plots were produced. Figs. 3 through 5 are such plots.
Two-dimensional contour plots of response surfaces were also drawn with two axes indicating two coded factors. In each contour plot, the factor not represented by the two axes is fixed at its optimum level. All three contour plots were produced. Figs. 6 through 8 are such plots.