Introduction
The use of oil or fat for frying remains one of the most popular methods for the preparation of food around the world, as confirmed by the increasing number of fast food restaurants and at home. Also, edible oil is a source of energy and essential fatty acids (FAs) and serves as a carrier of fat-soluble vitamins (Choudhary and Grover, 2013; Prakash et al., 2015). Fried foods are popular because of their rapid and easy production. Furthermore, fried foods are highly appreciated by consumers because owing to their appealing sensory properties such as color, flavor, texture, and palatability (Andrikopoulos, 2003; Dobarganes et al., 2000; Ro et al., 1998). Regular consumption of deep-fried foods such as french-fries, fried chicken, and doughnuts has recently increased with economic development and a change in eating habits.
Deep frying involves simultaneous heat and mass transfers in the food processing operation by immersing the food as a whole into the hot oil at temperatures of 180℃ or higher (Choe, 2008; Kita, 2002; Weisshaar, 2014). However, during the frying process, oil or fat is often recycled for several batches, allowing moisture and air to be mixed into the hot oil. As a result, these fats and oils undergo thermal and oxidative decomposition, and polymers formed under these conditions are harmful to health (Debnath et al., 2009; Gertz and Klostermann, 2002; Ghidurus et al., 2010).The associated reactions increase the viscosity of the oils, darken their color, increase the foaming, and decrease the smoke point.
Overall, deep-frying deteriorates the quality of the oil. The choice of frying oil or fat depends on many factors such as availability, price, frying performance, flavor, and stability of the product during storage. The most popular oil used for frying livestock products is palm oil (PA) or its fraction, followed by soybean oil (SB), canola oil (CA), and lard (LA). Hydrogenated vegetable oils such as sunflower and rapeseed oil are also very popular (Kristott, 2003; Moreira et al., 1997; Rossi et al., 2007; Saguy and Dana, 2003). Abused frying oils may contain harmful concentrations of degradation products, and so, frying oil quality is also a very important issue concerning food safety and consumers’ health (Farid, 2001; Paul and Mittal, 1996; Seo et al., 2011). In this study, we determined the peroxide value (POV), acid value (AV), and FA contents of samples of four kinds of used frying oils according to consume best ranking (SB, CA, PA, and LA). This study was designed to provide basic data for the regulation of the quality of oils used for frying animal products.
Materials and Methods
The frying oils, SB (CJ company, Korea), CA (CJ company, Korea), PA (Ottogi company, Korea), and LA (Samyang Foods Co., Ltd, Korea), were purchased from a local store (Korea). The chicken nuggets were purchased from a local store (Harim & Co., Ltd., Korea).
Deep-frying was carried out in commercially available electrical fryers (TF:20, DongYang Magic Co., Ltd, Korea). All frying oil were used for frying at a chicken nuggets at 170-180℃ for 3 min every 10 cycles per day, repeated 10 d. Samples of used frying oil (10 mL) were collected, and all samples were stored at −20℃ for further chemical analysis.
For lipid extraction, 2.5 g of each sample was used for a modified version of the Folch method (Myriam et al., 2013), using a chloroform-methanol mixture (25 mL, 2:1 v/v). The mixture was homogenized (2,500 rpm, 30 min) and ultra sonicated for 20 min, and then saturated NaCl solution (10 mL) was added to it. The suspension was then centrifuged for 20 min at −4℃ (4,000 rpm). The chloroform phase was recovered, and then transferred to a 25 mL round bottom flask. The extracts were then dried at 45℃ under reduced pressure (Kim et al., 2016). After evaporation, approximately 0.5 g of extracted oil from each sample was treated with a methanolic solution of sodium hydroxide (25 mL, 0.5 N) at 85℃ for 10 min. Boron trifluoride (BF3-MeoH 9 mL, 14%) was then added drop wise to this sample over 2 min in a cooled flask. Hexane (4 mL) was added to the cooled flask and the mixture was agitated. The sample was then added to a mass up saponification flask using a saturated NaCl solution and left for 3 min. The FAs were then extracted with hexane after adding 1 g of anhydrous sodium sulfate.
Gas chromatography (GC) was carried out with a gas chromatograph (Agilent 7890) equipped with a 100 × 0.25 mm i.d. (df = 0.2 μm) SP-2560 capillary GC column (Supelco 24056, USA) and a flame ionization detector (FID) was used to separate and detect the fatty acid (Grob et al., 2003; Park et al., 2013). A running time of 67 min was employed for each sample solution. The following instrumental conditions were employed for GC-FID analysis: injection volume of 1 μL and nitrogen carrier gas flow rate of 1.0 mL/min at a split ratio of 50:1 with constant flow control. The injector and detector temperature used was 250℃. The initial oven temperature was maintained at 180℃ for 40 min and then gradually increased to 230℃ at a rate of 3℃/min, after which it was maintained at 230℃ for 10 min. The fatty acid methyl esters were identified by comparing their retention times and mass spectrum with a standard FAME (Fatty acid methyl esters) mixture (United States Pharmacopeia (USP), USA).
The POV was determined by a standard iodometric titration procedure following the AOAC Official Method (2002). The AV was determined by an alcohol potassium hydroxide (KOH) titration using the AOAC Official Method. Chemicals and solvents required for all the analyses were purchased from Junsei Chemical Co. Ltd.
The permitted freshness of the oils and their use-by date were estimated as the earliest date when each quality criterion reached the quality limit (correlation coefficient, r2>0.9) as stated by Ministry Food and Drug Safety (MFDS) regulations. The MFDS regulations state that the AV and POV should not exceed 2.5 and 50, respectively, for used frying oil. Furthermore, the regulations state that the AV and POV should not exceed 50 and 60, respectively, for fried food. Therefore, each date of the quality limit being reached was established as the value by which “x” was calculated by substituting the quality limit “y” in the regression equation relating the frying times and representative values of the factor (Utama et al., 2016).
All analyses were run in triplicate. The average value and standard deviation were calculated using Microsoft Excel. The data were analyzed using Statistical Packaging for the Social Sciences (SPSS) for Windows version 10.0. The statistical probability was considered to be significantly different at the level of p<0.05.
Results and Discussion
Fatty acid composition is widely used for the establishment of oxidative stability and the authenticity of the oil. So, the impact of the fatty acid composition on lipid oxidation was evaluated by measuring its relative percentage content after 101 frying cycles. SB was composed of 8.91% palmitic acid (C16:0), 2.28% stearic acid (C18:0), 58.68% oleic acid (C18:1), 18.65% linoleic acid (C18:2), and 7.27% linolenic acid (C18:3). CA was composed of C16:0 (9.08 %), C18:0 (2.31%), C18:1 (58.61%), C18:2 (18.56%), and C18:3 (7.21%). PA (partially hydrogenated fats) was composed of C16:0 (45.84%), C18:0 (4.90%), C18:1 (34.74%), C18:2 (10.25%), and C18:3 (1.08%). LA contained C16:0 (29.56%), C18:0 (10.86%), C18:1 (40.49%), C18:2 (10.32%), and C18:3 (0.48%). The unsaturated fatty acid (USFA) composition in each type of fried oil was also investigated: SB, 86.15 g/100 g; CA, 85.93 g/100 g; PA, 46.54 g/ 100g; and LA, 54.18 g/ 100 g. PA had the highest composition of saturated fatty acid (SFA) (52.98 g/ 100 g), followed by LA (43.69 g/ 100 g), CA (12.87 g/ 100 g), and SB (12.87 g/100 g). Son and Kang (2012) reported the content of SFA and USFA of used frying oil after frying 110 chicken nuggets to be 16.08 and 83.26 g/ 100 g, respectively. USFA of SB and CA was of a high percentage after 101 frying cycles. This is due to double bonds being broken owing to polymerization, cyclization, and oxidation reactions, as well as the incorporation of saturated fats from the fried foods into the frying oil (Lima and Goncalves, 1994). Otherwise, PA and LA were the oils with the highest contents of SFA.
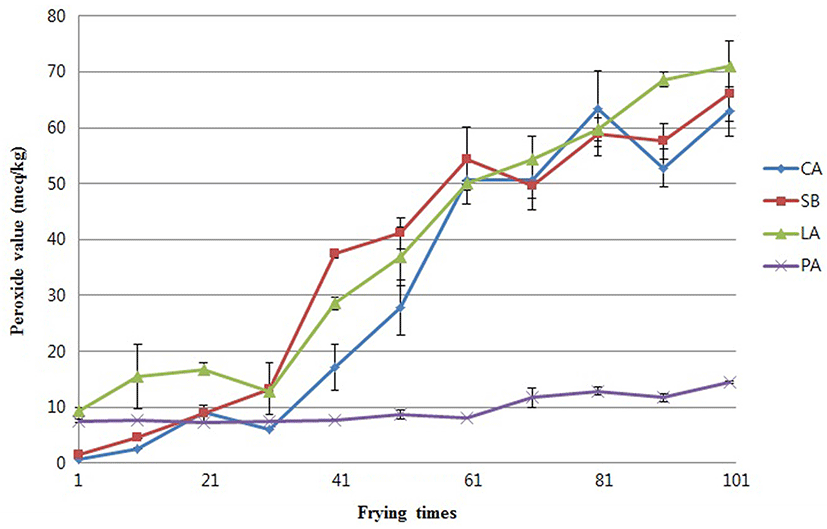
The results showed that after 1-101 frying cycles, the POV of the used frying oil for chicken nugget increased from 1.46 to 66.03 in SB, 9.39 to 62.92 in CA, 0.76 to 71.04 in LA, and 7.08 to 15.48 in PA (Fig. 1). POV is a useful biomarker that indicates the initial stages of oxidation. Debnath et al. (2012) reported that the POV is a good indicator of lipid oxidation under normal conditions. Peroxides are the initial reaction products of lipid oxidation and responsible for primary oxidation. However, at high temperatures, the hydroperoxide breaks down and subsequently forms secondary oxidation products during cooling. Therefore, the POV increases with increased frying time, irrespective of the frying oil, except in PA.
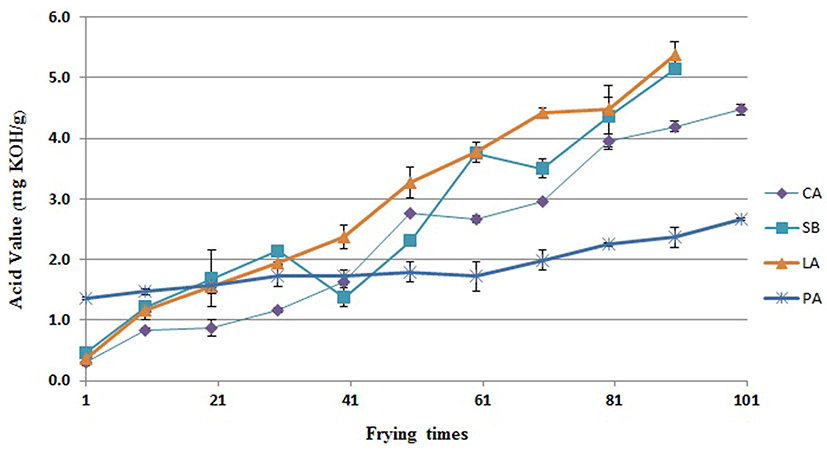
After 1-101 frying cycles, the AV of the frying oils were found to increase from 0.47 to 5.14 in SB, 0.36 to 5.37 in LA, 0.30 to 4.47 in CA, and 1.35 to 2.66 in PA (Fig. 2). AV increases with increase in frying cycles regardless of the type of oil (Lee et al., 2013).Thus, oxidative changes in the different culinary fats are greatly affected by factors related to their chemical composition. As for the minor degradation compounds, it was observed that they varied depending on the frying time and oil type.
When the frying oils SB, CA, PA, and LA for frying chicken nuggets during a 10-day period (10 cycles per day), quality changes with respect to the AV and POV were especially prevalent. The freshness standard of used frying oil for food except animal products is generally defined as the date when the quality criteria, which are established specifically for each product, reach the quality limit. The legal quality criteria are published by the Codex Alimentarius. However, freshness standards of used frying oil for chicken nuggets are not regulated. Therefore, the quality limits associated with them were established based on the law (MFDS). Quality criteria, regression equations, and data for the quality limit of frying oils are shown in Table 2. In the case of SB, the data for quality limits of the AV quality limit value was reached in an estimated 41 d and that for POV in 70 d. The corresponding values for LA, CA, and PA were 38 and 67 d, 53 and 71 d, and 109 and 620 d, respectively, obtained by the R2 of regression equations between each quality criteria (y) and frying times (x). Table 2 shows the freshness standard, estimated as the earliest date each quality criterion reached a quality limit (R2=0.9). The freshness standard of the oils for frying chicken nuggets was estimated to be reached after 41, 38, 53, and 109 frying cycles for SB, LA, CA, and PA, respectively.
SB: soybean oil; CA: canola oil; PA: palm oil; LA: lard; SFA: saturated fatty acids; MUFA: monounsaturated fatty acids; PUFA: polyunsaturated fatty acids; USFA: unsaturated fatty acid
1)SB: soybean oil; 2) CA: canola oil; 3) PA: palm oil; 4) LA: lard


