ARTICLE

Effect of Multiple Freeze-Thaw Cycles on Myoglobin and Lipid Oxidations of Grass Carp (Ctenopharyngodon idella) Surimi with Different Pork Back Fat Content

Xiaolan Shang1,2,3https://orcid.org/0000-0002-1289-9768, Xunyou Yan1https://orcid.org/0000-0001-8759-4945, Qiuling Li1,2https://orcid.org/0000-0002-1567-5559, Zizheng Liu1https://orcid.org/0000-0002-3200-4474, Anguo Teng4,*https://orcid.org/0000-0002-3615-1447
Author Information & Copyright
1College of Life Science, Langfang Normal University, Langfang 065000, China
2Hebei Key Laboratory of Animal Diversity, Langfang 065000, China
3Langfang Key Laboratory of Microbial Fermentation, Langfang 065000, China
4College of Food Science and Engineering, Tianjin University of Science and Technology, Tianjin 300457, China
*Corresponding author : Anguo Teng, College of Food Science and Engineering, Tianjin University of Science and Technology, Tianjin 300457, China, Tel: +86-22-60912390, Fax: +86-22-60912390, E-mail: tag@tust.edu.cn

© Korean Society for Food Science of Animal Resources. This is an Open-Access article distributed under the terms of the Creative Commons Attribution Non-Commercial License (http://creativecommons.org/licenses/by-nc/3.0) which permits unrestricted non-commercial use, distribution, and reproduction in any medium, provided the original work is properly cited.

Received: Jun 14, 2020 ; Revised: Aug 06, 2020 ; Accepted: Aug 17, 2020

Published Online: Nov 01, 2020

Abstract

Fresh grass carp was used to produce surimi and 50 g/kg, 100 g/kg, or 150 g/kg pork back fat was added. The water distribution, thiobarbituric acid reactive substances (TBARS), myoglobin oxidation, color parameter (L*, a*, and b*), heme and non-heme iron content of samples were determined to analyze the effects of different fat content on the oxidation of myoglobin and lipids during multiple freeze-thaw cycles of grass carp surimi. Both multiple freeze-thaw cycles and increased fat content lead to an increase in TBARS, a blue shift in the absorption peak of myoglobin porphyrin, a decrease in heme iron content, and an increase of non-heme iron content. Repeated freeze-thaw caused a decrease in immobilised water content and L*, and caused an increase in a* and b*. Increased fat content caused an increase in immobilised water content, L* and a*, and caused a decrease in b*.

Keywords: freeze-thaw cycles; pork back fat; grass carp surimi; water distribution; myoglobin

Introduction

Freezing is the most widely used storage method for aquatic products, maintaining the quality of aquatic products and extending product shelf life. However, if the cold chain system is not standardized, aquatic products may experience freeze-thaw cycles during steps of storage, transportation, retail and sales (Srinivasan & Hultin, 1997). When the number of freeze-thaw cycles increases, the edible quality of aquatic products will become lower. In the 2015 study of Nikoo et al., Japanese sea bass surimi went through six freeze-thaw cycles to compare peroxide value (PV), thiobarbituric acid reactive substances (TBARS), protein carbonyl and total sulfhydryl content before and after the cycle, it is found that PV, TBARS and protein carbonyl content increased and total sulfhydryl content decreased with the increase of the number of freeze-thaw cycles (Nikoo et al., 2015). In 2019, Nikoo et al. also found that with increasing cycle numbers, there was an increase in the protein carbonyl content of Asian black bass surimi, and a decrease in total sulfhydryl content and protein solubility (Nikoo et al., 2019). The observed changes of these indexes indicated a decrease in the quality of surimi with increasing cycle numbers. Sriket et al. (2017) pointed out that repeated freezing and thawing of Sawai (Pangasianodon hypophthalmus) makes an increase in the degree of lipid oxidation, and a decrease in lightness. Overall, the quality problems of aquatic products resulting from repeated freezing and thawing are increasingly concerned by processors and consumers.

Consumption of surimi products is becoming more and more popular. During the processing of some surimi products (such as fish slide and kamaboko), pork back fat may be added into products to improve the flavour, smoothness, and juiciness (Chojnicka et al., 2009). However, the increased fat content may not only contribute to improve the taste, but may also promote lipid and protein oxidation, thus affecting the food quality and nutritional value of the product (Pietrowski et al., 2011; Shi et al., 2014). In this study, fresh grass carp (Ctenopharyngodon idella) was used as raw material to prepare surimi with different fat content by adding salt and different proportion of pork back fat. The water distribution, TBARS, color, myoglobin oxidation, heme iron and non-heme iron content of samples were determined to analyze the effects of different fat content on lipid oxidation and myoglobin oxidation during repeated freeze-thaw cycles of grass carp surimi.

Materials and Methods

Materials

The selected fresh grass carp are bought in a supermarket-Carrefour supermarket. All the fish are soaked in tap water in bags to keep them fresh, and then transported to the laboratory. Pork back fat was purchased at the local market, 48 h post-mortem. Heme was purchased from Sigma-Aldrich (St. Louis, MO, USA), and all the chemicals used in this study were purchased from Solabio at analytical grade.

Preparation of grass carp surimi

The State Council issued the regulations on the Administration of Experimental Animals in 2017, and China’s Ministry of Science and Technology compiled the guidance on the treatment of Experimental Animals in 2006, based on these two documents, using sticks to hit all fish on the head, causing their death. Then the scales and internal organs were removed, the head was cut off and the fish was cut into thin slices, and washed for 5 min with cold water (5°C) and then were chopped for 120 s in a food processor (HR3868, Philips, China). 25 g/kg of salt was added to surimi and stirred for a duration of 2 min. Then pork back fat was added and stirred for a duration of 3 min. The final fat content of grass carp surimi was 0 g/kg, 50 g/kg, 100 g/kg, and 150 g/kg respectively, and the samples were named F0, F50, F100, and F150 respectively. These samples were packed in moisture impermeable polyethylene bags, sealed and stored at –18°C for each cycle. For each week, a set of frozen samples was thawed at flowing water. The frozen samples were subjected to 6 freeze-thaw cycles. A weekly analysis of the samples was performed over six weeks with thawing of samples.

Low-field nuclear magnetic resonance (LF-NMR) relaxation measurements

LF-NMR relaxation measurements were done according to the method of Aursand et al. (2008), which is slightly modified. Sample (1×1×1 cm) was added to the cylindrical glass tube and Carr-Purcell-Meiom-Gill sequence was used to measure relaxation time of T2. The threshold value used for T2 measurement is 150 μs. The data of 4,000 echoes were collected repeatedly through 12 scans. The next repetition time between the scan and the scan is 4,000 ms. Through the use of Nuimag’s Multi Exp Inv Analysis software to make a multi-exponential fitting analysis, a total of 3 relaxation times (T2b, T21, and T22) were obtained, and the corresponding percentages of different types of groups (P2b, P21, and P22) were also obtained.

Myoglobin extraction, characterization, and absorption spectra

Krzywicki (1982) and Shang et al. (2020) method was used to extract myoglobin from grass carp surimi. Five g of samples were weighed, followed by addition of 50 mL phosphate buffer (40 mmol/L, pH 6.8, 4°C). With the application of Ultra homogenizer (T18, IKA, Königswinter, Germany), samples were homogenized under the condition of 10,800 rpm for 20 s and placed in an ice bath for 60 min, then the frozen centrifuge (GL20M, Herixi, Changsha, China) was used in 4°C conditions, 10,000×g was centrifuged for half an hour. Whatman No. 1 filter paper was used to filter the supernatant, and UV visible spectrophotometer (UV2559, Shimadzu, Kyoto, Japan) was used to scan at full wavelength and record the absorbance at 525 nm, 545 nm, 565 nm, and 572 nm. The proportions of the three forms of myoglobin were calculated as follows:

[Deoxymyoglobin]=0.369R1+1.140R20.941R3+0.015,[Oxymyoglobin]=0.882R11.267R2+0.809R30.361,[Metmyoglobin]=2.514R1+0.777R2+0.800R3+1.098,
where R1 = A572/A525, R2 = A565/A525 and R3 = A545/A525.

TBARS assay

Beltran et al. (2003) method was used to measure TBARS. Combined with the absorbance of different samples at 532 nm, the TBARS values were calculated. At the same time, the new samples were acidified by 1,1,3,3-tetraethoxypropane, and the standard curve of malondialdehyde (MDA) (8–50 nmol) was constructed. The TBARS is expressed as mg MDA×kg−1 surimi.

Color measurement

According to the color of grass carp surimi, redness (a*), yellowness (b*), and lightness (L*) were evaluated by the use of Spectro-colorimeter (Miniscan EZ, HunterLab, Reston, VA, USA). Six measurements of these coordinates were performed for each of the three replicates.

Heme iron determination

The methods of Shang et al. (2020) were used to measure the content of heme iron with slightly modified. First, a 10 g grass carp surimi sample was added into 20 mL acidified acetone (80% acetone, 18% water and 2% HCl). Then, with the use of Ultra homogenizer (T18, IKA), the mixture was homogenised under the condition of 15,000 rpm for 15 s and remained in the dark state for 1 hour under the condition of 4°C. Then it was centrifuged at 10,000×g (4°C) for 10 min through a frozen centrifuge (GL20M, Herixi). After precipitation, the soluble substance is obtained and passed through a fiberglass filter (GF/A, Whatman, Maidstone, UK). The filtrate’s absorbance was measured at 640 nm. The standard curve established by using hematin and the heme iron content was 0.0882 times of hematin content.

Non-heme iron determination

The method proposed by Ma et al. (2016) was applied to the measurement of non-heme iron with slightly modified. Firstly, a 5 g grass carp surimi sample was added into 15 mL of 0.1 mol/L citric acid-phosphate buffer (pH 5.5). The mixture was homogenized for 15 s by Ultra homogenizer (T18, IKA) at 15,000 rpm and filtered the supernatant. Then the 1 mL 2% ascorbic acid and 3 mL homogenate were mixed together and incubated at 20°C for a duration of 20 min. 2 mL trichloroacetic acid (11.3%) was then added, mixed together, and centrifuged at a high speed under the condition of 10,000×g (10°C) using a frozen centrifuge (GL20M, Herixi) for 10 min. The transparent supernatant of 3 mL was then transferred into the test tube, which was effectively mixed with the ferrozine chromogenic agent of 0.3 mL and 10% ammonium acetate of 1.2 mL. The mixture was filtered by the use of a fiberglass filter (GF/A, Whatman), and then the absorbance was measured at 562 nm. All iron determination processes are carried out in a dark state.

Data analysis

The expression of all data is mean±SD and the date is analyzed by Excel and SPSS 16.0. One-way ANOVA was used for single factor analysis, two-way ANOVA was used for analyzing the interaction of freeze-thaw cycle and fat content. The significance was established at p<0.05.

Results and Discussion

Water distribution analysis of grass carp surimi with different fat content during multiple freeze-thaw cycles

There are three types of water in the muscle. The shortest relaxation time 1–10 ms (T2b) represents water firmly bound to macromolecules. The intermediate relaxation time 20–100 ms (T21) represents immobilized water. Of all the types, the third type had the most lasting relaxation time, 200–1,000 ms (T22), which was corresponded to water outside the myofibril (Zang et al., 2017). Immobilized water content is very important in grass carp surimi, and water-holding capacity is greatly affected by this part of water (Qin et al., 2017). Therefore, it is necessary to study the relaxation time and proportion of immobilized water. In our study, T21 increased in the first two cycles which might be related to the salt-induced swelling of myofibers (Aursand et al., 2009) and the expansion of space between myofilaments due to increased protein electrostatic repulsion (Erikson et al., 2004). From cycle 3 to cycle 6, T21 and p21 decreased significantly with the increase of freeze-thaw cycles (Table 1), due to protein denaturation, muscle fiber contraction, and water flow to the extracellular space (Ali et al., 2015). With increasing fat content, T21 decreased significantly and p21 increased significantly, suggesting that fat is conducive to the formation of the fine three-dimensional-structured network of surimi, making more water bound in myofibrillar protein (Yang et al., 2015).

Table 1. Changes of water distribution and myoglobin during multiple freeze-thaw cycles
Freeze-thaw cycles Fat content Immobilized water parameters Absorption spectra of myoglobin
T21 (ms) p21 (%) Wave length corresponding to the highest peak (nm) Metmyoglobin content (%)
C0 F0 58.92±0.54Ab 85.13±0.15Aa 409 25.55±0.37Aa
F50 58.85±0.08Ab 84.56±0.66Aa 409 25.25±0.23Aa
F100 58.83±0.52Ab 85.58±0.28Aa 409 25.80±0.43Aa
F150 59.73±0.11Ab 85.81±0.18Aa 409 26.15±1.13Aa
C1 F0 65.05±0.21Aa 84.26±0.42Aa 408 27.05±0.04Aab
F50 64.02±0.16Ba 85.00±0.02Aa 408 33.90±0.65Bc
F100 62.98±0.06Ca 85.26±0.30Aa 407, 408 35.09±0.66BCbc
F150 62.03±0.08Da 85.52±0.67Aab 407 37.02±0.51Cc
C2 F0 62.60±0.71Aa 83.31±0.11Bab 406 28.34±0.07Abc
F50 62.07±1.03Aa 83.97±0.12ABab 405, 406 32.88±0.28Bbc
F100 61.88±0.30Aa 84.17±0.21Ab 405 36.85±0.12Ccd
F150 60.38±0.71Aab 84.16±0.25Abc 405 37.62±0.28Cc
C3 F0 54.85±0.92Ac 82.06±0.55Abc 405, 406 29.97±0.30Acd
F50 54.09±0.20ABc 82.51±0.64Abc 405, 406 36.34±0.30Bd
F100 53.00±0.02ABc 83.02±0.06Ac 405 37.49±0.21Bd
F150 52.59±0.42Bc 83.69±0.13Ac 405 37.57±0.39Bc
C4 F0 52.35±0.78Ac 81.22±0.48Bc 405 30.95±0.89Ade
F50 50.09±0.29Ad 82.34±0.63ABbc 405 32.32±1.40ABbc
F100 46.89±0.93Bd 82.90±0.20ABc 404, 405 33.01±1.29ABb
F150 45.46±0.60Bd 83.45±0.47Acd 404 35.61±0.48Bbc
C5 F0 47.30±0.13Ad 80.32±0.93Ac 404 32.03±0.68Ae
F50 45.87±0.90ABe 80.89±0.15Acd 403, 404 31.31±0.14ABb
F100 43.44±0.50BCe 81.75±0.11Ad 403, 404 33.53±0.36BCb
F150 42.23±0.95Ce 82.22±0.33Ad 402, 403 34.55±0.35Cb
C6 F0 45.65±0.78Ad 78.27±0.41Bd 402 32.40±0.46Ae
F50 43.49±0.57Bf 79.16±0.41ABd 401 34.17±0.10Bcd
F100 42.87±0.16Be 78.82±0.08ABe 399, 400 34.10±0.17Bb
F150 41.87±0.01Be 79.82±0.24Ae 399 34.48±0.39Bb

A–D Means within pork back fat content with different superscript letters are significantly different (p<0.05).

a–g Means within with freeze-thaw cycles different superscript letters are significantly different (p<0.05).

C0, fresh surimi before freezing; C1–C6, the number of freeze-thaw cycles; F0, F50, F100, and F150 are surimi of 0 g/kg fat, 50 g/kg fat, 100 g/kg fat and 150 g/kg fat, respectively.

Download Excel Table
Myoglobin oxidation analysis of grass carp surimi with different fat content during multiple freeze-thaw cycles

Myoglobin belongs to a kind of globular heme protein, which exists in the animal-derived foods and products. It affects the muscle color to a great extent, and is greatly affected by its redox state and concentration (Chaijan, 2008). In the presence of oxygen, deoxymyoglobin and oxymyoglobin were oxidized to metmyoglobin. Compared with mammalian myoglobin, fish myoglobin is easier to oxidize (Haard, 1992). The metmyoglobin contents in grass carp surimi were measured and shown in Table 1. In the same freeze-thaw cycle, with the gradual increase of fat content, the content of metmyoglobin in grass carp surimi increased significantly. Moreover, with more and more freeze-thaw cycles, the content of metmyoglobin increased significantly in grass carp surimi without pork back fat. Freeze-thaw oxidizes deoxymyoglobin and oxymyoglobin to form metmyoglobin, which is consistent with the conclusion of Jiang et al. (2019). However, in the samples with different amounts of pork back fat, the content of metmyoglobin increased at first and then decreased. which may reflect the reduction of metmyoglobin to oxymyoglobin by ferrimyoglobin reductase (Wongwichian et al., 2015).

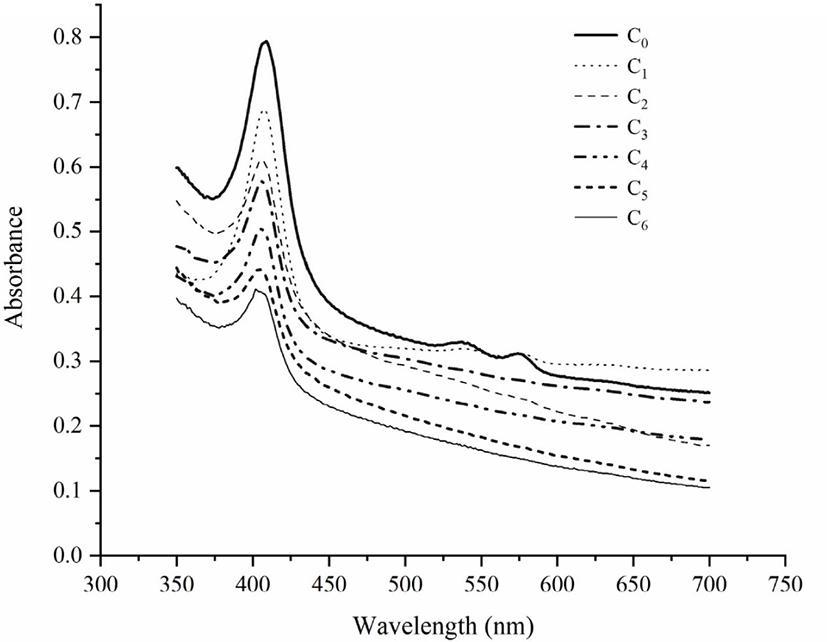
The absorption spectra of myoglobin in all surimi samples were measured from 380 to 450 nm, as shown in Fig. 1 and Table 1. With the fat content increased, the absorption peak of porphyrin showed blue shift. With the increase of freeze-thaw times, porphyrin absorption peak also blue shifted, which shifts from 409 nm to 402 nm. This result is consistent with Wongwichian et al. (2015) and Wang et al. (2018), which suggested that oxidation reaction was caused by repeated freeze-thaw cycles and increased fat content. The polypeptide chain of myoglobin consists of 153 amino acids, globin and an artificial heme group, and an iron (II) protoporphyrin-IX complex (Hayashi et al., 1998). Porphyrin compounds have a strong absorption peak at 420 nm because the haem moiety and apomyoglobin interact with each other. Therefore, the porphyrin absorption peak can be used to monitor the unfolding of heme protein. When the peak disappears, it indicates that the heme protein is damaged or the porphyrin part is separated from globin (Benjakul & Bauer, 2001; Wongwichian et al., 2015). In this study, when the number of freeze-thaw cycles gradually increases, the height of porphyrin absorption peak begins to decrease, which is consistent with changes of heme iron and non-heme iron.

kosfa-40-6-969-g1
Fig. 1. Changes in the absorption spectra in the soret region (300–500 nm) of myoglobin from grass carp surimi by adding 0% of pork back fat. C0, fresh surimi before freezing; C1–C6, the number of freeze-thaw cycles..
Download Original Figure
Changes of the TBARS value during multiple freeze-thaw cycles

TBARS is a common method used to determine MDA, the final oxidation product of which is unsaturated fatty acid (Karoui & Blecker, 2011). The states of MDA are relatively stable, and can reflect the degree of lipid oxidation to a certain extent (Guillén-Sans & Guzmán-Chozas, 1998). Benjakul & Bauer (2001) pointed out that freeze-thaw of muscle tissue led to the accumulation of TBARS in a short time, which was attributed to the destruction of cell membrane caused by ice crystals and the subsequent release of oxidants, especially heme iron. With the increase of freeze-thaw times, the TBARS of grass carp surimi increased significantly (Table 2), which was consistent with the results of Wang et al. (2015). When the fat content increased, TBARS increased significantly, with a maximum value of 2.87 mg/kg, which is in the allowable range of surimi: MDA content greater than 2–3 mg/kg confers bad flavour to the meat (Ferreira et al., 2016).

Table 2. Changes of TBARS, iron content and color during multiple freeze-thaw cycles
Freeze-thaw cycles Fat content TBARS (mg/kg) Iron content Color parameters
Heme iron content (mg/kg) Non-heme iron content (mg/kg) L* a* b*
C0 F0 0.19±0.01Aa 9.90±0.17Aa 10.98±0.49Aa 49.39±0.84Ba –0.91±0.02Aa 7.73±0.23Ba
F50 0.19±0.03Aa 9.12±0.08Ba 11.47±0.40Aa 50.58±0.46ABa –0.73±0.07ABa 7.18±0.23Ba
F100 0.22±0.02Aa 8.82±0.05Ba 12.03±0.59Aa 51.32±0.05ABa –0.64±0.04Ba 6.93±0.08ABa
F150 0.33±0.01Ba 8.69±0.13Ba 12.38±0.49Aa 52.26±0.35Aa –0.59±0.01Ba 6.29±0.24Aa
C1 F0 0.38±0.01Aa 8.64±0.17Ab 11.05±0.20Aa 48.84±0.26Ca –0.86±0.04Aa 8.00±0.02Ca
F50 0.41±0.02ABb 8.09±0.23Ab 11.89±0.40ABa 50.23±0.18Ba –0.29±0.08Bb 7.88±0.01Cab
F100 0.47±0.03BCb 7.31±0.04Bb 12.45±0.20BCa 51.03±0.11ABa –0.11±0.02BCb 7.59±0.11Bb
F150 0.50±0.00Cb 7.05±0.08Bb 13.15±0.00Cab 52.28±0.53Aa 0.09±0.03Cb 7.18±0.07Aab
C2 F0 0.77±0.04Ab 7.41±0.42Ac 12.52±0.30Aab 47.53±0.61Cab –0.63±0.03Ab 8.80±0.18Ba
F50 0.84±0.03Ac 7.04±0.07ABc 12.59±0.20Aa 48.88±0.32BCb 0.06±0.04Bc 8.11±0.17Aab
F100 0.80±0.05Ac 6.82±0.03ABb 13.08±0.10ABab 49.88±0.33ABab 0.10±0.01Bc 8.48±0.12ABc
F150 0.84±0.03Ac 6.27±0.13Bb 13.71±0.20Bb 51.22±0.45Aab 0.17±0.02Bb 8.07±0.08Ab
C3 F0 0.94±0.02Ab 5.54±0.28Ad 13.71±0.40ABc 45.98±0.14Cb –0.28±0.01Ac 10.44±0.45Ab
F50 1.06±0.02Bd 4.39±0.17Bd 14.20±0.30ABb 47.48±0.55BCc 0.29±0.08Bcd 9.46±0.62Ab
F100 1.11±0.01BCd 3.90±0.05BCc 14.30±0.25ABbc 49.32±0.59ABb 0.50±0.06Bd 9.01±0.04Ad
F150 1.16±0.03Cd 3.04±0.27Cc 15.17±0.30BCd 50.13±0.81Ab 0.83±0.06Ce 9.29±0.35Ac
C4 F0 1.34±0.11Ac 3.34±0.15Ae 14.55±0.59Acd 43.47±0.64Bc 0.21±0.04Ad 11.89±0.18Bc
F50 1.37±0.01Ae 3.05±0.17ABe 14.76±0.49Ab 44.85±0.23ABd 0.48±0.06Ade 11.36±0.73ABc
F100 1.48±0.05Ae 2.98±0.42Abd 14.97±0.20Acd 45.54±0.37Ac 0.54±0.07Ade 9.83±0.22Ae
F150 1.49±0.01Ae 2.06±0.34Bd 14.97±0.40Ac 46.10±0.18Ac 0.60±0.01Ac 9.61±0.38Ac
C5 F0 1.79±0.05Ad 2.24±0.37Af 14.69±0.79Acd 42.48±0.57Cc 0.50±0.05Ae 13.47±0.57Ad
F50 1.92±0.05ABf 1.89±0.13Af 15.17±0.30ABc 43.94±0.22BCd 0.57±0.02ABe 12.54±0.63Acd
F100 1.92±0.01ABf 1.84±0.09Ae 15.87±0.49Ade 45.53±0.62ABc 0.63±0.05Bef 11.96±0.09Af
F150 2.03±0.06Bf 1.41±0.22Ad 16.22±0.00Ad 46.56±0.46Ac 0.61±0.01ABc 11.93±0.08Ad
C6 F0 2.48±0.10Ae 0.86±0.07Ag 16.08±0.00Ad 41.32±0.63Bc 0.58±0.02Ae 14.00±0.02Bd
F50 2.67±0.03ABg 0.55±0.02Bg 16.36±0.20Ac 42.03±0.07ABe 0.62±0.01Ae 13.61±0.37Bd
F100 2.78±0.03Bg 0.48±0.08Bf 16.85±0.30ABe 42.61±0.37ABd 0.75±0.02Bf 13.12±0.16ABg
F150 2.87±0.04Bg 0.10±0.07Ce 17.34±0.20Be 43.46±0.58Ad 0.72±0.01Bd 12.51±0.23Ad

A–D Means within pork back fat content with different superscript letters are significantly different (p <0.05).

a–g Means within with freeze-thaw cycles different superscript letters are significantly different (p <0.05).

C0, fresh surimi before freezing; C1–C6, the number of freeze-thaw cycles; F0, F50, F100, and F150 are surimi of 0 g/kg fat, 50 g/kg fat, 100 g/kg fat and 150 g/kg fat, respectively; TBARS, thiobarbituric acid reactive substances.

Download Excel Table
Changes of heme iron and non-heme iron of grass carp surimi with different fat content during multiple freeze-thaw cycles

The freeze-thaw cycle results in tissue damage and protein denaturation, resulting in a decrease in total iron and heme iron in fish (Sriket et al., 2007; Turhan et al., 2006). With the increase of freeze-thaw times, heme iron in grass carp surimi decreased significantly, while non-heme iron increased significantly (Table 2). This may be due to the destruction of iron, resulting in the release of free iron (Wongwichian et al., 2015). When the fat content increased gradually, the heme iron content in grass carp surimi decreased significantly, and the non-heme iron content increased significantly, which was closely related to fat oxidation (Maqsood & Benjakul, 2010).

Color analysis of grass carp surimi with different fat content subjected to multiple freeze-thaw cycles

After freezing and thawing many times, the lightness of grass carp surimi gradually disappeared and L* decreased (Table 2). There are two explanations for these changes. First, the carbonyl compounds formed by oxidation may react with amino compounds such as amines and amino acids to generate dark substances, resulting in decreased lightness (Giri et al., 2010). Second, the catalytic oxidation of iron and copper in fish can promote deepening of the color (Tokur & Korkmaz, 2007). The a* value of grass carp surimi is low and negative, and the b* value is relatively high, which indicates that the color of grass carp surimi is yellow and green. With the increase of freeze-thaw times, the value of a* increases, which may be related to the decrease of heme protein (Leygonie et al., 2012) and the increase of metmyoglobin (Canto et al., 2012). Shi et al. (2014) found that adding vegetable oil will increase the L* and a* values of surimi, and the b* value was affected by the color of vegetable oil itself. In our study, in the same freeze-thaw cycle, with increasing fat content, there were increases in L* values and a* values, and decreases in b* values.

Interaction of freeze-thaw cycle and fat content

Table 3 was the interaction of freeze-thaw cycle and fat content. From Table 3, we can find that the interaction of freeze-thaw cycle and fat content have significant effect on T21, metmyoglobin content, TBARS, heme iron content, a* and b* (p<0.05), and the interaction of freeze-thaw cycle and fat content have no significant effect on p21, non-heme iron content and L* (p>0.05).

Table 3. p-Value of the interaction of freeze-thaw cycle and fat content
Source of variation T21 p21 Metmyoglobin content TBARS Heme iron content Non-heme iron content L* a* b*
Freeze-thaw cycle 0.000 0.000 0.000 0.000 0.000 0.000 0.000 0.000 0.000
Fat content 0.000 0.000 0.000 0.000 0.000 0.000 0.000 0.000 0.000
Freeze-thaw cycle×Fat content 0.000 0.232 0.000 0.004 0.000 0.614 0.231 0.000 0.010

p<0.05 means relationship between the two is significant.

p>0.05 means relationship between the two is not significant.

Download Excel Table

Conclusion

The effect of different fat content on lipid and myoglobin oxidation of grass carp surimi under multiple freeze-thaw cycles was investigated. The freeze-thaw cycle contributes to lipid oxidation, myoglobin oxidation and the conversion of heme iron to non-heme iron, which eventually leads to a decrease of immobilised water content in muscle and a decrease of color stability. Therefore, to prevent these negative effects on the quality of grass carp surimi, temperature fluctuation must be avoided during freezing, transportation, and storage. When fat was added, the water distribution, TBARS, color, metmyoglobin, heme iron and non-heme iron content of grass carp surimi was adversely impacted. Increased fat content promoted the binding of water in myofibrillar protein and improved the lightness of grass carp surimi, but resulted in the aggravation of the degree of lipid and myoglobin oxidation. Overall, the results suggest that careful selection of the appropriate fat content is required for the optimal processing of surimi products.

Conflicts of Interest

The authors declare no potential conflicts of interest.

Acknowledgements

The funding for this study comes from the Natural Science Foundation of Hebei Province (C2017408048) and Basic Scientific Research Business Fee project of provincial colleges and universities in Hebei Province (JYQ202001).

Author Contributions

Conceptualization: Teng A. Data curation: Shang X. Formal analysis: Yan X. Methodology: Shang X, Li Q. Software: Liu Z. Validation: Yan X. Investigation: Liu Z. Writing - original draft: Shang X, Yan X. Writing - review & editing: Shang X, Yan X, Li Q, Liu Z, Teng A.

Ethics Approval

The handling and care of experimental animals in the research were in accordance with the Regulations on the Administration of Experimental Animals issued by the China State Council in 2017 and the guidance on Treating Experimental Animals developed by China’s Ministry of Science and Technology in 2006.

References

1.

Ali S, Zhang W, Rajput N, Khan MA, Li C, Zhou G. 2015; Effect of multiple freeze-thaw cycles on the quality of chicken breast meat. Food Chem. 173:808-814

2.

Aursand IG, Gallart-Jornet L, Erikson U, Axelson DE, Rustad T. 2008; Water distribution in brine salted cod (Gadus morhua) and salmon (Salmo salar): A low-field 1H NMR study. J Agric Food Chem. 56:6252-6260

3.

Aursand IG, Veliyulin E, Böcker U, Ofstad R, Rustad T, Erikson U. 2009; Water and salt distribution in Atlantic salmon (Salmo salar) studied by low-field 1H NMR, 1H and 23Na MRI and light microscopy: Effects of raw material quality and brine salting. J Agric Food Chem. 57:46-54

4.

Beltran E, Pla R, Yuste J, Mor-Mur M. 2003; Lipid oxidation of pressurized and cooked chicken: Role of sodium chloride and mechanical processing on TBARS and hexanal values. Meat Sci. 64:19-25

5.

Benjakul S, Bauer F. 2001; Biochemical and physicochemical changes in catfish (Silurus glanis Linne) muscle as influenced by different freeze-thaw cycles. Food Chem. 72:207-217

6.

Canto ACVCS, Lima BRCC, Cruz AG, Lázaro CA, Freitas DGC, Faria JAF, Torrezan R, Freitas MQ, Silva TPJ. 2012; Effect of high hydrostatic pressure on the color and texture parameters of refrigerated Caiman (Caiman crocodiles yacare) tail meat. Meat Sci. 91:255-260

7.

Chaijan M. 2008; Review: Lipid and myoglobin oxidations in muscle foods. Songklanakarin J Sci Technol. 30:47-53.

8.

Chojnicka A, Sala G, De Kruif CG, van de Velde F. 2009; The interactions between oil droplets and gel matrix affect the lubrication properties of sheared emulsion-filled gels. Food Hydrocoll. 23:1038-1046

9.

Erikson U, Veliyulin E, Singstad TE, Aursand M. 2004; Salting and desalting of fresh and frozen-thawed cod (Gadus morhua) fillets: A comparative study using 23Na NMR, 23Na MRI, Low-field 1H NMR, and physicochemical analytical methods. J Food Sci. 69:FEP107-FEP114

10.

Ferreira VC, Morcuende D, Madruga MS, Hernández-López SH, Silva FA, Ventanas S, Estévez M. 2016; Effect of pre-cooking methods on the chemical and sensory deterioration of ready-to-eat chicken patties during chilled storage and microwave reheating. J Food Sci Technol. 53:2760-2769

11.

Giri A, Osako K, Okamoto A, Ohshima T. 2010; Olfactometric characterization of aroma active compounds in fermented fish paste in comparison with fish sauce, fermented soy paste and sauce products. Food Res Int. 43:1027-1040

12.

Guillén-Sans R, Guzmán-Chozas M. 1998; The thiobarbituric acid (TBA) reaction in foods: A review. Crit Rev Food Sci Nutr. 38:315-350

13.

Haard NF. 1992; Biochemistry and chemistry of color and color change in seafoods. In Advance in seafood biochemistry. In: Flick GJ, Martin RE, editors.(ed)Technomic, Lancaster. PA, USA: pp p. 312-319.

14.

Hayashi T, Takimura T, Aoyama Y, Hitomi Y, Suzuki A, Ogoshi H. 1998; Structure and reactivity of reconstituted myoglobins: Interaction between protein and polar side chain of chemically modified hemin. Inorganica Chim Acta. 275-276:159-167

15.

Jiang Q, Nakazawa N, Hu Y, Osako K, Okazaki E. 2019; Changes in quality properties and tissue histology of lightly salted tuna meat subjected to multiple freeze-thaw cycles. Food Chem. 293:178-186

16.

Karoui R, Blecker C. 2011; Fluorescence spectroscopy measurement for quality assessment of food systems: A review. Food Bioprocess Technol. 4:364-386

17.

Krzywicki K. 1982; The determination of haem pigments in meat. Meat Sci. 7:29-36

18.

Leygonie C, Britz TJ, Hoffman LC. 2012; Impact of freezing and thawing on the quality of meat: Review. Meat Sci. 91:93-98

19.

Ma F, Qin H, Shi K, Zhou C, Chen C, Hu X, Zheng L. 2016; Feasibility of combining spectra with texture data of multispectral imaging to predict heme and non-heme iron contents in pork sausages. Food Chem. 190:142-149

20.

Maqsood S, Benjakul S. 2010; Comparative studies of four different phenolic compounds on in vitro antioxidative activity and the preventive effect on lipid oxidation of fish oil emulsion and fish mince. Food Chem. 119:123-132

21.

Nikoo M, Benjakul S, Gavlighi HA, Xu X, Regenstein JM. 2019; Hydrolysates from rainbow trout (Oncorhynchus mykiss) processing by-products: Properties when added to fish mince with different freeze-thaw cycles. Food Biosci. 30:100418

22.

Nikoo M, Regenstein JM, Ghomi MR, Benjakul S, Yang N, Xu X. 2015; Study of the combined effects of a gelatin-derived cryoprotective peptide and a non-peptide antioxidant in a fish mince model system. LWT-Food Sci Technol. 60:358-364

23.

Pietrowski BN, Tahergorabi R, Matak KE, Tou JC, Jaczynski J. 2011; Chemical properties of surimi seafood nutrified with ω-3 rich oils. Food Chem. 129:912-919

24.

Qin N, Zhang L, Zhang J, Song S, Wang Z, Regenstein JM, Luo Y. 2017; Influence of lightly salting and sugaring on the quality and water distribution of grass carp (Ctenopharyngodon idellus) during super-chilled storage. J Food Eng. 215:104-112

25.

Shang X, Zhou Z, Jiang S, Guo H, Lu Y. 2020; Interrelationship between myoglobin oxidation and lipid oxidation during the processing of cantonese sausage with D-sodium erythorbate. J Sci Food Agric. 100:1022-1029

26.

Shi L, Wang X, Chang T, Wang C, Yang H, Cui M. 2014; Effects of vegetable oils on gel properties of surimi gels. LWT-Food Sci Technol. 57:586-593

27.

Sriket C, Benjakul S, Senphan T. 2017; Effect of iron on physicochemical changes of Sawai (Pangasianodon hypophthalmus) pastes during multiple freeze-thaw cycles. Turk J Fish Aquat Sci. 19:947-956.

28.

Sriket P, Benjakul S, Visessanguan W, Kijroongrojana K. 2007; Comparative studies on the effect of the freeze-thawing process on the physicochemical properties and microstructures of black tiger shrimp (Penaeus monodon) and white shrimp (Penaeus vannamei) muscle. Food Chem. 104:113-121

29.

Srinivasan S, Hultin HO. 1997; Chemical, physical and functional properties of cod proteins, modified by non enzymic free radical generating system. J Agric Food Chem. 45:310-320

30.

Tokur B, Korkmaz K. 2007; The effects of an iron-catalyzed oxidation system on lipids and proteins of dark muscle fish. Food Chem. 104:754-760

31.

Turhan S, Ustun NS, Bank I. 2006; Effect of freeze-thaw cycles on total and heme iron contents of bonito (Sarda sarda) and bluefish (Pomatomus saltator) fillets. J Food Compost Anal. 19:384-387

32.

Wang H, Luo Y, Shi C, Shen H. 2015; Effect of different thawing methods and multiple freeze-thaw cycles on the quality of common carp (Cyprinus carpio). J Aquat Food Prod Technol. 24:153-162

33.

Wang Z, He Z, Gan X, Li H. 2018; Interrelationship among ferrous myoglobin, lipid and protein oxidations in rabbit meat during refrigerated and superchilled storage. Meat Sci. 146:131-139

34.

Wongwichian C, Klomklao S, Panpipat W, Benjakul S, Chaijan M. 2015; Interrelationship between myoglobin and lipid oxidations in oxeye scad (Selar boops) muscle during iced storage. Food Chem. 174:279-285

35.

Yang H, Han M, Bai Y, Han Y, Xu X, Zhou G. 2015; High pressure processing alters water distribution enabling the production of reduced-fat and reduced-salt pork sausages. Meat Sci. 102:69-78

36.

Zang J, Xu Y, Xia W, Jiang Q. 2017; The impact of desmin on texture and water-holding capacity of ice-stored grass carp (Ctenopharyngodon idella) fillet. Int J Food Sci Technol. 52:464-471