Introduction
Diabetes is the third risky disease in the world. It was ranked the 4th in death rate in Korea in 2013 (KS Association, 2013). This disease has been being increased in correlation with rapid increase of obese population due to changing eating habit to western style and the lack of exercise caused by industrialization (DeFronzo, 1981). Diabetes is classified as type 1 and type II. Type I diabetes is caused by the lack of sufficient amount of insulin caused by the loss of function of β cells in the pancreas. Type II diabetes is caused by the increase of insulin resistance in the human body that it cannot have normal physiological function due to uncertain reasons (Kim et al., 2006). Type II diabetes is very serious in adults as well as in adolescence (Orland and Permutt, 1987).
Many studies have been conducted to develop effective natural materials (functional foods) with safety and efficacy to overcome the limitation and side effect of existing medicinal treatment (Hsu et al., 2009). Functional foods have been developed not only to compensate the imbalance of nutrients, but also to prevent diseases by enhancing regulatory function of the human body.
Conjugated linoleic acid (CLA) has been recognized as a functional material (Parodi, 1997). CLA is an isomer generated by biohydrogenation (addition of hydrogen) of linoleic acid (Griinari et al., 2000; O'Quinn et al., 2000). It has been reported that CLA has anticancer, anti-arteriosclerosis, and growth promotion effect by regulating the immunity, thus preventing diabetes (Belury et al., 1996; Park et al., 2001).
We here screened several CLA producing lactic acid bacteria to develop starter culture to produce high functional fermented milk (FM) including CLA (Granlund et al., 2005). FM with high concentration of CLA could be made by combining Bifidobacterium breve (KCTC 3419) standard strain, Streptococcus thermophilus (YF-L812) commercial strain, and Lactobacillus sakei subsp. LJ011 separated from Kimchi. It has been reported that CLA can decrease blood sugar level and improve the condition of diabetes (Hsu et al., 2009; Taylor and Zahradka, 2004). However, the anti-diabetes activity of CLA or FM containing CLA produced by fermentation of combined strains has been rarely studied. Therefore, FM with high concentration of CLA was made by screed strains fed into mice suffered from type II diabetes for 6 wk. The levels of blood glucose and lipid levels were monitored to obtain basic information for the development of anti-diabetes and functional foods.
Material and Methods
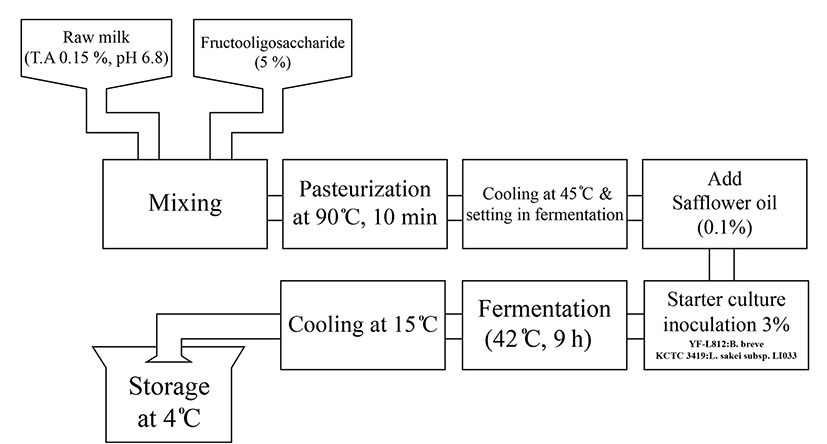
FM containing CLA used in this study was provided from Imsil Research Institute of Cheese Science. Briefly, fresh milk (pH 6.8) produced from Holstein-Friesian cows in the Imsil area was used. For experimental use, milk with 5% fructooligosaccharide was heated to 90℃ for 10 min and immediately put in an ice bath to cool down to 42℃. For fermentation, heated milk was incubated with 3% starter stock at 42℃ for 9 h in a thermostatically controlled water bath until pH reached 4.6 (Fig. 1). The starter stock contained 0.1% safflower seed oil and the following bacteria at 4:3:3 ratio: commercial stain YF-L812 (S. thermophilus, L. delbrueckii subsp. bulgaricus), standard strains. B. breve KCTC 3419 and L. sakei LJ011. FM was freezedried and the powder was stored at 4℃ until use.
Analysis of FM by gas chromatograph (GC, Agilent, USA) was carried out using an Supelcowax-10 fused capillary GC column (Supelco, 60 m × 0.32 mm, 0.25 μm). Gas chromatography conditions have been described previously (Christie et al., 2009). Concentration of CLA in FM was determined by the sum of main isomer such as, c9t11, t10c12, c9c11, t9t11.
Five wk-old male C57BL/KsJ-db/db mice (n=32) and C57BL/6 normal mice (n=8) were obtained from the Korean Research Institute of Bioscience and Biotechnology, Ochang, Korea. All animals had free access to commercial chow during the first week of adaptation. They were then randomly divided into five groups; Normal (C57BL/6J), positive control (db/db), FM 0.2% (CLA 0.01%), FM 0.6% (CLA 0.03%), and Glimepiride (GLM 2.5 mg/kg/day) (Hsu et al., 2009). Each group was offered the diet for 6 wk. All mice had free access to food and water. Body weight for each mouse was measured at 1 and 6 wk after the start of the treatment. Mice were maintained in microisolator cages under pathogen-free conditions with a 12 h light/dark schedule. All animals were cared for in accordance with the Chonbuk National University institutional guidelines for the care and use of experimental animals.
Fasting blood glucose (FBG) levels were determined once a week during treatment after overnight fasting. Blood glucose levels were measured with Acuu-Check (Roche Diagnostics Korea Co, Ltd, Korea) according to manufacturer’s instructions. An oral glucose tolerance test (OGTT) was performed at 5 wk of treatment after overnight fasting. Blood was sampled from the tail vein of mice at time 0 (baseline) and at 30, 60, 90, 120 min after an oral glucose load at 1 g/kg of body weight. Food (but not water) was withheld from cages during the course of fasting. Insulin tolerance test (ITT) was performed at the last week of treatment after overnight fasting. Diluted regular human insulin (Humulin R; Eli Lilly Japan K.K., Japan) was injected intraperitoneally into mice at a dose of 1 units/kg of body weight. Blood samples were collected with heparinized capillary tubes from the tail vein at time 0 (baseline) and at 30, 60, 90, 120 min after insulin injection. They were immediately placed on ice. Plasma was prepared by centrifugation of blood samples at 3,000 rpm for 15 min at 4℃. Blood glucose levels were measured with according to manufacturer’s instructions.
At the end of the experimental period, food was withheld for 12 h. Mice were anesthetized with ether. Blood was immediately collected and centrifuged at 3,000 rpm for 15 min to obtain plasma. Plasma samples were frozen at −70℃ for further analysis. Liver, fat, spleen, kidney, and heart samples were harvested, weighed, and processed.
Total cholesterol (TC), high density cholesterol (HDL), low density cholesterol (LDL) (Cell biolabs, USA), triglyceride (TG, Cayman Chemical, USA), plasma insulin (Shibayagi, Japan), and plasma leptin (Crystalchem, USA) were measured using microplate reader (Bio Tek, USA) according to the manufacturer’s instructions (Parisi et al., 2015; Sung et al., 2005). Plasma aspartate aminotransferase (AST) and alanine aminotransferase (ALT) were measured using an Animal Chemistry Analyzer (VETSTAT 8008, IDEXX, Korea) according to the manufacturer’s instructions.
Liver tissues were homogenized in 1 mL of PBS. Homogenates were extracted with 5 mL of chloroform/methanol mixture. After vigorous vortexing, the mixture was allowed to separate into two phases and centrifuged at 2,500 rpm for 15 min at 4℃. Total hepatic TG concentrations were normalized to respective protein concentrations and presented as mg of lipid per g of tissue protein. Intracellular TG contents were measured using a commercial TG assay kit (Cayman Chemical, USA) according to the manufacturer’s instructions. For histopathology analysis, liver tissues were trimmed and fixed in 10% normal buffered formalin for 24 h. All fixed samples were embedded in paraffin and cut into 4-5 micron sections. These sections were deparaffinized with xylene, rehydrated with graded alcohol series, and stained with hematoxylin and eosin (H&E). Tissue histopathology was performed using a conventional light microscope (magnification 200×; Carl Zeiss, Germany). H & E stained sample sections were imaged. Areas of stained regions were quantified in pixels using Image Pro analysis program.
All values were expressed as mean±standard error (SE). Statistical differences among experimental groups were assessed with Student`s t-test for two groups. One-way analysis of variance (ANOVA) and Tukey’s test were used for comparison among more than two groups. Statistical significance was considered when P value was less than 0.05 (Andrikopoulos et al., 2008).
Results and Discussion
Body weights of diabetic control mice (db/db group) were significantly (p<0.05) higher than those of negative control mice (Normal group). The body weight reduction of FM fed db/db mice (0.2%, 0.6% FM group) was significant from 5 wk compared to the control db/db group (Fig. 2). After 6 wk of feeding the average weights of mice in the db/db, 02% FM, and 0.6% FM groups were 51±1.9 g, 46.5±1.1 g, and 41.7±0.9 g (p<0.05), respectively. The positive control GLM group had significantly different body weight from 3 wk compared to the db/db group. After 6 wk of feeding with FM, mice were sacrificed to monitor the changes in weights of liver, heart, kidney, spleen, and abdominal fat. Weights of liver and abdominal fat in the 0.6% FM group were significantly (p<0.05) decreased compared to those of the db/db group (Table 1). These results coincide with previous literature that CLA reduces body fat by several mechanisms, including a reduced energy intake, increased metabolic rate, and a shift in the nocturnal fuel mix (West et al., 1998). Our results indicated that FM containing CLA was effective in reducing body weight of type II diabetes db/db mice.
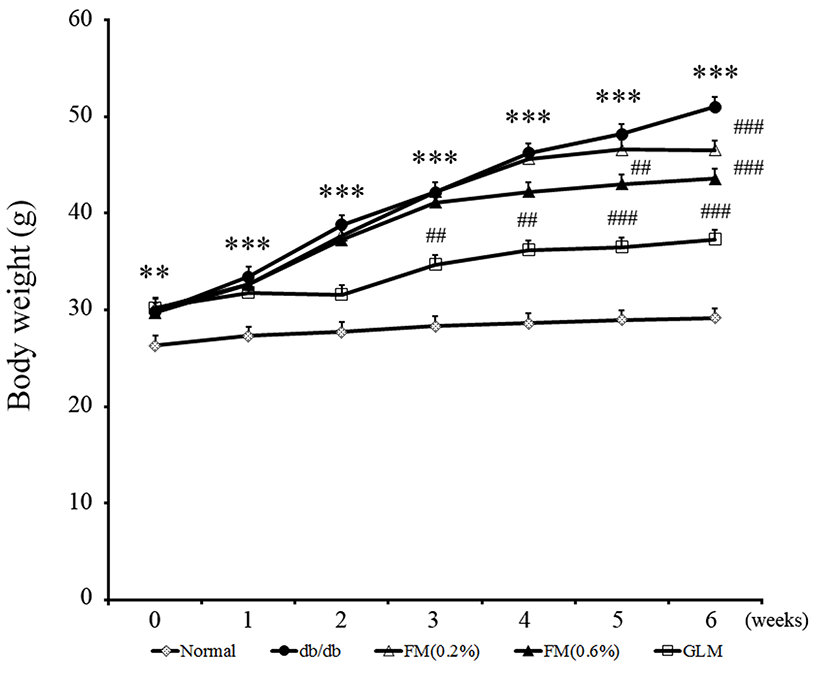
Data are expressed as mean±SE (n=8). *p<0.05 vs. Normal; #p<0.05 vs. db/db
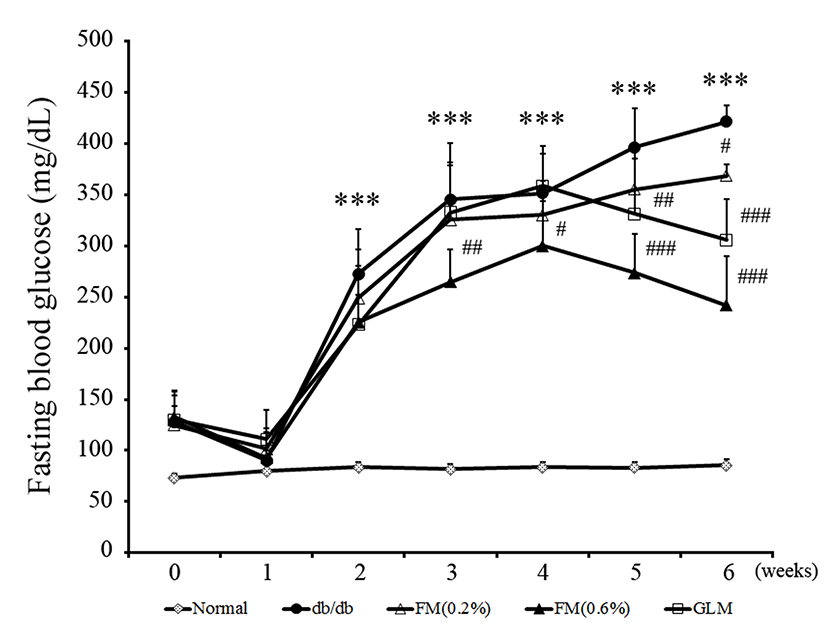
In type II diabetes, hyperglycemia is closely related to increased risk of vascular complications. Especially, impaired fasting glucose is an important marker of decreased capacity of vessels (Gerich, 2003; Koh, 1998). The effect of fermented milk containing CLA on FBG levels during feeding is shown in Fig. 3. The FBG levels of db/db group mice were significantly (p<0.05) increased from 2 wk. However, the FBG levels of 0.6% FM group were significantly (p<0.05) decreased from 3 wk. These results suggested that fermented milk containing CLA might be effective in regulating FBG level.
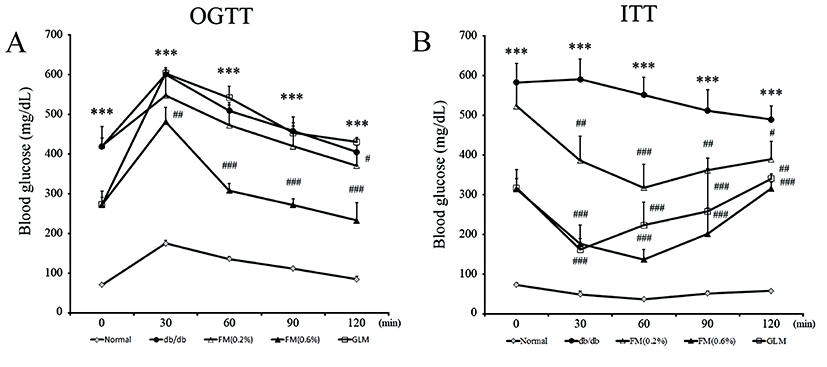
The OGTT in all mice groups had the highest values at 30 min after glucose administration followed by decreases in values. In the 0.6% FM group, OGTT was reduced at 60, 90, and 120 min after glucose administration with significantly (p<0.01) differences compared to the db/db group (Fig. 4A). The OGTT of the 0.6% FM group was decreased to the base level before administration at 90 min. However, the OGTT of the db/db group was maintained at high level until 120 min. FM containing CLA diet showed significant reduction effect on ITT level compared to the db/db group (Fig. 4B). It has been reported that insulin resistance can reduce glucose utilization and increase glucose production from the liver, thus leading to hyperglycemia (Gerich, 2003).
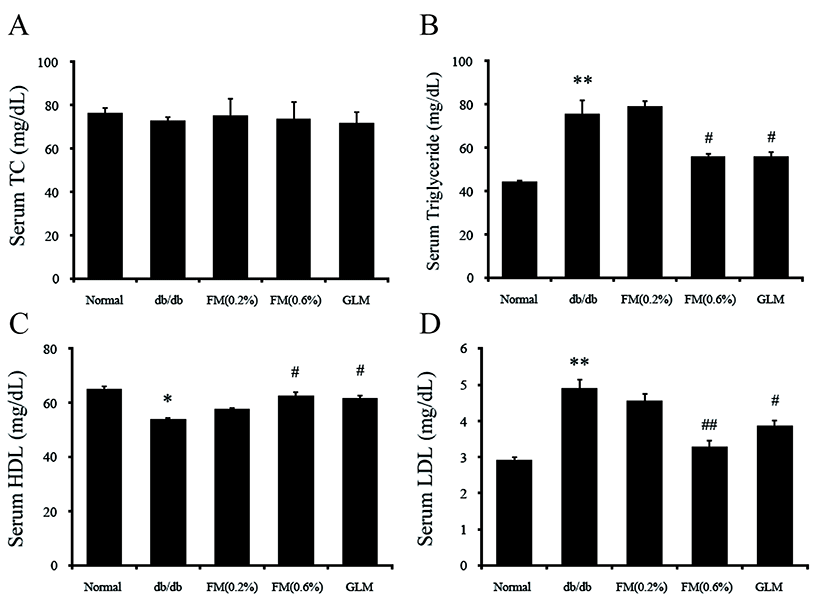
There was no significant (p>0.05) difference in the concentration of serum total cholesterol among all groups. However, the concentration of serum HDL was significantly (p<0.05) increased. Serum LDL and TG levels were significantly (p<0.05) decreased in the 0.6% FM group compared to the db/db group (Fig. 5). Lipid metabolism disorders are known as the main anomaly factors of type II diabetes (Havel, 2004; Klok et al., 2007; Krauss, 2004; Kwon et al., 2015). Therefore, it is very important to normalize therapy for diabetic dyslipidemia. Our results indicated that FM containing CLA could prevent damage of inner surface of blood vessel.
The db/db mice group with high FBG level also had higher serum insulin level than the normal group. However, the FM mice groups showed significant (p<0.05) reduction in serum insulin level compared to the db/db group that appeared to have improvement in insulin resistance. Especially, the serum insulin level of the 0.6% FM group was more than 50% lower than that of the db/db group (Fig. 6A). High serum insulin level can induce the resistance in the absorption of glucose mediated by insulin (Harris et al., 2001). Taken together, our results indicate that intake of FM could improve insulin sensitivity.
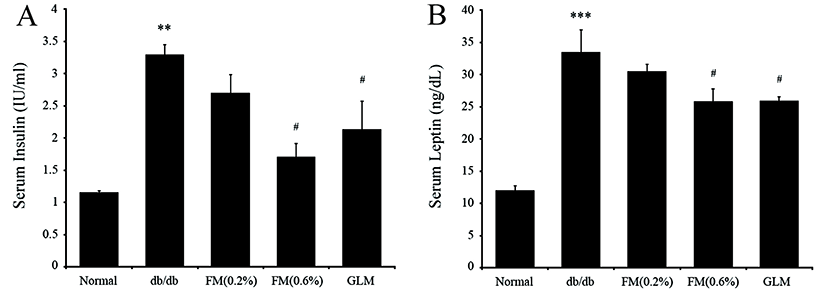
The concentration of serum leptin of the db/db group was increased at a higher rate than the normal group. However, mice in the 0.6% FM group showed significant (p<0.05) decrease in serum leptin level (Fig. 6B). These results revealed the correlation between serum insulin and leptin. Insulin can lead to leptin synthesis and secretion through regulating glucose metabolism in adipocytes (Lee et al., 1987). Our results showed that FM containing CLA had therapy effects on type II diabetes through improving insulin resistance with simultaneous increase in serum leptin and insulin levels.
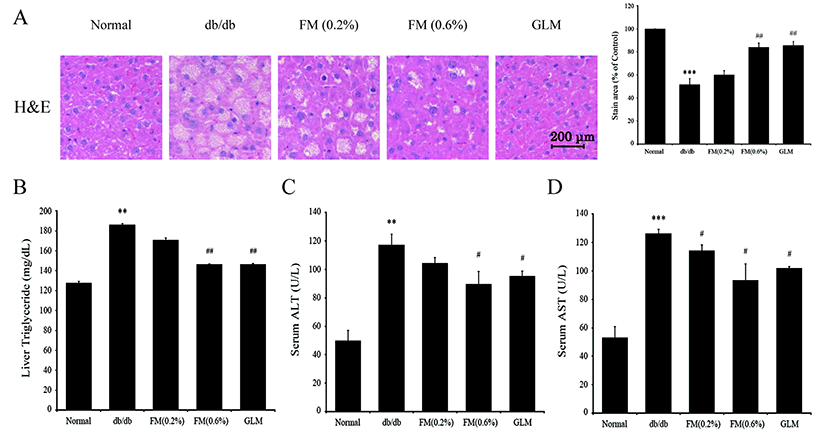
Accumulation of fat in the liver is caused by imbalanced accumulation and elimination of TG (Wolfrum et al., 2004). Histological observation and TG changes in the liver after 6 wk of FM feeding FM are shown in Fig. 7A and 7B. Histological evaluation with H&E staining showed significant differences among groups (Fig. 7A). Specifically, liver sections from the db/db group exhibited ballooning signs of degeneration. However, these histological changes in the liver were significantly improved in the FM mice group. Our results suggested that FM containing CLA could improve the pathogenesis of liver in type II diabetes db/db group. In addition, the level of TG in the liver of the 0.6% FM group was significantly (p<0.05) reduced compared to that of the db/db group (Fig. 7B). Our results indicated that FM containing CLA could influence glucose and lipid metabolism in the liver. Hepatic enzymes such as ALT and AST activities were significantly lower in the 0.6% FM group compared to those in the db/db group. Whole liver inflammation and cell destruction can be caused by lipid metabolism disorder or fatty liver because ALT and AST enzymes are secreted into the blood that could be detected (Donnelly et al., 2005; Plaa and Hewitt, 1989).
Conclusion
It has been reported that CLA could decrease blood glucose level and improve the condition of diabetes (Parodi, 1997). Functionality of FM containing CLA was monitored in type II diabetic mouse model in this study. Feeding FM for 6 wk showed ameliorating effect on diabeticindicating parameters of type II diabetes. After the treatment, body weight and glucose tolerance were reduced. Dyslipidemia, insulin sensitivity, and leptin regulation were improved by feeding. CLA in FM may affect the prevention of liver health and improvement of function of the organ. Subsequent studies are needed to elucidate the effectiveness and efficacy of FM containing CLA against other chronic metabolic diseases in physiological aspect.


