Introduction
Yanjin blackbone chickens (YBC) and Piao chickens (PC) are both local chickens in Yunnan Province, China. YBC is mainly produced in Yanjin County, Zhaotong City, which has a warm and humid climate. While PC is mainly produced in Zhenyuan County, Pu’er City, which mostly grows in middle-high altitude mountainous areas with complex terrain and a cool climate. YBC and PC have tender meat, umami taste, rich nutritional value, and a good nourishing effect, which are favored by the local people (Fan et al., 2018; Pellattiero et al., 2020; Zhang et al., 2017), and PC is unique in that it has no “tail” and has the characteristics of more meat and less bone (Huang, 2014). So far, there have been few studies on these two types of Chinese native chickens. Gu and Li (2020) studied the germplasm characteristics and slaughter performance of PC. Our research team investigated the effects of methods of cooking on volatile and non-volatile substances in PC (Yu et al., 2021), and compared the content of water-soluble low molecular weight compounds and fatty acids of YBC and a typical commercial chicken (Xiao et al., 2021).
The flavor is a significant determinant of the quality of chicken food items and has also been a food research hotspot (Gong et al., 2017). The flavor of chicken is a combination of taste and aroma, which is produced by a series of chemical changes caused by the heat of flavor precursors (Christensen et al., 2012; Delgado-Andrade, 2017). The main water-soluble precursors in chicken include free sugars, nucleotides, and free amino acids (Khan et al., 2015; Raza et al., 2015), and chicken is the main source of small molecular compounds in chicken soup, such as nucleotides, glutamic acid, threonine, tyrosine, and isoleucine, which can increase the umami of the soup and be proved to be the main contribution of the chicken soup flavor components (Zhan et al., 2020).
Sour, umami, sweet, and other taste amino acids belong to the amino acids, with umami amino acids and their derivatives contributing the most to the flavor of chicken soup (Li et al., 2018). Studies have shown that both 5’-adenine nucleotide and 5’-inosine hypoxanthine enhance the umami flavor of chicken soup (Sabikun et al., 2021). Medium- and long-chain free fatty acids (C>6) as aroma precursors can be used as substrates to further degrade and produce small molecules such as aldehydes and acids (Huang et al., 2020). Different fatty acid compositions lead to different flavors in various meat products. For example, the main fatty acids in pork were palmitic acid, stearic acid, oleic acid, and linolenic acid (Barola et al., 2020). In addition to free amino acids, nucleotides, and flavorable peptides, other small molecular metabolites, such as organic acids, sugars, and inorganic salts, also have an impact on how the final flavor of the chicken is formed.
Metabolomics is generally the quantitative analysis of small molecular metabolites with a relative molecular weight within 1,000, such as organic acids, and amino acids. Principal component analysis (PCA), partial least squares discriminant analysis (PLS-DA), and orthogonal partial least squares discriminant analysis (OPLS-DA) are often used for multivariate statistical analysis of data (Liu et al., 2019; Wang et al., 2017). PCA usually displays the classification information of samples with score charts (Sharma et al., 2016; Tian et al., 2012). PLS-DA and OPLS-DA, belonging to supervised pattern recognition methods, can establish the relationship between metabolites and groups while reducing the dimension of the data, which can extract the difference information between groups more efficiently. Compared with PLS-DA, OPLS-DA has one more orthogonal conversion and stronger explanatory ability (Liu et al., 2019).
At present, metabolomics is used in many aspects of meat research. For example, Xiao et al. (2019b) studied the changes in water-soluble compounds in the processing of braised chicken by using metabolomics methods. Wang et al. (2017) analyzed the differences in metabolites in the meat between Linwu ducks and Beijing ducks. Zhang et al. (2018) used metabonomics to find out the characteristic taste substances of Jinhua ham, Xuanwei ham, American country ham, Parma ham, and Bama ham. Xiao et al. (2019a) analyzed metabolites in Yunnan Wuding chicken at different growth stages based on NMR and identified four metabolic pathways, including alanine, aspartic acid, and glutamic acid, as the main metabolic pathways affecting the flavor of Wuding chicken at different days of age.
There have been few reports on the meat quality and processing characteristics of YBC and PC. In order to increase the development and utilization of these two local chickens, it is necessary to fully understand their meat-quality characteristics. Based on this, YBC and PC were used as the research objects in this study, and gas chromatography-mass spectrometry (GC-MS) and liquid chromatography-quadrupole static field orbital trap mass spectrometry (LC-Q-Exactive-MS) were used to analyze the compositions of total fatty acids and small molecular metabolites in chicken breast and leg meat, respectively. Volatile flavor components were also discussed, and this part of the data has been published (Xun et al., 2021). The differences were discussed of the main flavor substances between YBC and PC, provided a scientific basis for their further development and utilization, and also laid a foundation for the establishment of quality evaluation standards for high-quality local chickens.
Materials and Methods
In this experiment, 12 YBC and 12 PC (300 days of age, half male and half female) were selected from the same batch with the same nutritional level and feeding and management conditions, and all of them were provided by the experimental breeding chicken farm of Yunnan Agricultural University. After fasting for 12 hours, they were weighed and slaughtered. Their breast and leg muscles were further collected. After removing visible fat and fascia tissues, various indexes were analyzed, determined, and compared according to different varieties and different parts. There were six chickens for each indicator, half male and half female, that is, there were six repeated tests for each indicator. All of the compounds utilized were of HPLC grade.
According to the previous method, condition optimization was carried out to determine the fatty acid content in chicken (Liu et al., 2019). The free fatty acids were detected by GC-MS (7890B-5977B, Agilent, Palo Alto, CA, USA), equipped with a DB-WAX capillary column (0.25 μm, 30 m×0.25 mm, Agilent). The right breast and leg meat of YBC and PC (half male and half female) were randomly selected from the test samples, which were ground with liquid nitrogen and freeze-dried for reserve use.
The chicken samples (0.2 g) were ground in a grinding tube at 60 Hz for 5 min. The ground samples were transferred to a glass centrifuge tube, 2 mL of methanol and 4 mL of chloroform were added, shaken at 25°C and 5×g for 20 min, and then 2 mL of deionized water was added and vortexed for 2 min. Then, it was centrifuged at 168×g for 10 min and it was dried with nitrogen. Then 1 mL n-hexane and 25 μL 10.211 mg/mL methyl 19 carbonates (the internal standard) were added and swirled for 2 min. Then added 1 mL 0.4 mol/L potassium hydroxide-methanol, vortexed for 1 min, and then reacted at 37°C for 30 min. Centrifugation was performed at 672×g for 5 min, and the supernatant was taken to be tested. Under the conditions of the injection temperature of 270°C, loading a sample of 1 μL, a column flow rate of 1 mL/min, an interface temperature of 280°C, and a split ratio of 20:1 were set. The heating program was set to hold at 70°C for 5 min, at 25°C/min to 200°C, and at 2°C/min to 240°C for 10 min. The ion source and the four-pole temperatures were set at 230°C and 150°C, respectively, for full scanning in the range of 33–500 aum.
The small molecular metabolites were determined according to the previous method in chicken (Jin et al., 2019), which was determined by LC-Q-Exactive-MS (Ultimate 3000, Thermo Fisher Scientific, Waltham, MA, USA), equipped with a column (C18, 1.9 μm, 100 mm×2.1 mm).
The chicken sample (50 mg) was weighed and added to 800 μL of 80% methanol and 10 μL of 2.8 mg/mL 2-chlorophenylalanine (the internal standard) in a grinder for 90 s at 65 Hz. Ultrasound was performed for 30 min in an ice bath and left for 1 hour at –20°C. It was then centrifuged in a 4°C centrifuge at 24,192×g for 15 min. The sample size was set to 10 μL and gradient elution was performed at a column temperature of 40°C and a flow rate of 0.35 mL/min (mobile phase A: water+5% acetonitrile+0.1% formic acid; mobile phase B: acetonitrile+0.1% formic acid). 0 min, 100% A; 1.5 min, 80% A; 9.5 min, 0% A; 14.5 min, 0% A; 14.6 min, 100% A; 18 min, 100% A. Scanning was carried out under electrospray ion sources in positive and negative ion modes, respectively. The heater temperature (300°C), sheath gas flow rate (45 arb), auxiliary gas flow rate (15 arb), and tail gas flow rate (1 arb) were all the same except that the S-Lens RF level [electrospray ionization (ESI)+, 30%; ESI-, 60%)] and electrospray voltage (ESI+, 3.0 KV; ESI-, 3.2 KV) were different in both modes.
Microsoft Excel 2016 software and SPSS 25.0 software were used for statistical analysis of the data. Univariate analysis of variance and Duncan’s complex range method were used for difference analysis, and the significance level was p<0.05. Multivariate statistical analysis of data was used by SIMCA 14.1 software, and heat maps were drawn by TBtools software. PCA, PLS-DA, and OPLS-DA were used for multivariate statistical analysis of data.
Results and Discussion
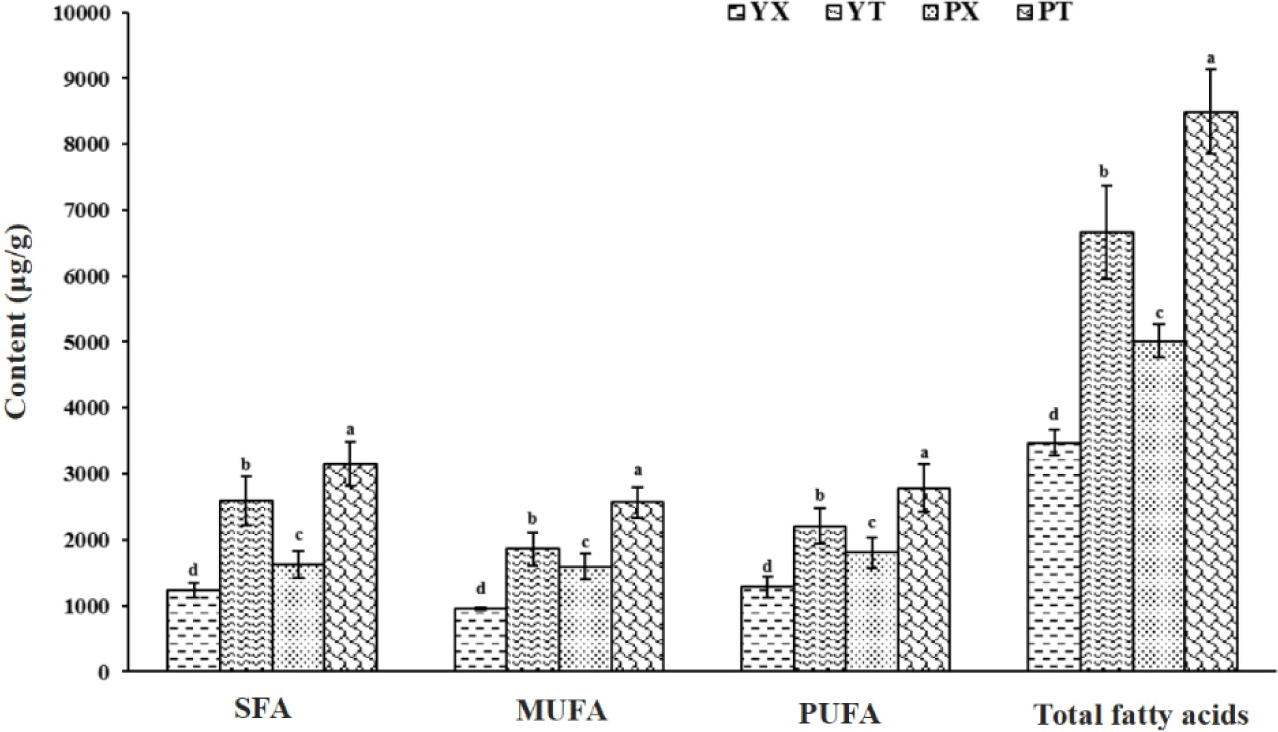
The composition and content of fatty acids in chicken not only affect the flavor quality of chicken but are also vital indicators for measuring the nutritional value of chicken (Yu et al., 2021). Through the determination and analysis of fatty acids in YBC and PC chicken breast and leg meat, the influence of variety and part on chicken flavor was explored from the fatty acid perspective, and the results are shown in Table 1, Fig. 1, and Supplementary Fig. S1 of the Supplementary Materials. Thirty-two kinds of fatty acids were identified, and among them, UFA was the main fatty acid in chicken breast and leg meat of YBC and PC, accounting for 64.32%, 61.10%, 67.63%, and 62.97% of the total fatty acid content, respectively. In these two chicken varieties, fatty acids were mainly C16:0, C18:0, C18:1, C18:2n6, and C20:4n6, accounting for more than 89.35% of the total fatty acid content, which was similar to the results of the previous studies (Xiao et al., 2019b; Xiao et al., 2021; Yu et al., 2021), indicating that the composition of fatty acids in chicken was relatively stable and had certain regularity.

The C18:1 has the highest content in the breast meat and leg meat of YBC and PC, accounting for 25.85%, 25.60%, 27.74%, and 26.48% of the total fatty acid content, respectively. Studies have shown that high levels of C18:1 in meat can reduce some of the effects of amino acids themselves on fatty acid odor (Dashdorj et al., 2011), thereby contributing to the formation of the product’s flavor. The C16:0 content of chicken breast and leg meat in PC was 58.97% (p<0.05) and 63.37% (p<0.05) higher than that of YBC, respectively, but the C18:0 content of chicken breast and leg meat in PC was not significantly different from that of YBC. C16:0 and C18:0 were the main saturated fatty acids (SFAs) in YBC and PC, which is similar to previous findings (Dalziel et al., 2015; Nkukwana et al., 2014; Tian et al., 2011). When the human body is short of certain fatty acids, SFA is the preferred fatty acid used by the heart that is synthesized by the endogenous pathway of C16:0, and then polyunsaturated fatty acids (PUFA) is produced by the action of carbon chain elongating enzymes and desaturase (Nkukwana et al., 2014). C18:2n6 and C20:4n6 were the main PUFA in YBC and PC, and the content of C18:2n6 and C20:4n6 in chicken breast and leg meat of PC was 31.49% (p<0.05), 26.34% (p<0.05), 18.01% (p<0.05), and 12.41% (p<0.05) higher than that in chicken breast and leg meat of YBC, respectively. C20:4n6 was mainly found in phospholipids (Tian et al., 2012), which were the most important precursors of flavor substances in chicken. Some researchers studied the contents of fatty acids and small molecular metabolites in frying chicken under different methods of cooking and found that boiled chicken had the highest content of arachidonic acid (Yu et al., 2021), frying chicken had the highest content of oleic acid, eicosapentaenoic acid (EPA) and docosahexaenoic acid (DHA). In addition to the differences in fatty acid content and types of local chickens, cooking methods may also affect the fatty acid content and types of local chickens.
The total fatty acid content of chicken breast and leg meat of PC was 44.47% (p<0.05) and 27.54% (p<0.05) higher than YBC, respectively, indicating that the variety had an obvious effect on the fatty acid content of chicken, which was consistent with previous conclusions (Pavlovski et al., 2013). For different parts of the same variety, the total content of fatty acids in YBC and PC chicken legs was 91.89% (p<0.05) and 69.41% (p<0.05) higher than that in chicken breasts, respectively, which may be related to the differences in the amount of exercise and metabolism of muscles in different parts, and leg meat obtained higher energy during the exercise of chickens and deposited more intermuscular fatty acids.
The higher the content of UFA in chicken, the stronger the final flavor of chicken will be, which may be because UFA is easier to undergo automatic oxidation than SFA. And under proper heat-induced conditions, the automatic oxidation of UFA produces hydroperoxides, which continue to react to produce flavor substances such as alcohols, and aldehydes (Almela et al., 2010; Xun et al., 2021; Zhao et al., 2019). Xiao et al. (2021) compared the contents of water-soluble compounds and fatty acids in typical commercial broilers with those in Yunnan native chickens (Yanjin blackbone chicken and Wuding chicken) and found that the contents in two Chinese native chickens were significantly higher than those in common commercial broilers (p<0.05). Hence, the flavor quality of PC was higher than that of YBC from the point of view of the evaluation of fatty acids.
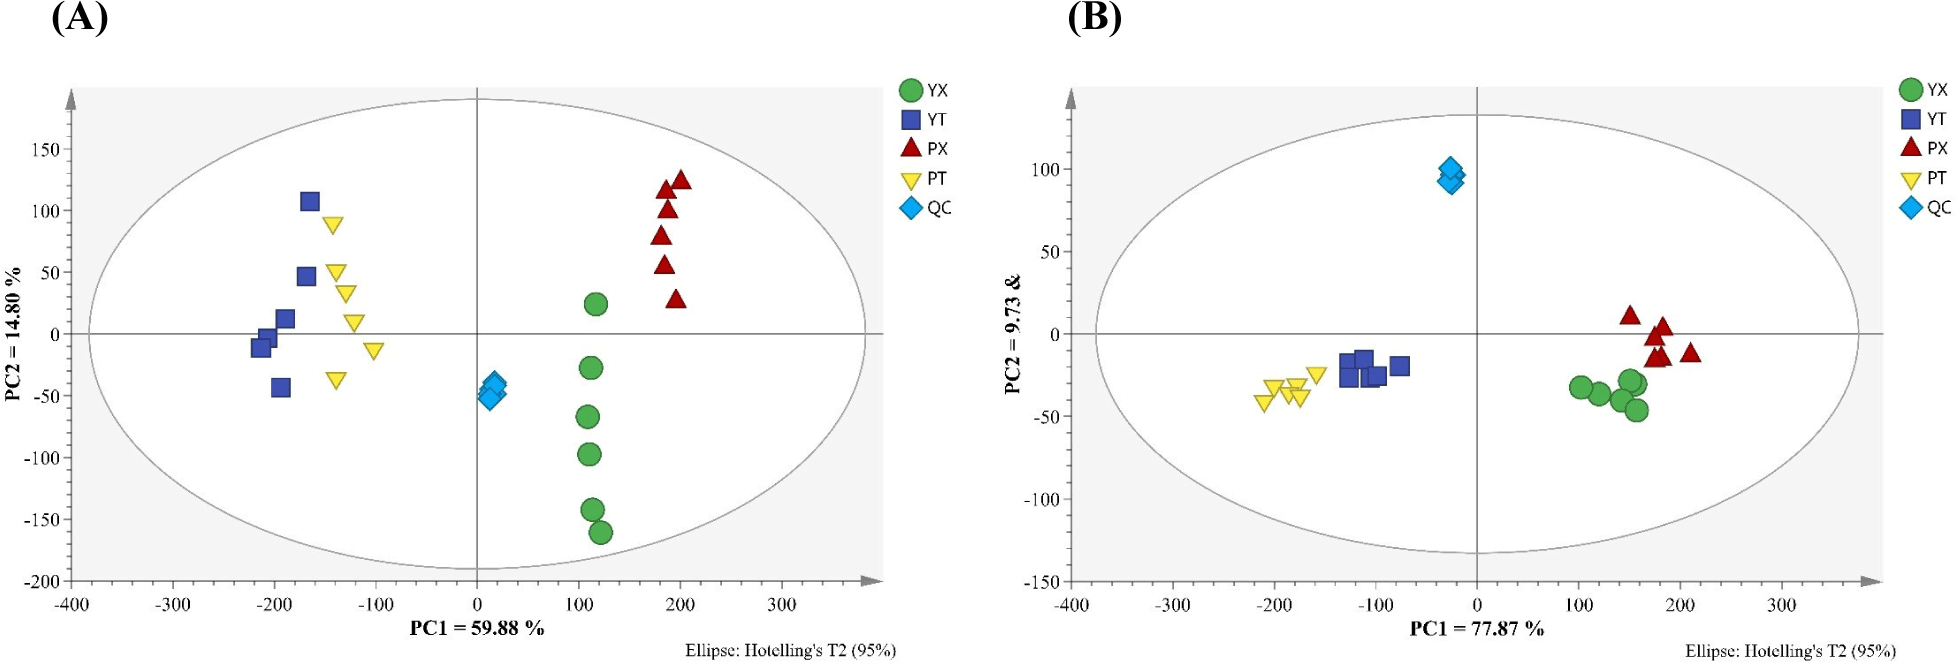
Small molecular metabolites are important flavor precursors in chicken and make very important contributions to the taste (Khan et al., 2015; Xiao et al., 2019b). LC-Q-Exactive-MS was used to identify small molecular metabtolites in YBC and PC, and the results are shown in Supplementary Table S1, Supplementary Table S2, and Supplementary Fig. S2 of the Supplement Materials. 106 and 67 small molecular metabolites, including amino acids, small peptides, lipids, nucleotides, organic acids, and their derivatives, were identified in positive and negative ion modes in different chicken samples, which was consistent with previous studies (Xiao et al., 2019b). Data on small molecular metabolites in samples were analyzed by the multivariate statistical pattern recognition method to better understand the distinction between small molecular metabolites in YBC and PC chicken. The results are shown in Fig. 2, which demonstrate that all samples were within the 95% confidence interval and that different groups of samples had their distinct distribution areas without coincidence, indicating that the composition and content of small molecular metabolites differed significantly between the two.

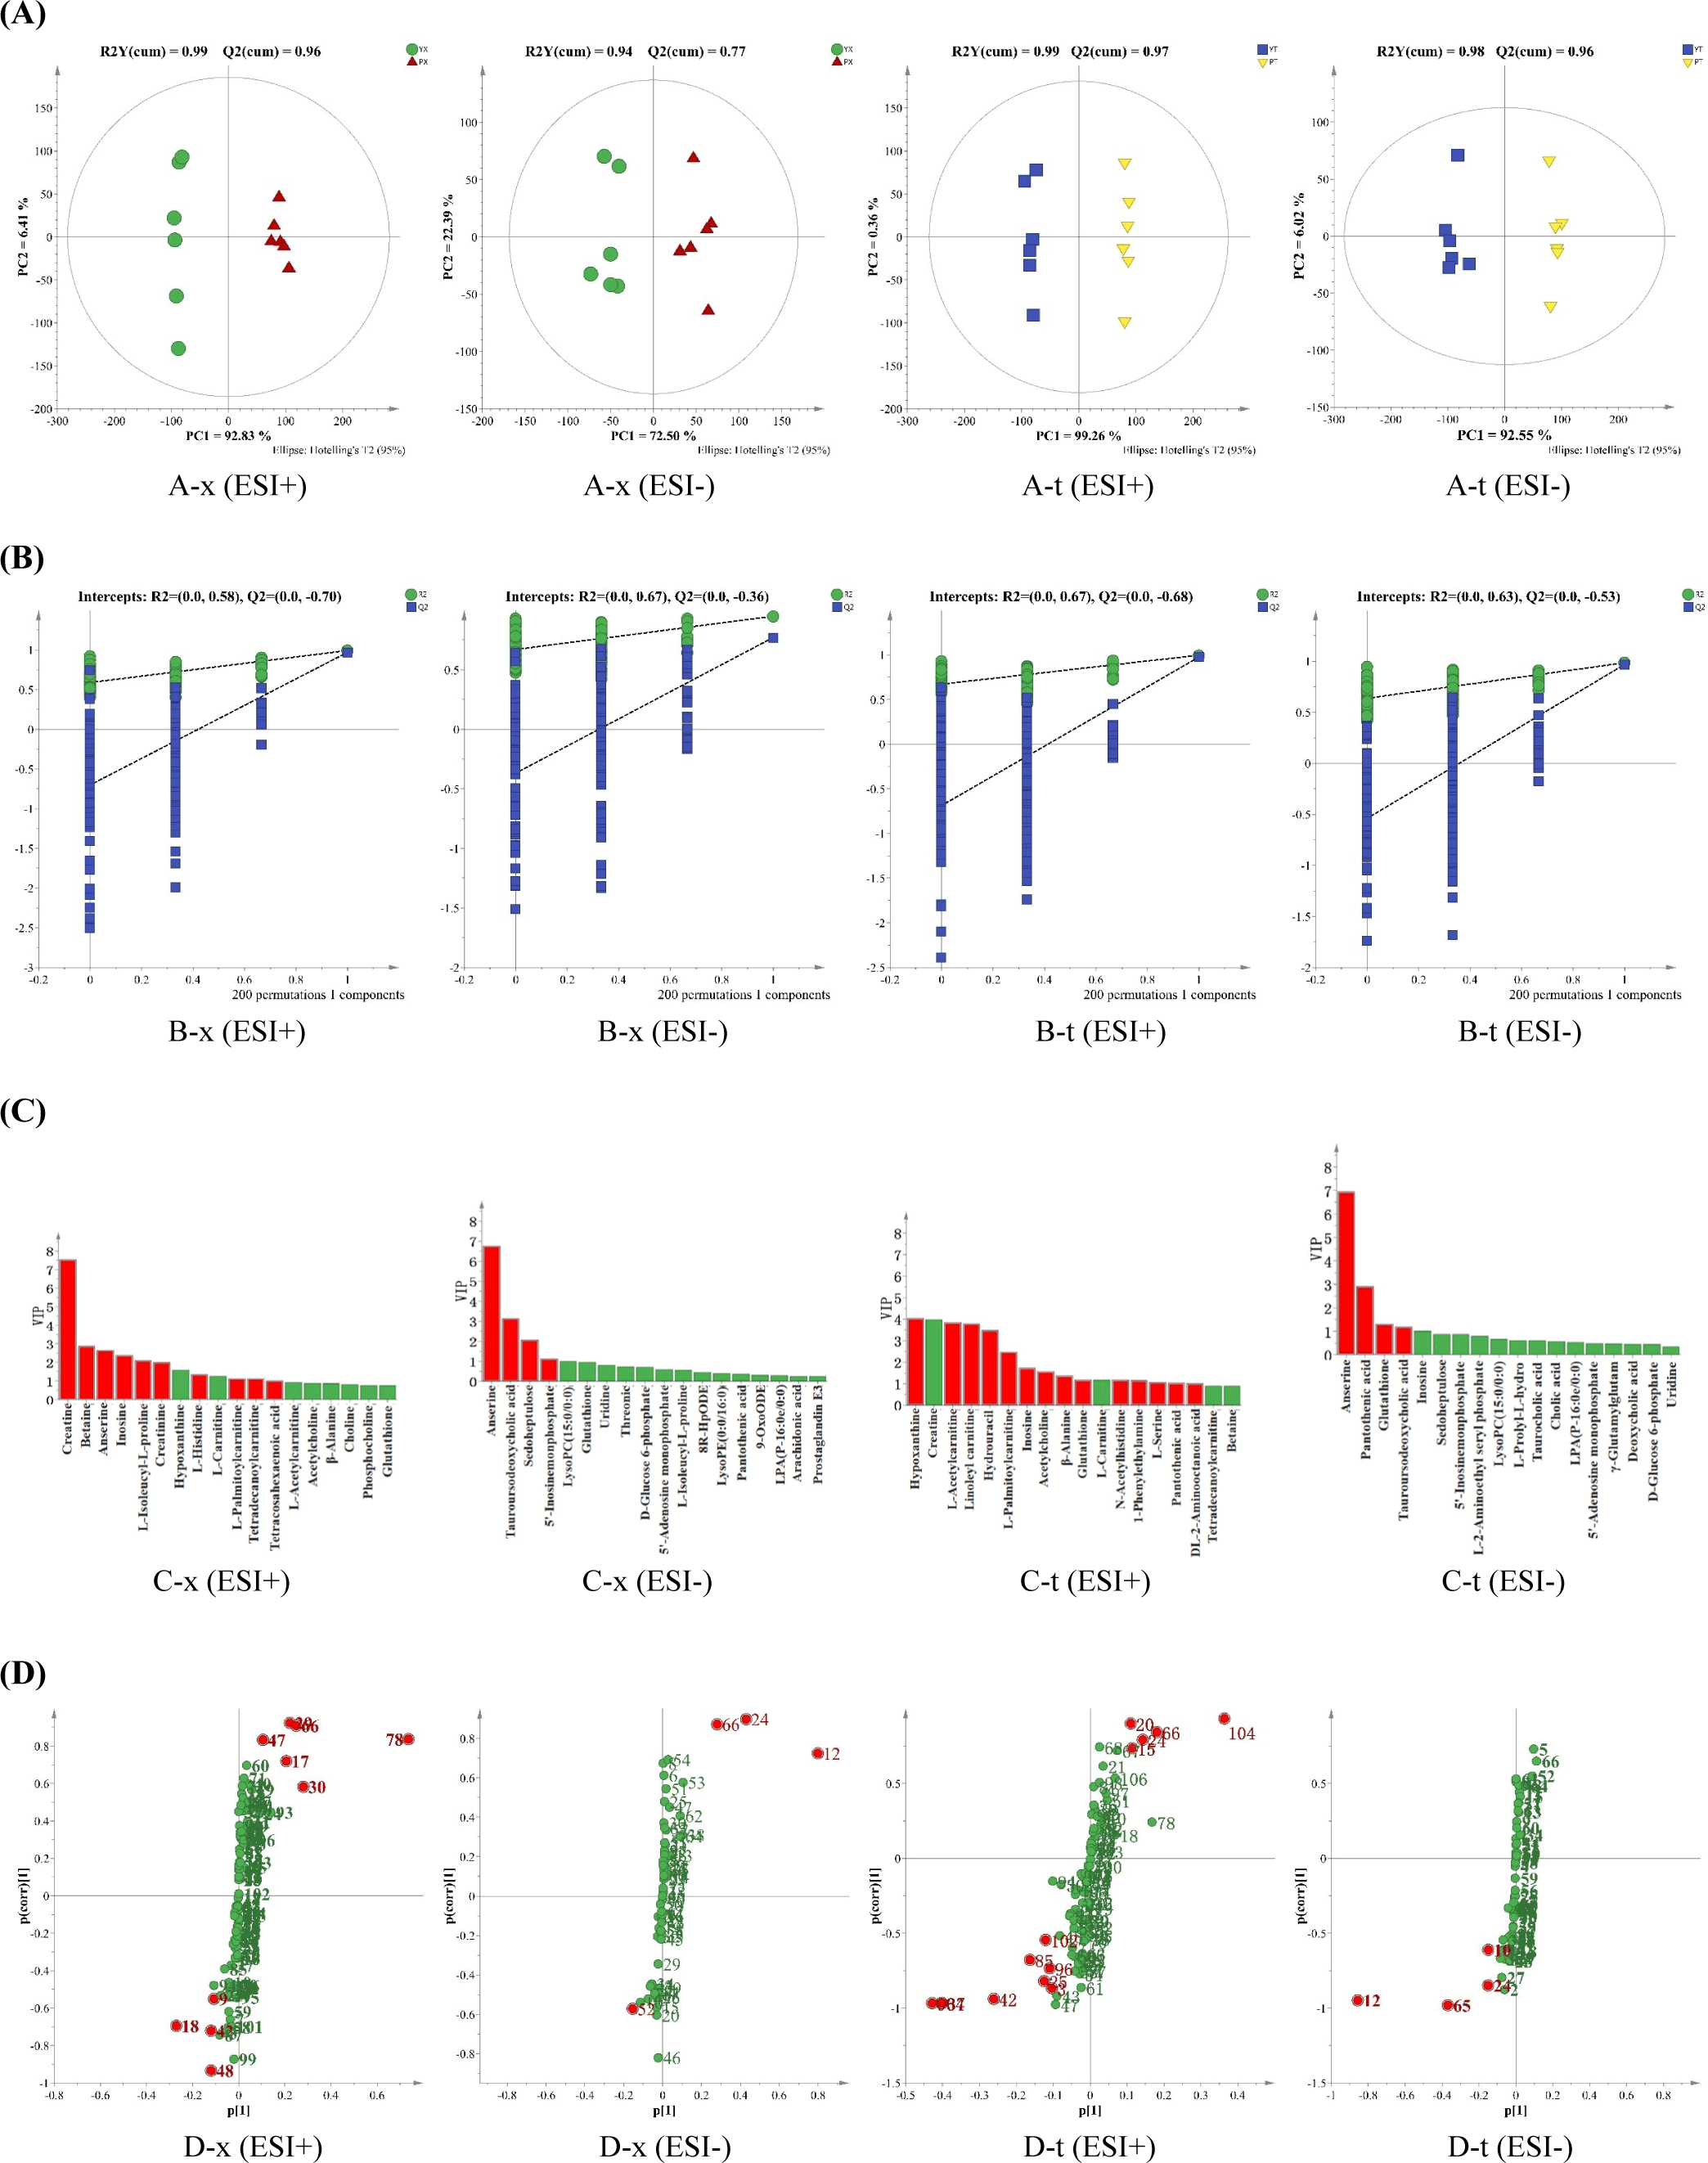
The OPLS-DA scores of small molecular metabolites in chicken breast and leg meat of YBC and PC are shown in Fig. 3A. In positive and negative ion modes, all samples were within 95% confidence intervals, and the four groups of samples were separated in the first principal component direction, where R2 (cum) and Q2 (cum) respectively represented the model’s interpretation of the Y variable and the model’s predictability, and the closer the two values were to 1, the better. In chicken breast, R2 (cum)=0.99 and Q2 (cum)=0.96 under positive ion mode, and R2 (cum)=0.94 and Q2 (cum)=0.77 under negative ion mode; the R2 (cum)=0.99, Q2 (cum)=0.97 in the positive ion mode, and R2 (cum)=0.98, Q2 (cum)=0.96 in the negative ion mode in the chicken leg indicated that the model had a high interpretation rate and good prediction ability (Chong and Xia, 2018).

Only Q2 (cum) was not enough to prove the reliability of the OPLS-DA model, and to judge whether the model was overfitting, a replacement test was conducted on the model. As shown in Fig. 3B, all R2 and Q2 points simulated were lower than the original values, and the intercept of Q2’s regression line and Y-axis was less than zero, indicating that the model was stable and reliable and no overfitting occurred. In order to further screen differential compounds, VIP>1 was selected in combination with an S-type loading diagram, and the results are shown in Figs. 3C and D. The VIP value reflects the importance of variables to the model, and the larger the value, the greater the overall contribution of variables to the model. The S-type loading diagram was first proposed by Wiklund et al. (2008), which helps extract potentially differentiated compounds.
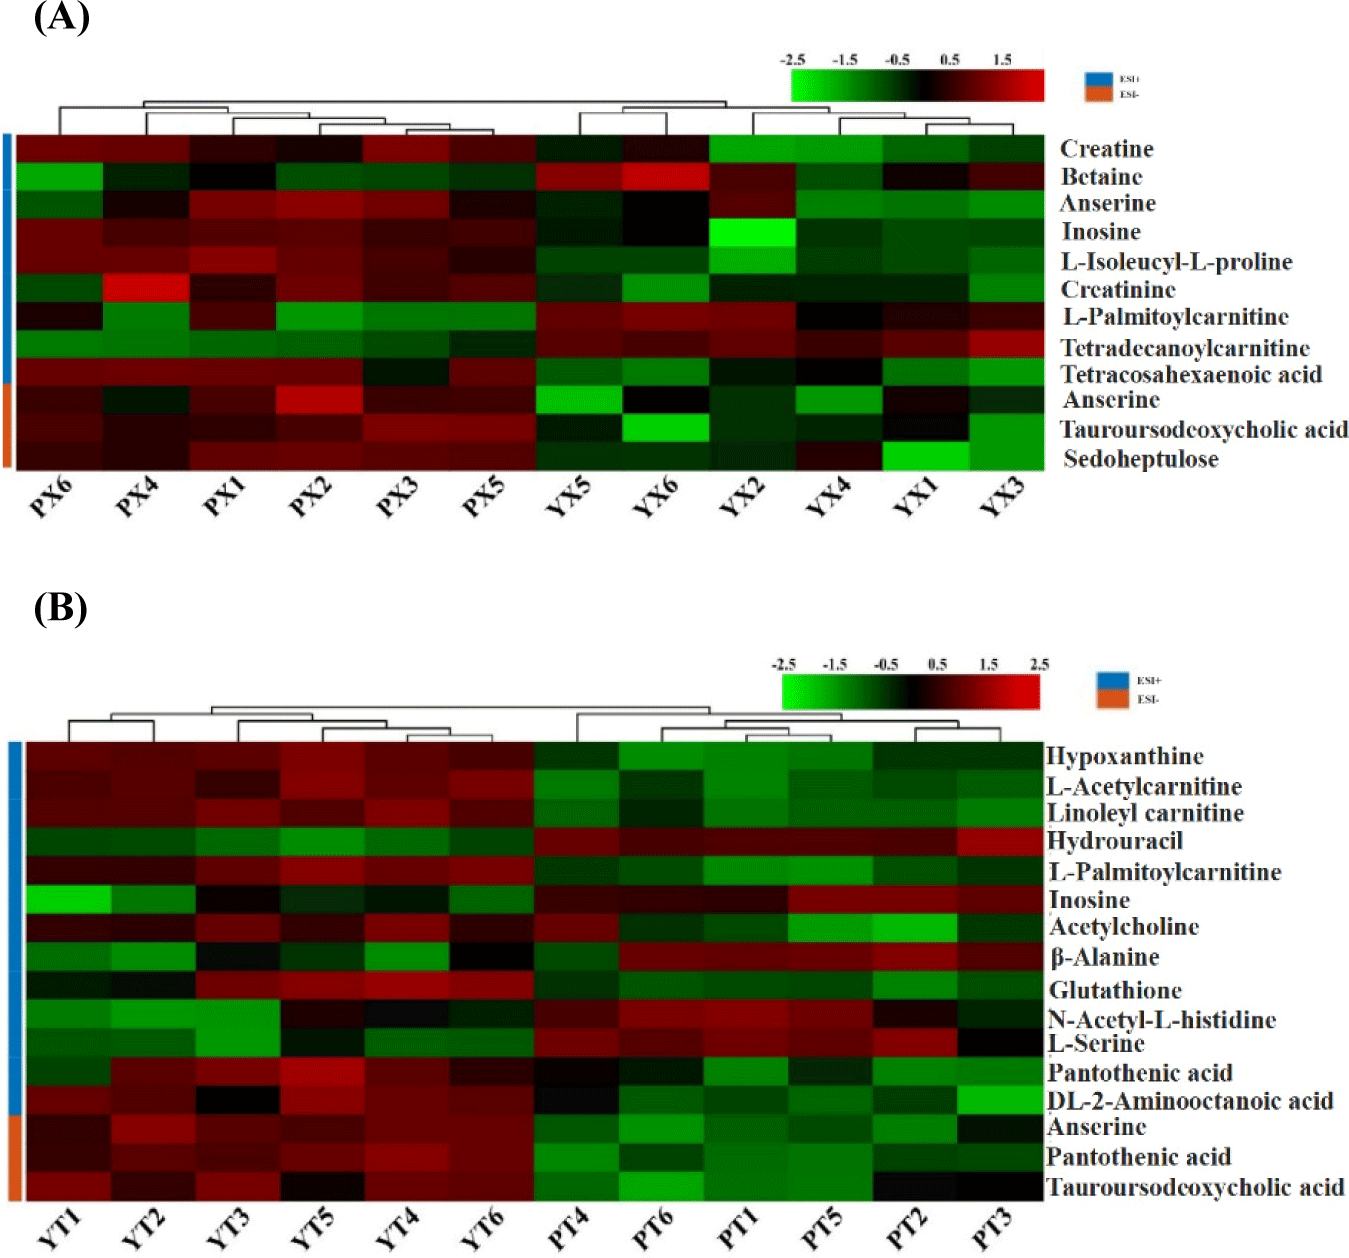
From YBC and PC chicken breast and chicken leg, a total of 12 and 16 substances that made important contributions to the difference between groups were screened, respectively, as shown in Table 2 and Fig. 4, which mainly included creatine, inosine, anserine, hypoxanthine, pantothenic acid, and other compounds. The content of palmityl carnitine in chicken breast and leg meat of YBC was higher than that in PC, while the content of inosine in chicken breast and leg meat of PC was higher than that in YBC. Compared with the chicken breast of PC, the content of betaine, palmityl carnitine, and tetracylacyl disacylcarnitine, was higher in YBC chicken breast, and the content of creatine, anserine, and inosine, was lower; compared with PC chicken legs, the content of hypoxanthine, pantothenic acid, and anserine in YBC chicken legs was higher than that in pyrimidine drumsticks, while the content of inosine, -alanine, and L-serine was lower. Yu et al. (2021) found that the total amount of small-molecule metabolites in each group decreased after boiling, frying, and roasting PC. Xiao et al. (2019b) found that lactic acid, creatine, taurine, and anserine in Wuding chicken accounted for about 75% of the total water-soluble small molecule compounds, which decreased significantly during processing.

Anserin has been found to have special antioxidant properties and is a bioactive endogenous compound (Peiretti et al., 2012), which can be considered an additional nutritional factor for meat (Jayasena et al., 2015). Creatine is mainly related to muscle energy metabolism, and its content depends on the type of muscle metabolism (Reig et al., 2013). In addition, the increase in creatine content has a certain cushioning effect on the decline of the pH of chicken after slaughter, which may improve its hydrodynamics. Inosine is generally caused by an increase in adenosine diphosphate from the degradation of adenosine triphosphate (ATP) in meat, and adenosine monophosphate is formed under the action of creatinase, which in turn is further formed under the action of the enzyme inosinemonophosphate (IMP), which is an important umami substance in chicken (Dashdorj et al., 2015; Yue et al., 2016).
Livestock and poultry meat belong to the middle purine class of food, dominated by hypoxanthine, and in the early stage of slaughtered chicken leg meat, there is more ATP, which is converted into inosine through enzyme decomposition and then further decomposed into hypoxanthine, ribose, and other substances. Although hypoxanthine itself has a certain bitterness, it has been shown to enhance the overall taste of dry-cured meat products (Ichimura et al., 2017). β-alanine is an amino acid that does not participate in protein synthesis and can be used as a precursor to synthesize carnosine, anserine, and other muscle-active peptides. L-serine is a sweet amino acid and a precursor to the synthesis of purine, thymine, and choline. Pantothenic acid, also known as vitamin B5, is a water-soluble vitamin that plays an important role in the formation of melanin in the body, and the content of pantothenic acid in YBC chicken legs is higher than that in PC, which may be related to its own higher aconitum.
Conclusion
The contents and differences of fatty acids and small molecular metabolites in the breast and leg meat of YBC and PC were analyzed by GC-MS and LC-Q-Exactive-MS in this study. Thirty-two fatty acids were determined in YBC and PC, among which UFA accounted for the largest proportion, and their content in descending order was PC leg (8,495.19 μg/g), YBC leg (66,660.76 μg/g), PC breast (5,014.55 μg/g), and YBC breast (3,471.09 μg/g). C18:1, C18:2n6, C16:0, C18:0, and C20:4n6 were the five main fatty acids in the two chicken varieties. The total fatty acid content of PC was significantly higher than that of YBC (p<0.05), and the fatty acid content of chicken breast was significantly lower than that of chicken leg (p<0.05). A total of 12 and 16 substances were selected from YBC and PC chicken breast and chicken leg, respectively, which had an important contribution to the difference between groups. This study provided a scientific theoretical basis for further development and utilization.


