Introduction
Whey, a by-product resulting from the production of cheese, is a generic term for the remaining water-soluble components other than cheese (milk concentrate curd). With the exception of casein, which is involved in cheese production, whey is valued highly nutritionally and physiologically because of the presence of active ingredients including proteins, lactose, minerals, vitamins, and inorganic components (Boscaini et al., 2023; Yiğit et al., 2023).
Whey protein (WP) not only boosts immunity due to the presence of β-lactoglobulin (β-LG), α-lactalbumin (αLA), bovine serum albumin, lactoferrin (LF), immunoglobulin (Ig), enzymes, and glycomacropeptide, and is also a source of essential amino acids (Marshall, 2004). Though it is obvious that WP is an excellent nutritive food, some of its components have been linked to allergic conditions in infants and young children (Jaiswal and Worku, 2022; Wright et al., 2022). Among the above mentioned proteins, the major antigens include casein, β-LG, and αLA, and it has been reported that most patients allergic to milk allergy have specific IgE antibodies against at least two antigens (Cohen et al., 2022; Savilahti and Kuitunen, 1992; Sicherer and Sampson, 1999). Among WPs, β-LG is known to be more allergenic than αLA. In human milk, in particular, β-LG is present in smaller amounts ranging from 1–150 μg/mL (Exl and Fritsché, 2001), and its content is lower than that of casein, another allergen of milk, which comprises approximately 7% to 12% of milk protein.
To lessen milk allergies, β-LG is hydrolyzed using digestive enzymes, and hypoallergenic milk powder prepared using proteolytic enzymes is commercially available (Lynch and Buckin, 2022). To reduce milk allergic reactions, it is necessary to provide a diet that restricts the causative milk or provided in a form that lowers the antigenicity of milk. Different treatment methods, such as heat, ultra-high pressure (Landim et al., 2023), and enzymes, can be used to reduce the antigenicity of proteins. Because one of the main allergens in milk, casein, is heat-resistant, the reduction in antigenicity by heat treatment is insignificant (Bu et al., 2013; Vandenplas et al., 2022). Thus, milk proteins containing both structural and sequential epitopes are mainly hydrolyzed by enzymes. Although it doesn’t exist in human milk and has a lower content than αLA, the primary allergen of WP, β-LG, shows resistance during digestion in the stomach and penetrates the intestines to cause milk allergies.
Therefore, this study aimed to prepare WP hydrolysates (WPH) with reduced antigenicity of α-LA and β-LG allergens as target substrates. Optimal hydrolysis conditions for degrading antigenic WPs using a mixture of endo- and exo-type enzymes were selected using response surface methodology (RSM). By preparing a hypoallergenic whey protein hydrolysate (HWPH), we developed a milk protein manufacturing technology that can be fed to milk-allergic infants. The digestibility and immune stimulation of the prepared hydrolysate were also evaluated.
Materials and Methods
In this study, whey protein concentrate (WPC; Agri-mark, Coral Gables, FL, USA) with a protein content of 80% (dry basis) was used as the raw WP. A 75% α-LA and a 95% β-LG from bovine milk (Samyoung Innovation, Pyeongtaek, Korea) were used as the allergen standards. Alcalase (Novozymes, Copenhagen, Denmark), protamex (Novozymes), flavourzyme (Novozymes), and collupulin (DSM, Heerlen, Netherlands) were employed as endo-type proteolytic enzymes, whereas prozyme (DuPont, Wilmington, DE, USA) was used as an exo-type enzyme. Pepsin and pancreatin (Sigma-Aldrich, St. Louis, MO, USA) were used as the artificial digestive enzymes. L-leucine was purchased from Sigma-Aldrich.
To prepare the whey protein hydrolysate, a mixture of endo- and exo-type protease enzymes was added to a 10% suspension of WP at a concentration of 1.0% (v/w) relative to the substrate solution. This was then hydrolyzed for 8 h at 50°C at pH 7.8 with shaking at 70×g. Each reaction solution was treated at 90°C for 10 min to inactivate protease and then centrifuged at 5,500×g for 20 min to separate the supernatant. A WP solution without protease treatment was used as a control. The reaction conditions and enzyme characteristics used for WP hydrolysis are listed in Supplementary Table S1.
HWPH (10 mg) was dissolved in 1 mL of sample buffer [0.5 M trihydrochloric acid (HCl), glycerol, 10% SDS, 0.1% bromophenol blue, pH 6.8], heat-treated at 100°C for 5 min, centrifuged, and the supernatant separated. A 20 μL of this was run on a 12% polyacrylamide gel at 135 V for approximately 90 min. To confirm the presence of α-LA and β-LG proteins, the gel was stained with Coomassie Brilliant Blue R-250 for 6 h, and then destained using a solution containing 10% methanol and 10% acetic acid until the protein bands were clearly visible.
The A-N content of HWPH was measured using the 2,4,6-trinitrobenzensulfonic acid (TNBS) method (Nielsen et al., 2001). Briefly, 125 μL of the sample, 400 μL of 0.212 M phosphate buffer (pH 8.2), and 0.4 mL of 0.1% TNBS were mixed and incubated in the dark at 50°C for 60 min. Next, 0.8 mL of 100 mM HCl was added and left for 20 min. After another 10 min, 0.8 mL of distilled water was added, and the absorbance was measured at 340 nm. The amount of A-N was calculated using L-leucine as a standard.
The DH of proteins following enzyme treatment was calculated using the following equation by estimated the A-N content of whey protein hydrolysates (Benjakul and Morrissey, 1997). The total A-N content was measured by neutralizing WP with sodium hydroxide (NaOH) after hydrolysis at 100°C for 24 h using 6 N HCl.
Where Lt is the A-N content after hydrolysis at time t, while L0 is the A-N content before hydrolysis, and Lmax is the A-N content after acid hydrolysis with 6 N HCl.
The RSM was used to select the optimal mixing ratio of Alcalase and Prozyme. A total of 15 combinations were composed of three repetitions of the experiment at 10% substrate, 50°C, pH 7.8, with the mixing ratio of the two enzymes, Alcalase and Prozyme, as an independent variable (Supplementary Table S2). The optimal mixing ratio of the two enzymes was selected by measuring the A-N of the hydrolysate corresponding to the experimental combination. RSM was used to analyze the experimental results, and the regression equation representing the optimal mixing ratio of Alcalase and Prozyme was as follows:
where X is Alcalase (%) and Y is Prozyme (%).
A total of 39 combinations were composed of three repetitions of the experiment at 10% substrate, 50°C, pH 7.8, with the amount of enzyme added and hydrolysis time by the mixed enzyme of Alcalase and Prozyme as independent variables (Supplementary Table S3). The A-N of the hydrolysate corresponding to the experimental combination was measured to select the optimal enzyme addition amount and hydrolysis time. RSM was used to analyze the experimental results, and the regression equation representing the optimal conditions for the amount of enzyme added and hydrolysis time was as follows:
where X is the hydrolysis time and Y is the amount of the enzyme added.
Amino acids were derivatized using AccQ-Tag reagent (Waters, Milford, MA, USA) according to the manufacturer’s instructions and then analyzed using an HPLC system (Waters). An AccQ-Tag column (3.9 mm×150 mm, Waters) was used with the following parameters: temperature, 37°C; flow rate of the mobile phase [Water AccQ-Tag Eluent A (acetate-phosphate buffer), acetonitrile, and Milli-Q Water], 1.0 mL/min, and a fluorescence detector (250 nm of excitation and 395 nm of emission) was used to analyze the data.
The analysis for total amino acids was performed after acid hydrolysis. Briefly, 10 mL of 6 N HCl solution was added to 0.5 g of the samples taken in a test tube, which was sealed and hydrolyzed at 110°C for 24 h. The filtrate obtained was centrifuged, and the supernatant concentrated at 50°C to completely evaporate the acid and water, and then diluted to 5 mL using 20 mM HCl (pH 2.2). The dissolved solution was filtered through a 0.45 μm membrane, and the filtrate was used as a sample for HPLC analysis.
In vitro digestibility was determined as described by Garrett et al. (1999) using pepsin and pancreatin. After dissolving 1,000 mg of the sample in distilled water, the pH was adjusted to 2.0. Pepsin (2.5% of the substrate) was added, reacted at 37°C for 1 h, and the pH was then adjusted to 5.3 with sodium bicarbonate and further adjusted to 7.5 with 5 N NaOH. Pancreatin was added at 4% per substrate, reacted at 37°C for 2 h, and was then heated at 90°C for 10 min to inactivate the digestive enzyme. A-N (mg) was measured in the supernatant obtained by centrifugation (14,000×g, 10 min), and digestibility (%) was calculated using the following formula:
Total A-N in sample before digestion: A-N content after acid hydrolysis.
A Caco-2 Ready 24-well plate (Komabiotech, Seoul, Korea) was used for the permeability analysis of WP and HWPH (van Breemen and Li, 2005). The plate was incubated in a 5% CO2 incubator (37°C) for 4 h, thawed, and then replaced with Dulbecco’s Modified Eagle’s Medium containing 1 g/L glucose, 10% fetal bovine serum, and 1% glutamine. The assay was conducted 48 h after the medium was replaced. For the intestinal permeability analysis, WP and HWPH prepared using digestive enzymes (pepsin and pancreatin) were diluted 10-fold with HBSS buffer. After washing the Caco-2 plate with a complete monolayered film three times using HBSS buffer, 250 and 750 μL of the diluted sample and HBSS buffer were dispensed into the insert and receiver plates, respectively. The buffer on the receiver plate was recovered over time (20, 40, 60, and 120 min). After analyzing the protein content of the sample initially distributed in the insert and the sample collected over time using the bicinchoninic acid assay, the permeability of the sample was analyzed using the following formula (Park et al., 2021):
Sprague-Dawley (SD) rats (6-week-old, male) were purchased from Oriental Bio (Seongnam, Korea). The animals were housed in a breeding room at 21±1°C, a relative humidity of 50%–55%, and a light-dark cycle of 12 h. Drinking water and feed were provided ad libitum. After acclimation for a week, four SD-rats were randomly assigned per experimental group. WP and HWPH were orally administered at 500 mg/kg, sacrificed according to the sample administration times (20, 40, 60, and 120 min), and blood was collected. Blood samples were collected from the control group at 0 min. Following centrifugation (2,000×g, 15 min, 4°C), serum was collected to measure the total A-N content. All animal experiments were approved by the Korea University Animal Experiment Ethics Committee (KUIACUC-2022-0095).
To measure the molecular weight distribution of the hydrolysate using HPLC, the sample was filtered (microfilter, 0.45 μm) and 20 μL was injected into a Superdex G-75 column (10×300 mm, GE Healthcare, Anaheim, CA, USA). Subsequently, absorbance was measured at 220 nm, and the column was eluted with 50 mM ammonium formate buffer (pH 5.5; 0.5 mL/min). The molecular weight distribution of the hydrolysate was measured according to the molecular weight distribution curve prepared using glutathione (MW 307), aprotinin (MW 6,512), cytochrome c (MW 12,384), enolase (MW 67,000), lactate dehydrogenase (MW 142,000), and glutamate dehydrogenase (MW 290,000) as standard proteins, which were purchased from Sigma-Aldrich.
A specific pathogen free male BALB/c mice aged 8 weeks were purchased from Daehan Biolink (Eumseong, Korea) and experimented under aseptic management (breeding room temperature, 25°C; humidity, 55%; and sterile distilled water supply). Mice were divided into groups administered 250 and 500 mg/kg of WP and HWPH, respectively, and a control group that was administered isotonic sodium chloride solution. Eight mice were included in each group. Gastric intubation was performed five times per week for 4 weeks. Body weight was measured twice a week at 3-day intervals. After administration, blood was collected and centrifuged at 2,000×g for 10 min to separate the serum.
After sacrifice, aseptically excised splenocytes for cell culture were dispensed into 24 well-culture plates and cultured in a CO2 incubator for 48 h. Subsequently, phytohemagglutinin (Sigma-Aldrich, 5 μg/L×106 cells) was added as a polyclonal stimulator for in vitro activation. The concentration of cytokines (INF-γ and IL4), antibodies (IgG2a and IgG1) and IgE in the cell culture medium were measured using an ELISA kit purchased from BD Bioscience (San Diego, CA, USA). For the small intestine cytokines, 2 mL of PBS was added to 0.5 g of duodenum aseptically extracted after sacrifice, vortexed, and left at 4°C for 2 days. Thereafter, the supernatant obtained by centrifugation was analyzed for cytokines and IgE using the ELISA kits.
Data were statistically analyzed using SPSS (ver. 12.0; SPSS, Chicago, IL, USA), and the mean and SD were calculated for all measured values. The significance between the experimental groups was tested by ANOVA, followed by Tukey’s multiple range test at p<0.05 level. RSM analysis was performed using Minitab 17 software (Minitab, State College, PA, USA) to confirm the suitability of the model to understand the relationship between the independent and dependent variables.
Results and Discussion
WP accounts for approximately 20% of the total milk protein. β-LG and α-LA are the major allergens, and serum albumin, Ig, and LF also act as allergens (Hochwallner et al., 2014). α-LA and β-LG are more effective in reducing allergic reactions using proteolytic enzymes due to their acid-resistant and heat-resistant structures (Stănciuc and Rapeanu, 2010; Yuan et al., 2018). Proteolytic enzymes under mild conditions convert proteins to shorter chain peptides and amino acids, yielding minimal byproducts. It is documented that enzymatic protein hydrolysis can alter the protein structure without compromising its nutritional value, thereby reducing the functional properties or allergens (Cui et al., 2023; Kheroufi et al., 2022).
To select enzymes that could degrade α-LA and β-LG, endo-type enzymes (Alcalase, Collupulin, and Protamex) and exo-type enzymes (Prozyme) were mixed, and hydrolysis was performed for 8 h. A combination of enzymes in which α-LA and β-LG were degraded was selected by SDS-PAGE. Following electrophoresis, the α-LA and β-LG bands were not seen in the hydrolysate prepared using the mixture of Alcalase and Prozyme, revealing that the two allergens were decomposed (Supplementary Fig. S1). Fig. 1 shows the A-N and DH in the hydrolysate obtained after treatment with the enzyme mixture. The levels of A-N and DH in the HWPHs obtained from by mixing Alcalase and Prozyme were significantly higher than those in the other hydrolysates. Thus, this mixture was the most suitable enzyme combination for the hydrolysis of α-LA and β-LG.
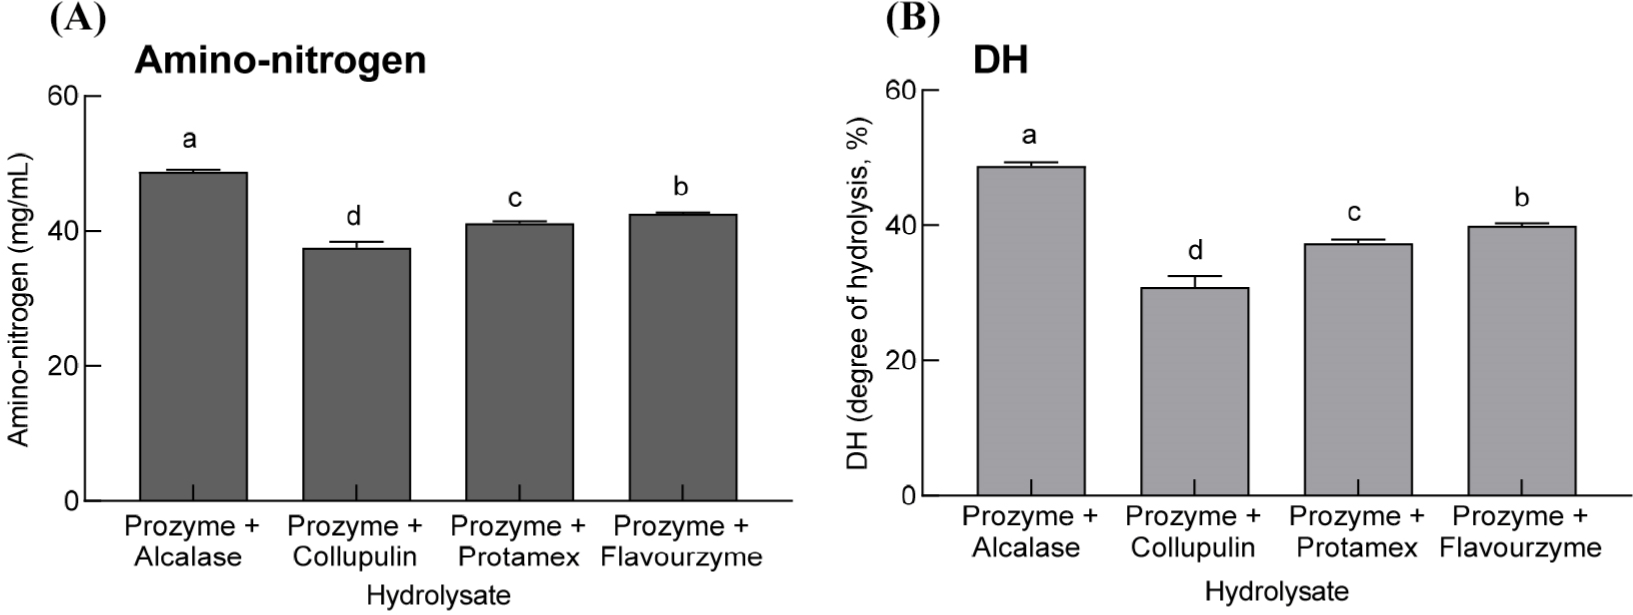
Proteolytic enzymes have different properties depending on the order of hydrolysis and the combination of endo-type enzymes that hydrolyze proteins roughly and exo-type enzymes that degrade proteins from the end (Villanueva et al., 1999). Alcalase, a serine protease (endo-type), cleaves the internal chains of proteins and peptides as well as peptide bonds following Glu, Met, Leu, Tyr, Lys, and Gln (Adamson and Reynolds, 1996). Prozymes are fungal exo-proteases from Aspergillus oryzae suitable for producing HWPH (Suh et al., 2017). Among the hydrolysates prepared using exo- and endo-type enzymes, α-LA and β-LG were not detected in the hydrolysates prepared using Alcalase and Prozyme, and their A-N content and DH were the highest (Fig. 1 and Supplementary Fig. S1).
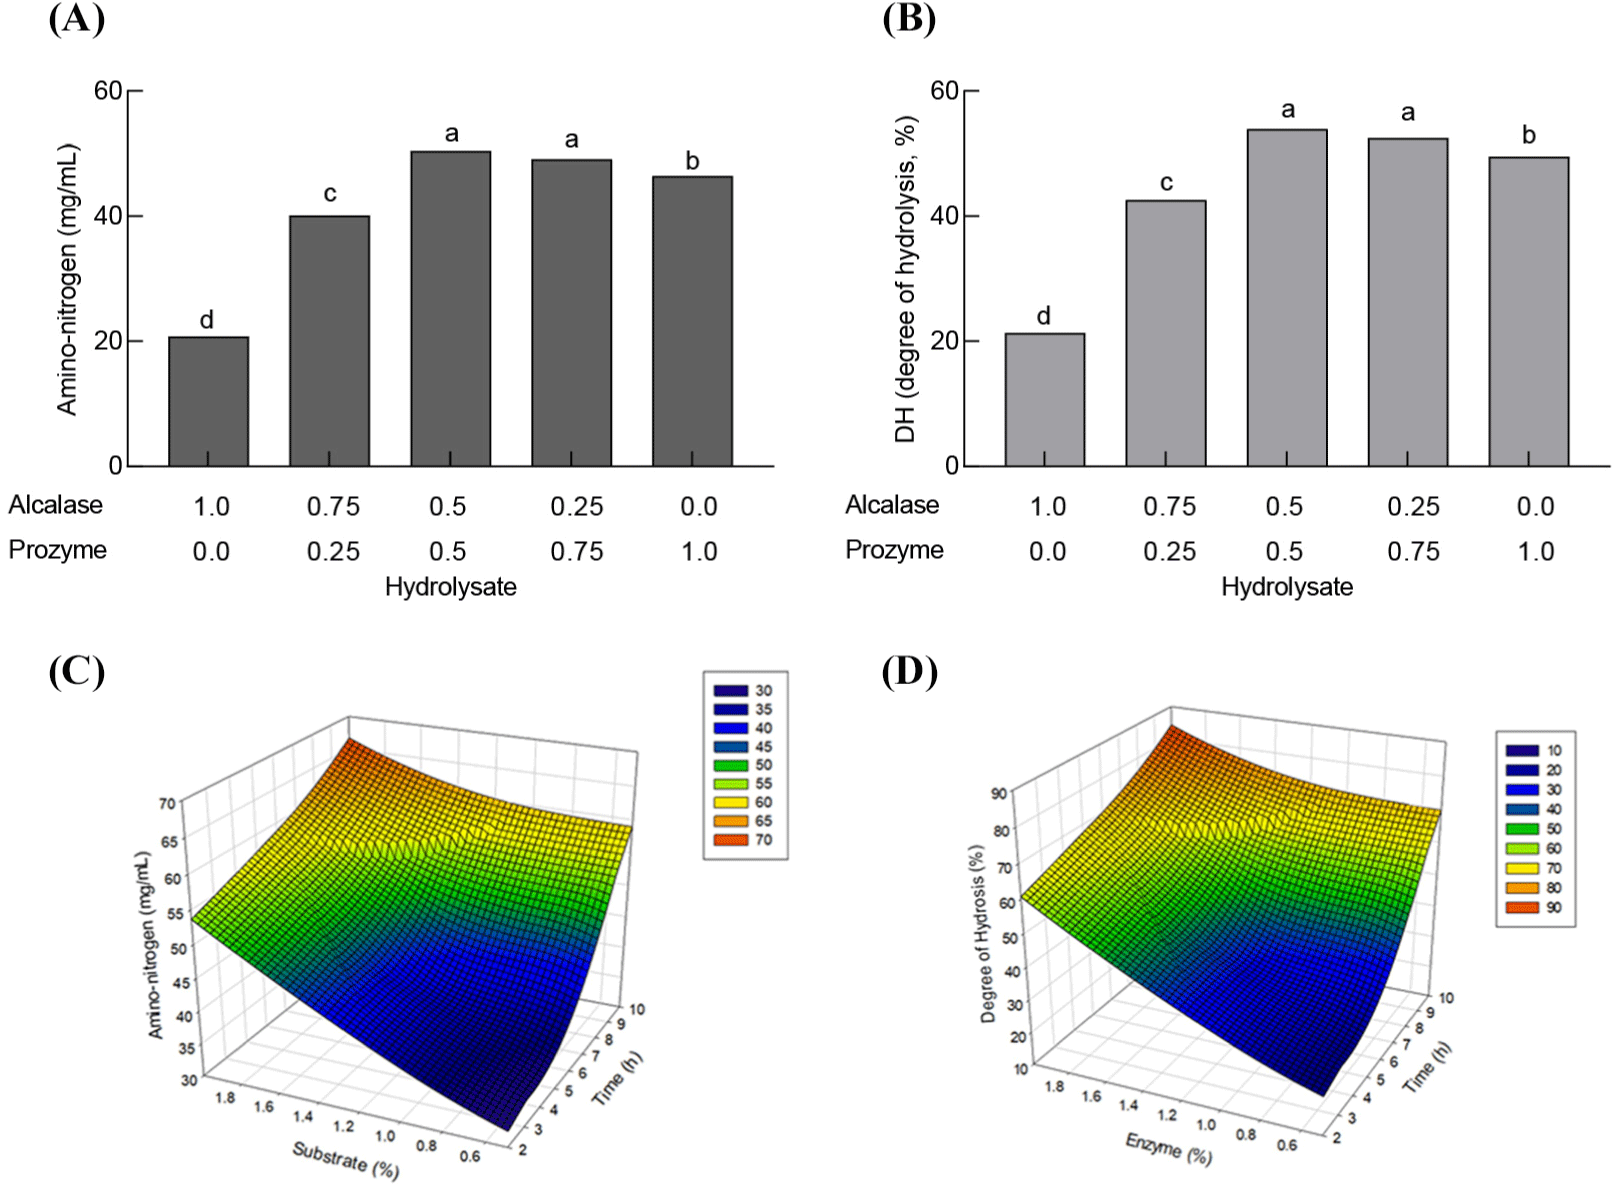
According to the 15 combinations recommended by the RSM, hydrolysates were prepared to choose the appropriate mixing ratio of Alcalase and Prozyme for the production of HWPH (Supplementary Table S2). DH was calculated by measuring the A-N content of the hydrolysate (Fig. 2). The A-N content and DH of the hydrolysate obtained by mixing Alcalase and Prozyme at 1:1 and 1:3, respectively, were significantly higher than those of the hydrolysate obtained at other mixing ratios (p<0.05). The regression equation for the A-N content obtained from the multiple regression analysis is as follows:
x: Alcalase (%), y: Prozyme (%), r2 = 97.54%.
As a result of predicting the optimal ratio of an enzyme mixture using RSM, when Alcalase and Prozyme were mixed 1:1, the A-N content was expected to be the highest at 50.42 mg/mL. The A-N content of the hydrolysate produced by Alcalase and Prozyme mixed in a 1:1 ratio, as predicted by RSM, was 51.52 mg/mL, and the actual measured value (50.42 mg/mL) was close to this predicted value. Thus, for the preparation of HWPH, the combination of Alcalase and Prozyme at 0.5/0.5 or 0.25/0.75 was most appropriate (Fig. 2).
Hydrolysis conditions such as temperature, pH, and enzyme–substrate ratio also affect protein hydrolysis (Diniz and Martin, 1997; Vieira et al., 1995). When enzymes are to be mixed, the mixing ratio plays an important role in determining the hydrolysate’s properties. The hydrolysate produced by the mixture of Alcalase and Prozyme at a ratio of 1:1 showed the highest A-N and DH (Fig. 2).
To select the optimal enzyme concentration and the hydrolysis time for HWPH production by the Alcalase-Prozyme mixture, the A-N content of the hydrolysate was measured according to the 39 combinations suggested by the RSM (Supplementary Table S3). The regression equation for the A-N content obtained from the multiple regression analysis is as follows:
X: hydrolysis time (h), Y: enzyme addition amount (%), r2 = 96.80%.
With an increase in the amount of enzyme and the hydrolysis time, the A-N content also increased (Fig. 2). The highest amount of A-N was observed when hydrolysis was performed for 10 h with the addition of 1.0% enzyme compared to the substrate. The expected amount of A-N at the optimal enzyme concentration and hydrolysis time predicted by RSM was 60.00 mg/mL, and the actual measured value of 59.58 mg/mL was close to this, with the r2 value being 0.968. To produce a HWPH by the Alcalase-Prozyme mixture, hydrolysis with 1.5% enzyme addition was found to be most suitable compared to the substrate for 8 h.
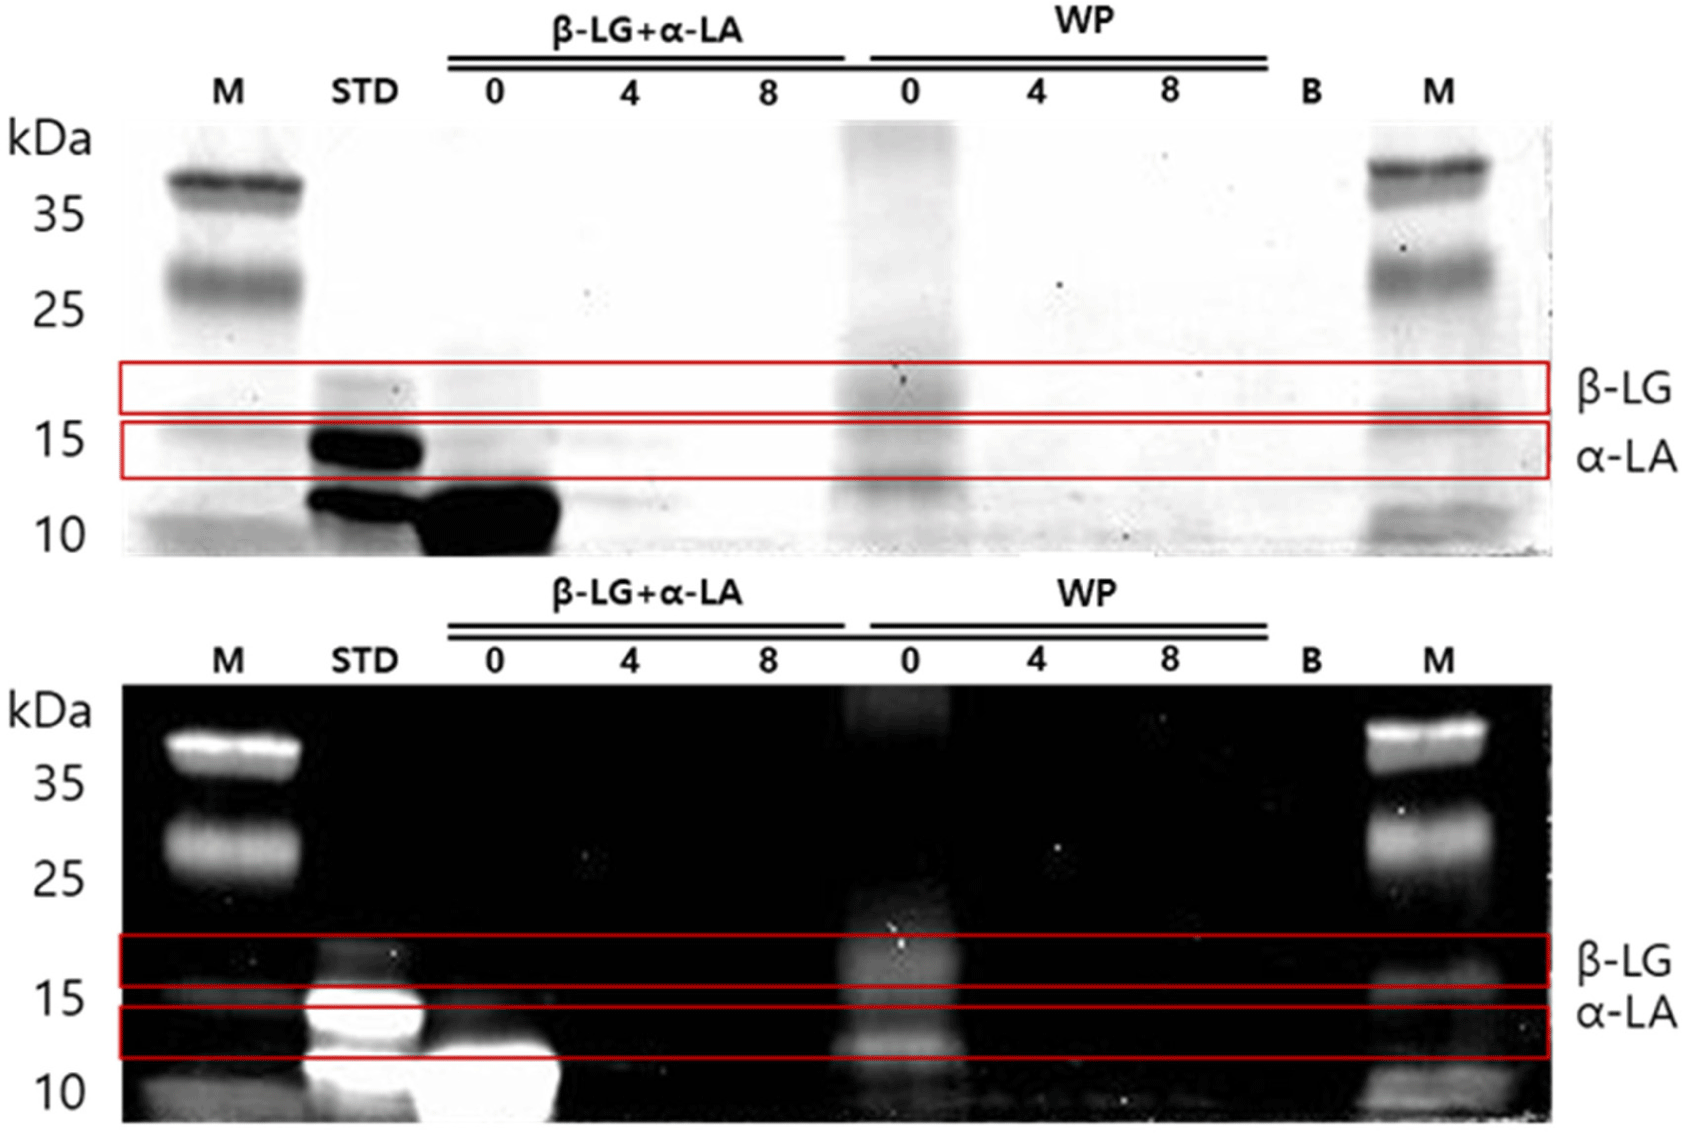
Under the optimal reaction conditions of the WPH to produce low allergens, when WP and allergen-inducing substances α-LA and β-LG were hydrolyzed as substrates, the decomposition of these substances was confirmed through gel electrophoresis (Fig. 3). The bands for these allergens appeared dark before hydrolysis (0 h), and faded after 4 h of hydrolysis. After an 8 h hydrolysis, almost no bands were visible, confirming that α-LA and β-LG were decomposed by the mixed enzyme treatment.
The amino acid composition of HWPH treated with Alcalase and Prozyme enzymes (Table 1) revealed the composition of free amino acids as 2,089.72±76.18 μmole/g and that of total amino acids as 4,987.21±93.44 μmole/g. In all, 17 types of free amino acids were detected, with leucine being the most prominent (16.8%, 351.73±4.62 μmole/g), followed by valine (13.8%), lysine (11.2%), and isoleucine (8.7%). As high levels of these amino acids cause bitterness, the bitterness in the sample was consistent with their presence.
Changes in A-N content and digestibility were measured when WP and HWPH were treated with the artificial digestive enzymes pepsin and pancreatin (Figs. 4A and B). As the digestion of pepsin and pancreatin progressed, the A-N content and digestibility tended to increase. WP and HWPH were more hydrolyzed by pancreatin treatment, and the increase in A-N content and digestibility was significantly higher than that by pepsin treatment. The amount of A-N at each stage of the digestive enzyme treatment was significantly higher in HWPH than in WP (Fig. 4A). As for the change in digestibility, HWPH, which had a high A-N content before hydrolysis, showed lower digestibility than WP in the pepsin treatment stage but a higher level of digestibility increase than WP in the pancreatin treatment stage was noted (Fig. 4B).
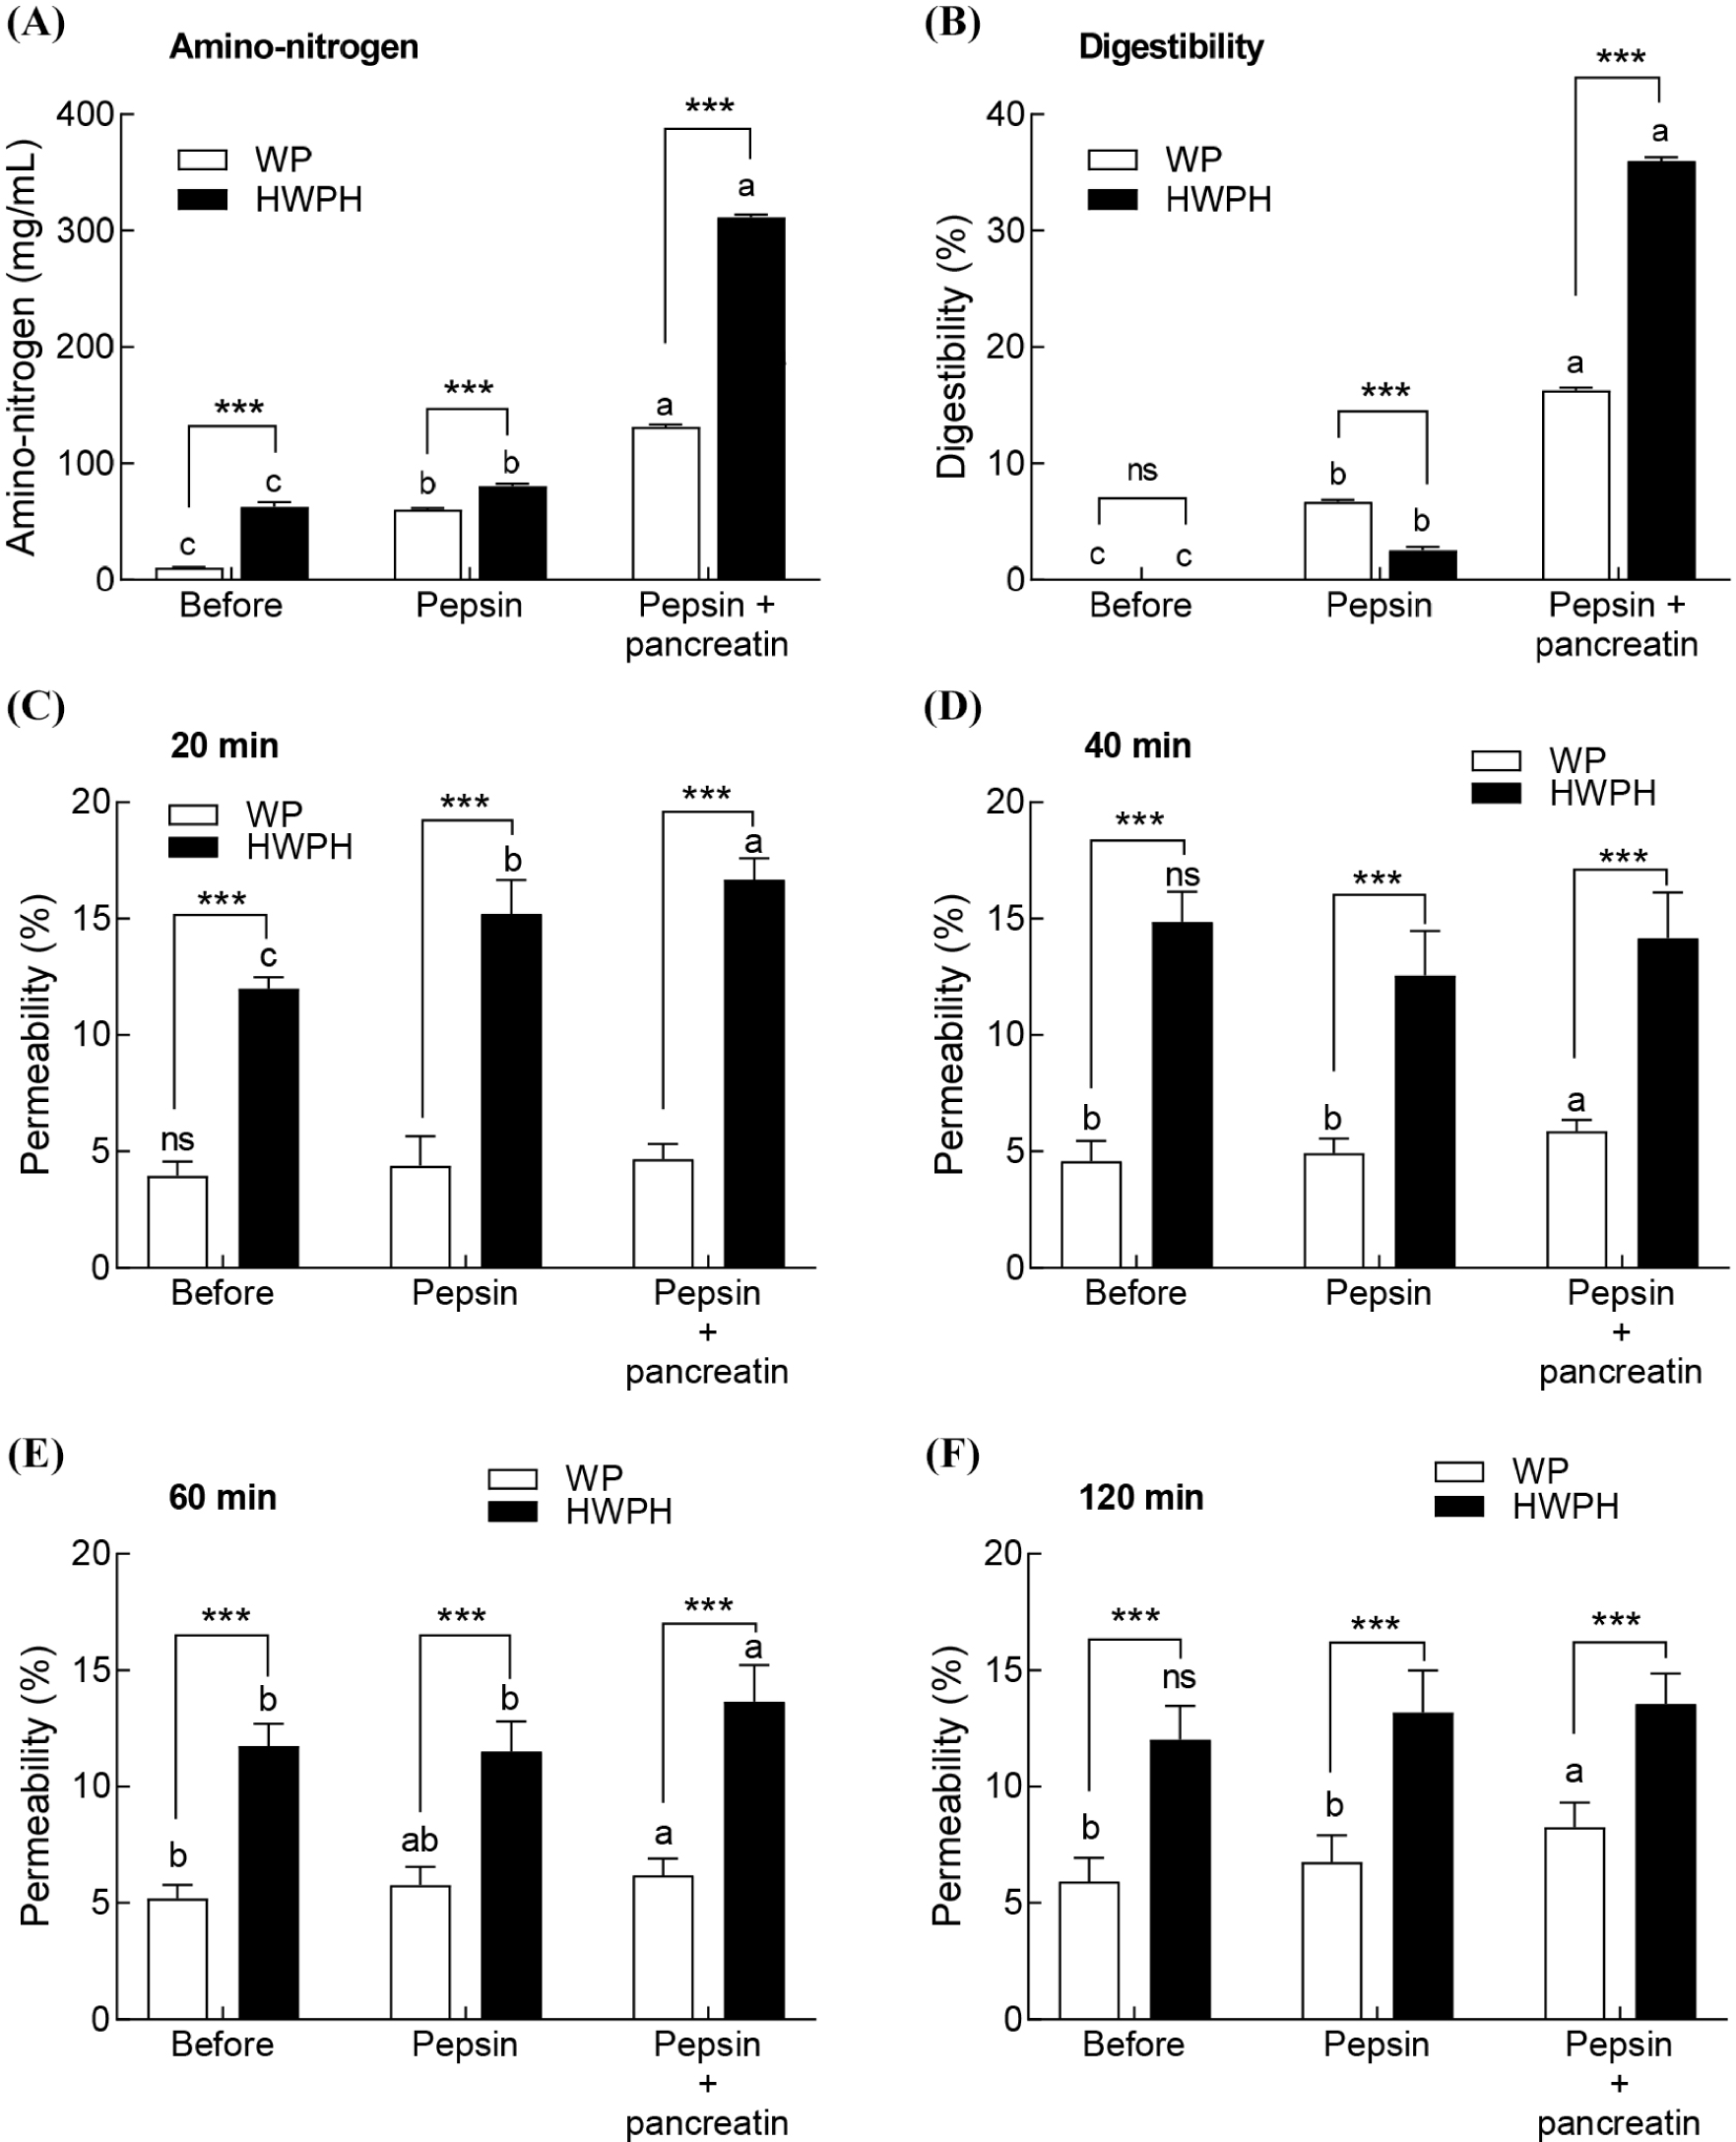
By measuring the intestinal permeability of Caco-2 cells (Figs. 4C, D, E, and F), it was confirmed that the permeability of HWPH was significantly higher than that of the WP sample at the indicated treatment time points of 20, 40, 60, and 120 min. The intestinal permeability of Caco-2 cells at each stage of treatment with pepsin and pancreatin was also significantly higher in HWPH than in WP. Thus, it was confirmed that the digestibility and intestinal permeability of HWPH determined by Alcalase and Prozyme were higher than those of WP.
The size of the peptides constituting the protein also affects the digestibility and absorption. Peptides of ≤500 Da have higher bioavailability than peptides of ≥2,000 Da (Feng and Betti, 2017; Wang and Li, 2017). Hydrolysates composed of small peptides are absorbed into the bloodstream through the intestinal wall and confer their effects (Chatterjee et al., 2018). WP and HWPH are converted into smaller peptides by pepsin and pancreatin and absorbed through the intestinal mucosa. During in vitro digestion, pancreatin treatment resulted in higher A-N content and digestibility than pepsin treatment (Fig. 4).
Changes in the amount of A-N in the blood were measured after the oral administration of WP and HWPH to SD rats (Fig. 5). Twenty min after oral administration, the highest amount of A-N was observed in the blood, which decreased gradually thereafter. After 20 and 40 min, as compared to WR, the administration of HWPH resulted in a significantly higher amount of A-N in the blood (p<0.001). HWPH, a HWPH produced by Alcalase-Prozyme, is composed of smaller peptides than WP and is easily digested and absorbed; therefore, the amount of A-N in the blood may have been high at the beginning of oral administration.
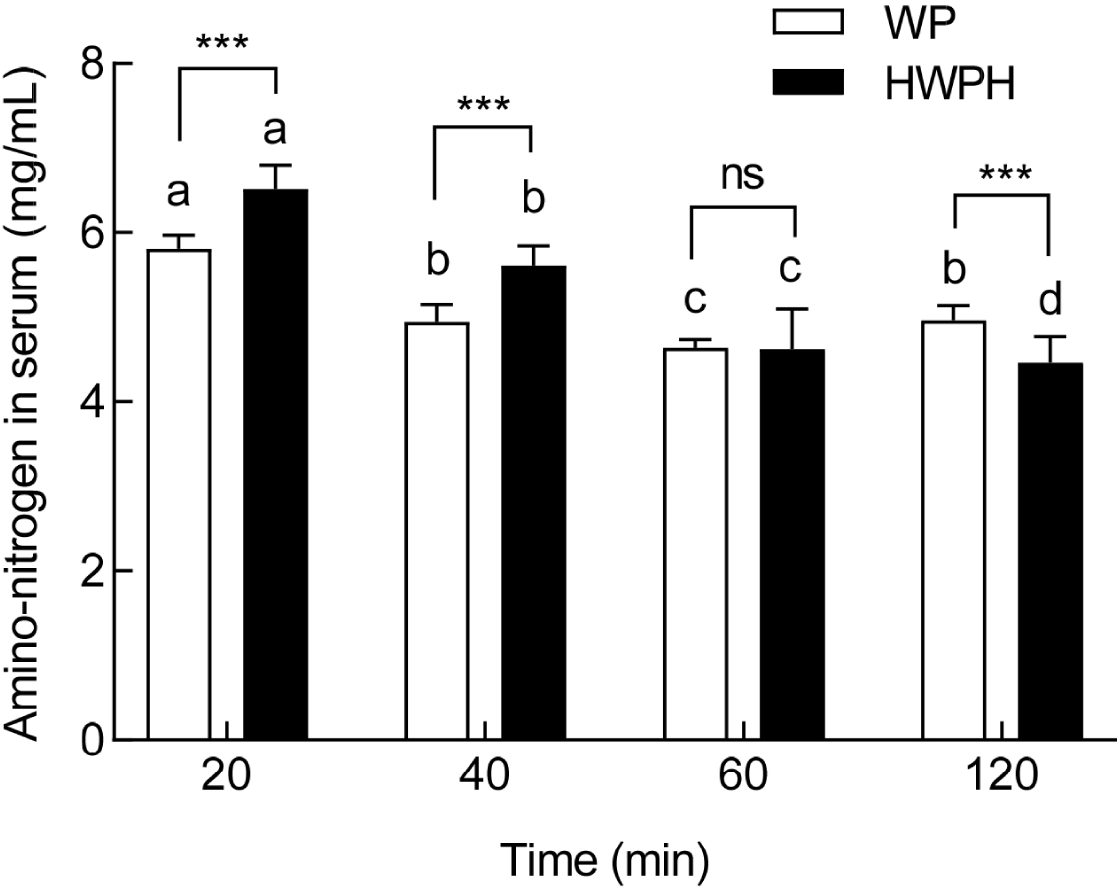
Pancreatin contains endopeptidases (trypsin and chymotrypsin) and exopeptidases (carboxypeptidase; Andriamihaja et al., 2013), which can hydrolyze WPs into smaller peptides than pepsin. Since β-LG is resistant to digestive enzymes (Villas-Boas et al., 2015), HWPH, in which β-LG is decomposed by Alcalase/Prozyme treatment, showed higher digestibility than WP. The measurement of the absorption rate through Caco-2 cells and animal experiments (Figs. 4 and 5) showed that the hydrolysate (HWPH) had better permeability than before hydrolysis (WP). Animal experiments showed a difference in the absorption rate within 40 min of oral administration.
The molecular weight distributions of the WP and HWPH were determined using a Superdex G-75 column (Fig. 6). WP was noted to contain several peptides with molecular weights of 18 and 5.8 kDa. In contrast, HWPH produced by Alcalase and Prozyme mainly consists of peptides of 5 kDa or less, and the main peaks were approximately 384 Da and 214 Da, respectively. WP was degraded into small peptides of 2.6, 1.3, and 0.491 kDa when treated with pepsin, and following pancreatin treatment, it was hydrolyzed into peptides with smaller molecular weights than when treated with pepsin (Figs. 6B and C). The molecular weight distribution of HWPH was similar after pepsin and pancreatin treatments. Since the HWPH had already been hydrolyzed by the enzyme (Figs. 6E and F), the effect of pepsin and pancreatin treatments on the molecular weight distribution seems to be minimal.
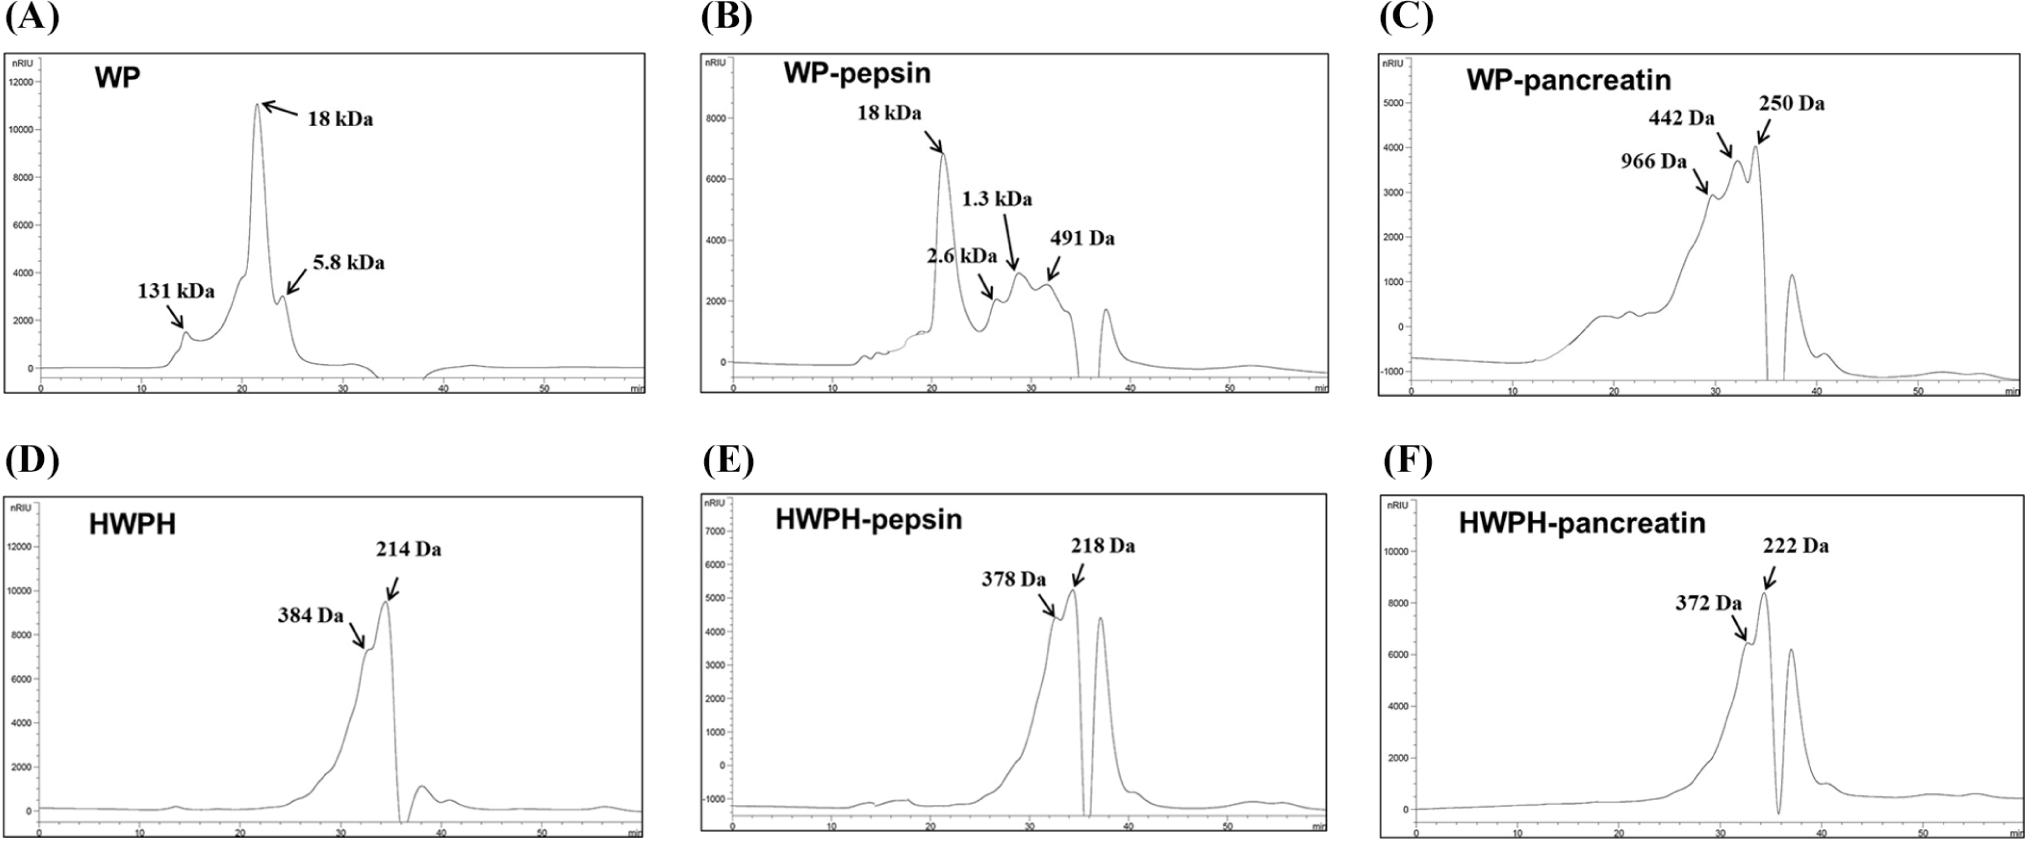
Allergens can also be identified by their molecular weights. Enzymatic hydrolysis of milk proteins can prevent allergic sensitization by minimizing the number of sensitizing protein epitopes through the decomposition of allergenic sites or reduction in protein size (<1,500 Da; Crittenden and Bennett, 2005; Fiocchi et al., 2003). WP is mainly composed of 1,800 and 5,800 Da peptides, but Alcalase/Prozyme hydrolysate (HWPH) was composed of short peptides of 384 and 214 Da (Fig. 6). Therefore, the peptides constituting HWPH are small in size, which increases the absorption and bioavailability, but will be limited in antibody production due to their size.
The content and ratio of cytokines (INF-γ and IL-4) and antibodies (IgG2a and IgG1) corresponding to Type 1 helper T (Th1) and Type 2 helper T (Th2) effector cells in the blood, spleen cells, and small intestine are closely related to the immune response caused by allergens. INF-γ and IL-4 in the blood of mice administered with WP and HWPH tended to marginally increase as compared to mice in the control group, but this difference was not significant (Table 2). Although not statistically significant, the ratio of Th1/Th2 (INF-γ/IL-4) also showed an increase with HWPH treatment. The ratio of IgG2a/IgG1 between WP and HWPH was significantly increased by the oral administration of 250 and 500 mg/kg HWPH.
*** p<0.001 indicate significant difference from the control group (CON) based on Tukey’s multiple test.
CD4+ helper T (Th) cells play a central role in the immune response and secrete various cytokines that affect the function of B cells and the immune system. Depending on the secreted cytokines, they are divided into Th1 and Th2 effector cells (Herzyk et al., 2001; Lavigne et al., 1998) which exhibit characteristic cytokine profiles (MacLeod et al., 2008). Cytokines (IFN-γ) and antibodies (IgG2a) secreted from Th1 cells have an antagonistic action with cytokines (IL-4) and antibodies (IgG1) secreted from Th2 cells.
The ratio of INF-γ/IL-4 in the splenocytes decreased significantly in the group administered with 500 mg/kg of WP compared to that in the control group (p<0.01). The ratio of IgG2a/IgG1 (Th1:Th2) was similar or higher in the HWPH-administered groups than in the control group, whereas the WP orally administered group showed a lower ratio, but the difference was not significant. There was a significant difference in the IgG2a/IgG1 ratios between the HWPH and WP groups.
Cytokines and antibodies specific to Th1 and Th2 cells in the small intestine of mice orally administered WP and HWPH were analyzed (Table 2). The IL-4 content in the groups orally administered with WP and HWPH was significantly higher than that in the control group (p<0.05). The ratio of INF-γ/IL-4, corresponding to the Th1/Th2 ratio, tended to increase as the dose of HWPH increased, and the 500 mg/kg oral administration group showed a significantly higher level than the control group (p<0.05). IgG2a levels in the small intestine in the two groups were significantly higher than in the control group. The ratio of IgG2a/IgG1 and the ratio of Th1 to Th2 cells were significantly higher in the HWPH-administered group than in the control group (p<0.001). There was a significant difference in the IgG2a/IgG1 ratio between the WP and HWPH groups in terms of the dose (p<0.001).
Abnormalities in the maintenance of Th1 and Th2 cell homeostasis are known to lead to various immunopathological abnormalities. When Th2 is relatively dominant, it promotes decreased defense against microbial infections, such as bacteria and viruses, allergic development, and some autoimmune diseases (Prigent et al., 1995; Umetsu and DeKruyff, 1997), and excessive immune responses (cell-mediated immunity) of Th1 cells are associated with auto-immune diseases (Gans et al., 2003; Margalit et al., 2005). As depicted in Table 2, the ratio of IFN-γ/IL-4 was higher for HWPH than for WP, indicating that the allergic reaction induced by Th2 was somewhat suppressed. This is due to the fact that IgG2a isotype switching is induced by IFN-γ, and isotype switching of IgG1 or IgE is induced by IL-4, which inhibits the function or production of IFN-γ (Kühn et al., 1991; Snapper and Paul, 1987). The IgG2a/IgG1 ratio was higher in the HWPH than in the WP, suggesting that the Th1 response was relatively stimulated rather than the Th2 response, and thus, antibody conversion was induced, leading to a significant suppression of the allergic reaction (Table 2).
Oral administration of HWPH increased the levels of Th1 cytokines and antibodies in the blood, spleen, and small intestine, whereas the levels of Th2 cytokines and antibodies were lower than those in the WP group. In addition, the IgE content in the blood, splenocytes, and small intestine was significantly different between the two groups (Fig. 7). HWPH, in which a α-LA and β-LG had been decomposed, had a lower level of allergen-related intracellular immune response than WP, and thus presumed to have a lower allergenic potential due to the hydrolysis of the allergen-inducing substances. The allergic response to WP is representative of type I immune hypersensitivity involving IgE (Martorell-Aragonés et al., 2015). Oral administration of HWPH resulted in a significantly lower IgE production than that of WP (Fig. 7). HWPH, a hydrolysate produced by Alcalase and Prozyme, seems to reduce allergic reactions as it hydrolyzes LG and LA, the two allergens in WP.

Conclusion
The mixing ratio of Alcalase and Prozyme, and the enzyme treatment conditions for HWPH production were optimized using RSM. The mixed treatment of Alcalase and Prozyme effectively degraded α-LA and β-LG, the major allergens of WP. Because HWPH is converted into small peptides by enzyme treatment and has a low molecular weight, its digestibility and intestinal permeability are higher than those of WP. In addition, it was confirmed that HWPH suppressed the allergic immune response by stimulating the Th1 response, but not the Th2 response, and by inducing antibody conversion. Thus, HWPH can be expected to be useful in a variety of products with low allergenicity targeting infants, adults, and the elderly.


