Introduction
Whey is an opaque, yellowish green liquid which is produced as a by-product in the production of cheese from milk. In 2013, worldwide whey production was estimated to be about 180–190×106 tons/year. In addition, as cheese production increases, whey production also tends to increase (Yadav et al., 2015).
Bioactive peptides which is taken from food proteins have health promoting effects such as antioxidant, antihypertensive, immunomodulation, and anticancer effects (Mohan et al., 2016). Among these proteins, milk proteins are considered to be one of the most important origin of bioactive peptides, and currently more than 200 bioactive peptides sequences have been identified from casein and whey proteins (Korhonen and Marnila, 2013). Bioactive peptides, or the hydrolysates of functional components in milk, are produced as a result of natural milk protein digestion, or by artificial hydrolysis of milk proteins through the addition of proteolytic enzymes in food processing, or by proteolytic enzymes during dairy fermentation (Imm, 2007). Among these, the most studied bioactive peptides are opioid peptides, calcium absorption-promoting peptides, hypotensive peptides, immune enhancing peptides, growth factors, and platelet aggregation inhibiting peptides, among others (Yoo et al., 2013).
Allergic diseases are increasing because of modern environmental pollution, dietary changes, and genetic influences, and particularly in Korea, the number of patients with an allergic disease has increased compared to the past (Lee et al., 2009). Among these allergies, food allergies, which arise because of a hypersensitive reaction to specific food antigens, arisen from an immune reaction after ingesting foods (Lee et al., 2013). The main causes of food allergies include milk, eggs, soy, buckwheat, and wheat (Lim et al., 2015). An allergic reaction to milk, which is a very common food allergy, is caused by various immunological mechanisms because of specific protein components present in milk (Kim and Lee, 1999). Milk allergies are the most typical allergic disease in infants and children, with a 2%–3% incidence (Skripak et al., 2007; Wood et al., 2013). Milk is the first non-human ingested protein that most non-breast fed infants are exposed to. Because of the large amount of milk ingested by infants, the incidence of milk allergies is high in children under two years of age (Shin et al., 2004; Lim et al., 2015). Milk protein is composed of about 80% casein and 20% whey protein. The whey proteins include β-lactoglobulin (β-LG), α-lactalbumin (α-LA), immunoglobulin, and bovine serum albumin (BSA). Among these, some proteins, for example casein, β-LG, and α-LA, as well as others, are known to be major allergens in the development of milk allergies. It has been reported that most milk allergic patients have specific IgE antibodies against at least two or more antigens, and that the antigenicity of whey protein is much stronger than that of casein (Lee et al., 2014). β-LG is an exogenous protein, which is not found in human milk, and is only found in milk from ruminants. It accounts for approximately 7%–12% of milk protein, so that its content is lower than that of casein. However, it has strong antigenicity and a resistance to gastric acid, and induces milk allergy following its permeation into the intestine (Kim et al., 2012).
The aim of this study was to compare and analyze allergic parameters between whey protein and its hydrolysates produced by the proteolytic enzymes trypsin and α-chymotrypsin in order to assess the optimal whey digestion conditions.
Materials and Methods
Whey protein concentrate (WPC 80) was purchased from Sachsenmilch GmbH (Leppersdorf, Germany), and trypsin and α-chymotrypsin were purchased from Sigma Co. (St. Louis, MO, USA).
WPC 80 was dissolved in distilled water (DW) to prepare a 5% (w/v) substrate solution (pH 8.0). Trypsin and α-chymotrypsin were added at 1:100 (w/w) to provide a ratio for each enzyme:substrate of 1:1 (trypsin: α-chymotrypsin, 1:1), and reacted at 37°C for 8 h. In order to measure the hydrolytic rate, samples were collected at 0 (initial), 10, 20, 30, and 60 min after the addition of the enzyme and were collected at 1 h-intervals. The hydrolysates were heat-treated at 95°C for 10 min to terminate the enzymatic reaction, and then cooled at 25°C. Following this, the hydrolysate was lyophilized (FD-1000, Tokyo Rikaikikai Co. Ltd., Tokyo, Japan) and stored at –20°C until analysis.
The degree of hydrolysis of the WPC hydrolysates was measured using the method of Lowry et al. (1951). One milliliter of 20% trichloroacetic acid (TCA) was added to 1 mL of the collected and inactivated enzyme hydrolysate. After centrifugation at 2,370×g for 5 min, the protein content of the supernatant was analyzed by the method of Lowry et al. (1951). The degree of hydrolysis was calculated using the following equation.
To confirm hydrolysis of WPC, SDS-PAGE was performed using a Mini-Protein Tetra Cell (Bio Rad, Hercules, CA., USA). A 17% separating gel and a 4% stacking gel were used to separate proteins. Samples were mixed with 2×sample buffer (10% (w/v) SDS, 25% (v/v) glycerol, 5% (v/v) β-mercaptoethanol, 0.5% (w/v) bromophenol blue, 0.5 M Tri-HCl, pH 6.8), and then heat-treated at 95°C for 5 min. The protein loading amounts were 40 μg/20 μL, 80 μg/20 μL, and 120 μg/20 μL. A PageRuler Prestained Protein Ladder (Thermo Fisher Scientific Co. Ltd., Waltham, MS., USA) was used for a molecular weight marker. The gels were electrophoresed at 60 V and 60 mA and then stained with Instant Blue Protein Stain (Expedeon, San Diego, CA, USA) and decolorized to identify the bands.
RBL-2H3 cells, a rat basophilic leukemia cell, were purchased from the American Type Culture Collection (Manassas, VA, USA). RBL-2H3 cells were cultured in Dulbecco’s modified Eagle’s medium (DMEM, Hyclone, Logan, UT, USA) supplemented with 10% fetal bovine serum (FBS, Hyclone, Logan, UT, USA) and 1% penicillin (Sigma-Aldrich) at 37°C under 5% CO2 in an incubator (HERAcell 150, Thermo Electron Corp., Waltham, MA, USA).
Cell viability was assessed using the MTT [3-(4,5-dimethylthiazole-2yl)-2,5-diphenyl-tetrazolium bromide] reduction method. RBL-2H3 cells were seeded at a density of 1×10⁵ cells/mL in a 96-well plate using DMEM supplemented with 10% FBS and 1% penicillin. After incubation for 24 h in a CO2 incubator, the medium was removed. Following this, 10 μM quercetin, WPC, and the WPC hydrolysate (500, 1,000 μg/mL) were added to the DMEM medium, without FBS and penicillin, and cultured in a CO2 incubator for 24 h. Subsequently, 20 μL of MTT solution (5 mg/mL) and 180 μL phosphate buffered saline (PBS) were added and the cells were incubated at 37°C for 4 h. The supernatant was eliminated and added 200 μL dimethyl sulfoxide (DMSO) to the mixture and placed for 30 min in a dark room. After the reaction, the absorbance was assessed at 550 nm using a microplate reader (Epoch, BioTek, Winooski, VT, USA). Cell viability (%) was calculated using the following equation.
To assess the anti-allergic properties of the WPC and WPC hydrolysates, the secretion of β-hexosaminidase, which is often used as a degranulation index, was analyzed. RBL-2H3 cells (2×10⁵ cells/mL) were seeded in 24-well plates using DMEM medium supplemented with 10% FBS and 1% penicillin, and then incubated with 0.5 μg/mL of a monoclonal anti-dinitrophenyl antibody (mouse IgE isotype, DNP-IgE, Sigma-Aldrich) and incubated at 37°C in a 5% CO2 incubator for 18 h. The sensitized cells were rinsed with 500 μL of HEPES-buffered Tyrode's solution (10 mM HEPES, 135 mM NaCl, 12 mM NaHCO3, 2.8 mM KCl, 2 mM CaCl2, 1 mM MgCl2, 0.4 mM NaH2PO4, 0.25% BSA, Bio Products Inc., West Palm Beach, FL, USA), after which 160 μL of HEPES-buffered Tyrode's solution was added, followed by incubation at 37°C in a 5% CO2 incubator for 10 min. WPC, WPC hydrolysate (500, 1,000 μg/mL), and quercetin (10 μM) were added to the cells and incubated at 37°C in a 5% CO2 incubator for 1 h. Cells were then incubated with 10 μg/mL DNP-BSA (Santa Cruz Biotechnology Inc., Dallas, TX, USA) for 1 h at 37°C in a 5% CO2 incubator and incubated for 10 min in ice bath to terminate the reaction. After the reaction, the cells were centrifuged at 500×g at 4°C for 10 min, and 25 μL of the supernatant was transferred to a 96-well plate. After substrate buffer (1 mM 4-nitrophenyl-N-acetyl-β-D-glucosaminide in 0.05 M citrate buffer, pH 4.5) was mixed with the supernatant and the mixture was incubated at 37°C in a 5% CO2 incubator for 1 h. After the reaction was completed, 200 μL of 0.1 M Na2CO3/NaHCO3 was added to terminate the reaction, and the absorbance was measured at 405 nm. The degree of inhibition of β-hexosaminidase was calculated using the follow equation.
After seeding RBL-2H3 cells in a 24-well plate, the cells were sensitized with 0.5 µg/mL of DNP-IgE and incubated at 37°C, in a 5% CO2 incubator for 18 h. The sensitized cells were washed with 500 µL of HEPES-Buffered Tyrode’s solution (10 mM HEPES, 135 mM NaCl, 12 mM NaHCO3, 2.8 mM KCl, 2 mM CaCl2, 1 mM MgCl2, 0.4 mM NaH2PO4, 0.25% BSA, 5.5 mM glucose, pH 7.4). Following this, the washed cells were mixed with 160 µL of HEPES-Buffered Tyrode’s solution and incubated at 37°C, in a 5% CO2 incubator with WPC, WPC hydrolysates, and 10 µM quercetin for 1 h. The cells were then incubated with 10 µg/mL DNP-BSA at 37°C, in a 5% CO2 incubator for 1 h, and the reaction was terminated using an ice bath for 10 min. Finally, the supernatant was separated by centrifugation at 500×g for 10 min. A TNF-α kit (R&D Systems Inc., Minneapolis, MN, USA) was used to measure cytokine secretion using the manufacturer's recommendations.
The seeded RBL-2H3 cells (2×10⁵ cells/mL) in 24-well plates were sensitized with 0.5 µg/mL DNP-IgE and incubated at 37°C, in a 5% CO2 incubator for 18 h. The sensitized cells were washed with 500 µL of HEPES-buffered Tyrode’s solution, and mixed with 160 µL of HEPES-buffered Tyrode’s solution and incubated at 37°C, in a 5% CO2 incubator for 10 min. WPC, WPC hydrolysates (500, 1,000 μg/mL), and quercetin (10 μM) were added to the rinsed cells and incubated at 37°C, in a 5% CO2 incubator for 1 h. After the incubation of cells with 10 µg/mL DNP-BSA, the reaction was terminated in an ice bath for 10 min, and centrifuged at 500×g for 10 min to separate the sediment. The sediment was mixed with trypsin and centrifuged at 10,000 rpm for 5 min harvest the cells. RNA was extracted by an RNeasy Mini Kit (Qiagen, Germany). To eliminate genomic DNA, the extracted total RNA was mixed with 4×DNA Master Mix (Toyobo, Osaka, Japan), RNA template, and nuclease-free water and incubated at 37°C for 5 min. After the incubation, the cDNA was synthesized by the addition of a 5× RT Master Mix II. Finally, the synthesized cDNA was stored at –20°C until analysis.
To investigate the effects of WPC and WPC hydrolysates on cytokine gene expression, the mRNA expression levels of IL-1β, IL-4, and IL-13 were analyzed using real-time PCR. To perform real-time PCR, the extracted cRNA was mixed with a Rotor-Gene SYBR Green PCR Master Mix (Qiagen, Germany), and -F and –R primers (10 pmol/µL) for each cytokine gene of interest, and nuclease-free water. The primer gene sequences of the three cytokines analyzed are presented in Table 1. A Rotor-Gene Q 2plx (Qiagen, Germany) was used for real-time-PCR analysis, with the conditions for the IL-1β reaction being as follows; 40 cycles of pre-denaturation at 95°C for 5 min, denaturation at 95°C for 5 min, annealing at 56°C for 30 sec, and polymerization at 72°C for 60 sec, and 34 cycles of pre-denaturation of IL-4 and IL-13 at 95°C for 5 min, denaturation at 95°C for 30 sec, annealing at 63°C for 45 sec, and polymerization at 72°C for 45 sec. The amplified products were examined using the Delta Delta CT method, and each sample was calibrated to the expression level of the housekeeping gene glyceraldehyde-3-phosphate dehydrogenase (GAPDH). Each PCR product was electrophoresed on a 1% agarose gel containing Red Safe (Intron Biotechnology Inc., Sungnam, Korea) at 100 V for 20 min and photographs were taken under UV light using the UVD GelDoc-It documentation system (UVP, Upland, CA, USA).
An ANOVA analysis was conducted using SPSS 23 (SPSS Inc., Chicago, IL, USA). A post-hoc analysis for comparison between groups was performed using Tukey's b, and significance was achieved only when p<0.05. All analyses were repeated three times or more, and the results were expressed as mean±SD.
Results and Discussion
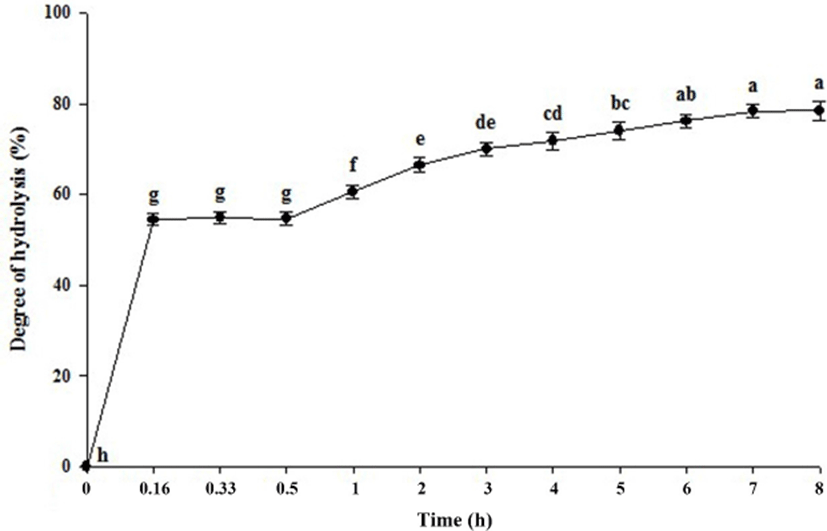
The time course of hydrolysis of whey protein is shown in Fig. 1. After the addition of trypsin and α-chymotrypsin, hydrolysis of the whey protein increased with the reaction time, and was particularly rapid over the initial 10 min of the reaction. At 7 h and 8 h, the degrees of hydrolysis were 78.37 and 78.50%, respectively, however, these showed no significant differences (p<0.05). Woo et al. (2009) reported that when whey protein is treated with α-chymosin at an enzyme:substrate ratio of 1:100, the hydrolytic rate rapidly increased over the first 10 min, and thereafter slowed down up to 8 h, with the degree of hydrolysis being 80% or more. Therefore, the optimum hydrolysis time was determined to be 7 h, since there were no significant changes in the degree of hydrolysis degree after 7 h (p<0.05). The resulting hydrolysate was used for further experimentation.
The protein profiles of the whey protein before and after hydrolysis with trypsin and α-chymotrypsin were determined by SDS-PAGE, and the data are shown in Fig. 2. The most prominent band in the WPC was β-LG at 15 kDa, followed by α-LA at 14 kDa, and BSA at 69 kDa. In the case of its hydrolysate, the intensity of these protein bands was significantly reduced, particularly the β-LG and α-LA bands. In addition, the whey protein hydrolysate contained proteins of molecular weight 14 kDa or less, indicating the presence of low molecular weight-peptides produced as a result of hydrolyzing the whey proteins.
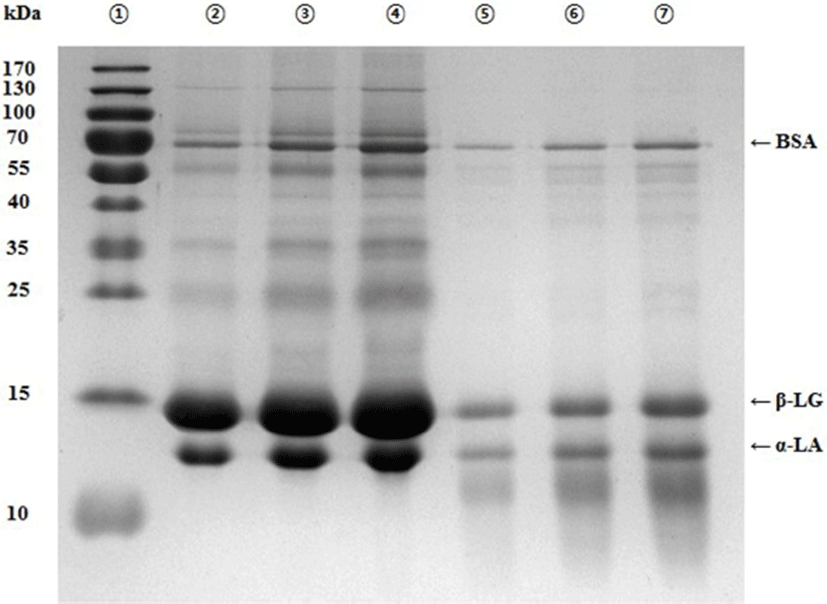
Whey is known to contain proteins, for instance β-LG, α-LA, BSA, lactoferrin, and lactoperoxidase. β-LG accounts for approximately 50% of total whey protein, and has a molecular weight of 18.4 coda (Tavares and Malcata, 2013). α-LA accounts for about 20% of total whey protein, and its molecular weight is approximately 14 kDa (Yadav et al., 2015). BSA accounts for approximately 5%–6% of total whey protein, and has a molecular weight of 69 kDa, whereas lactoferrin accounts for 1.9%–3.3% of total whey protein, and the molecular weight of it is approximately 76.5 kDa (Tavares and Malcata, 2013; Yadav et al., 2015).
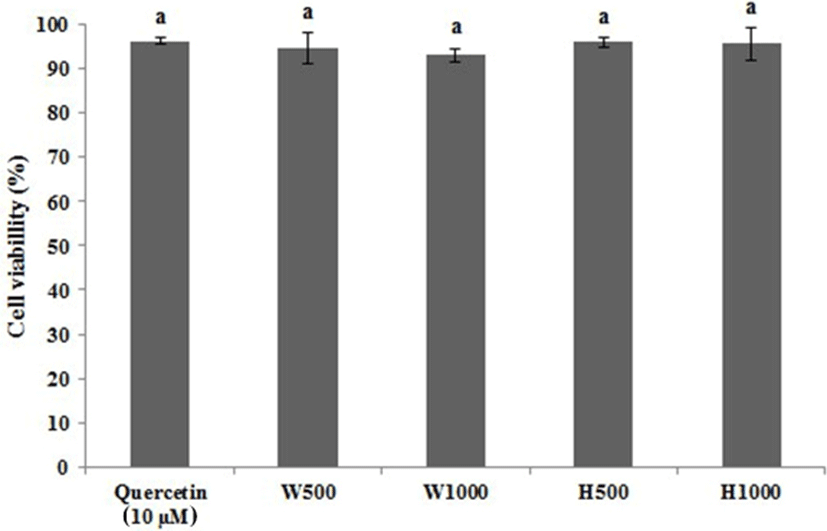
Fig. 3 shows the results of an MTT assay to determine the cell viability of RBL-2H3 cell line treated with WPC or its hydrolysate. The cell viability of the RBL-2H3 cells was analyzed using a positive control of 10 μM quercetin, WPC at 500 μg/mL and 1,000 μg/mL and WPC hydrolysate at 500 μg/mL and 1,000 μg/mL giving cell viabilities of 96.25%, 94.62%, 93.09%, 96.11%, and 95.69%, respectively. Therefore, a quercetin concentration of 10 μM, and 500 μg/mL and 1,000 μg/mL WPC and WPC hydrolysate were used, respectively.
RBL-2H3 cells express mucosal mast cells and express a high-affinity IgE receptor. When IgE is bound to the FcεRI, cell activation leads to the degranulation seen in allergic reactions, as well as the release of β-hexosaminidase and inflammatory cytokines (Vo et al., 2012; Park et al., 2012). Thus, this cell line has been extensively used to investigate the molecular basis of mast cell activation, such as IgE binding to FcεRI receptors and degranulation (Vo et al., 2012; Chung et al., 2011).
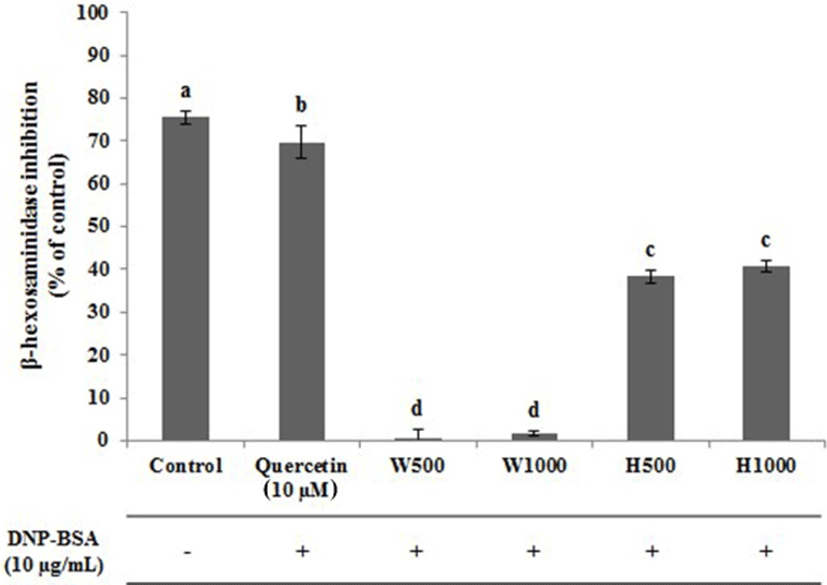
The effect of WPC, or its hydrolysate, on β-hexosaminidase release from IgE-activated RBL-2H3 cells was examined, and the data is indicated in Fig. 4. In the control without DNP-BSA treatment, the inhibition of β-hexosaminidase was the highest being 75.44%, followed by the positive control, quercetin (10 μM) which was 69.72%. Lee et al. (1999) have also reported similar degrees of inhibition being approximately 75% with 10 μM quercetin, similar to the result of this present study. The whey protein hydrolysates H500 and H1000 showed inhibition of 38.31% and 40.66%, respectively, and there was no significant difference between these two samples (p<0.05). The degrees of inhibition of β-hexosaminidase for the whey protein preparations were 0.70% for W500 and 1.66% for W1000, which were significantly different from H500 and H1000. Kim (2010) analyzed the degree of inhibition of β-hexosaminidase in DNP-IgE-stimulated RBL-2H3 cells treated with a Glycyrrhiza uralensis extract and found approximately 40% inhibition at 1,000 μg/mL with Glycyrrhiza uralensis extracts. In addition, Chung et al. (2011) observed about 43% inhibition of β-hexosaminidase in RBL-2H3 cells sensitized with DNP-IgE treated with anthocyanin isolated from black soybean skin. These data confirm that whey protein hydrolysate inhibits the secretion of β-hexosaminidase.
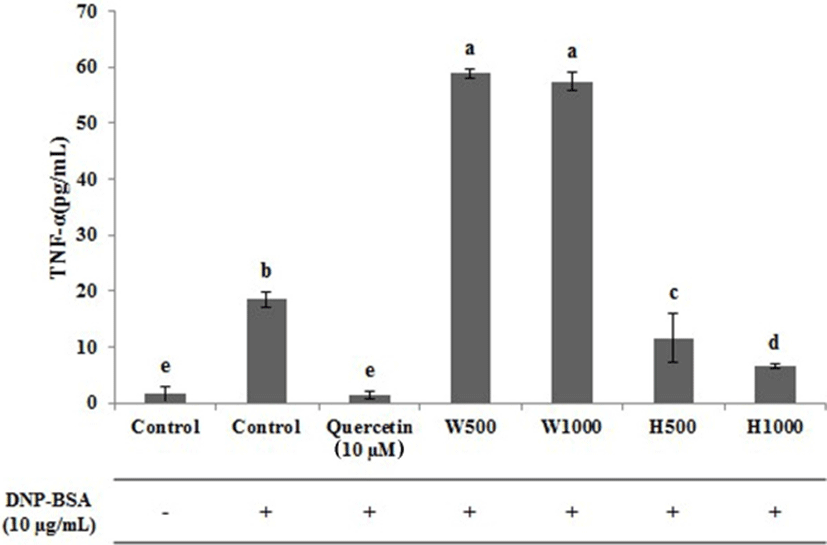
The effect of whey protein and whey protein hydrolysate on the release of TNF-α, an inflammatory cytokine, from RBL-2H3 cells, is presented in Fig. 5. In the untreated control, a very low amount of TNF-α was released (1.60 pg/mL), whereas the control treated with antigen released 18.48 pg/mL of TNF-α. The TNF-α released from RBL-2H3 cells treated with whey proteins W500 and W1000 were 58.90 and 57.44 pg/mL, respectively, and it seems that the allergic reaction had proceeded only in the TNF-α results. However, the levels of TNF-α released from RBL-2H3 cells treated with the whey protein hydrolysates H500 and H1000 were 11.60 and 6.60 pg/mL, respectively, and the amount of TNF-α significantly decreased with increasing hydrolysate concentrations (p<0.05). The absolute levels of TNF-α released from RBL-2H3 cells treated with H500 were 47.30 pg/mL lower than the level of TNF-α from W500 treated cells, and 50.83 pg/mL lower in the H1000 treated cells compared to the W1000 treated cells. The TNF-α levels in the H500 and H1000 treated cells were significantly reduced approximately 6.88 pg/mL and 11.88 pg/mL, respectively, when compared with the antigen treated control (p<0.05). Generally, TNF-α is released along with histamine, β-hexosaminidase, and IL-3, IL-4, and IL-13 following activation of mast cells and is an important biomarker in the search for compounds with anti-allergic therapeutic effects (Matsubara et al., 2004; Kim et al., 2016).
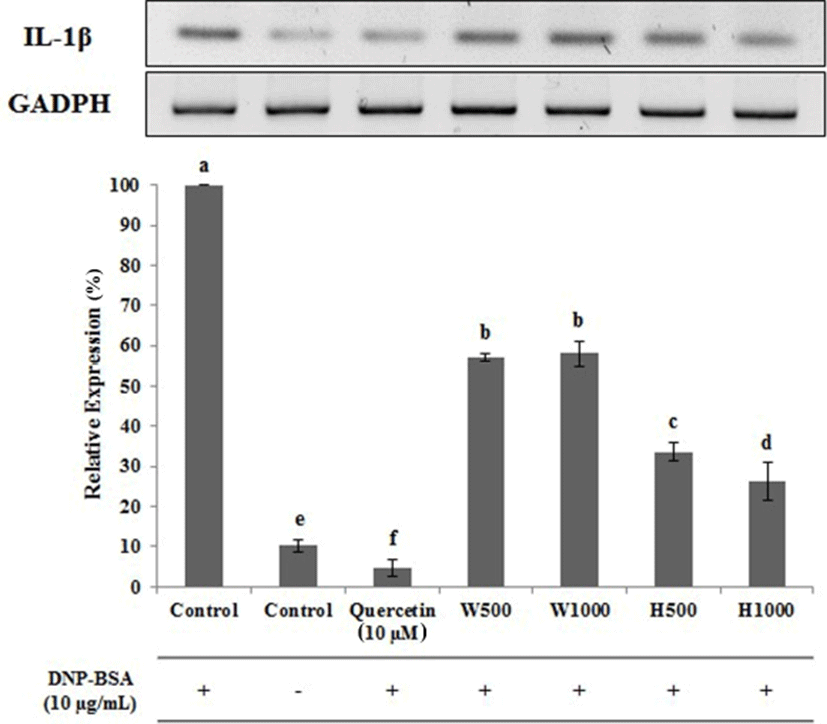
To investigate the effect of whey proteins and whey protein hydrolysates on allergic responses, the gene expression patterns of IL-1β, IL-4, and IL-13 in DNP-BSA-treated RBL-2H3 cells were investigated, and are shown in Figs. 6–8. DNP-BSA-treatment significantly increased the expression of IL-β (Fig. 6), and this secretion level was set to be 100% as the control. Untreated RBL-2H3 cells had significantly lower levels of IL-β expression being decreased over 89.6% compared to the DNP-BSA treated control. Treatment with 10 µM quercetin as a positive control inhibitor decreased the IL-β expression levels approximately 95.33% compared to the DNP-BSA-treated cells. In RBL-2H3 cells treated with H500 or H1000, the IL-β levels were reduced to 33.67% and 26.33% of the DNP-BSA-treated control, respectively. Furthermore this decrease in IL-β gene expression was dose-dependent and was significantly different between the two doses of the whey protein hydrolysate (p<0.05). In contrast, the IL-β levels in the W500 and W1000 treated cells were 57 and 58% of control, respectively, and although the IL-β expression level also increased with increasing concentration of whey protein, no significant differences were observed (p<0.05).
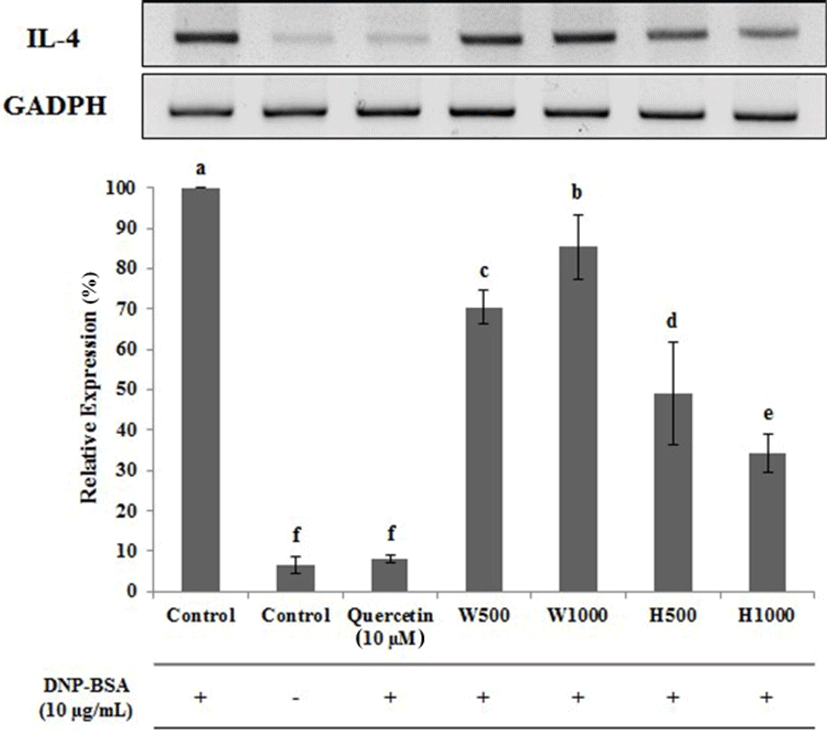
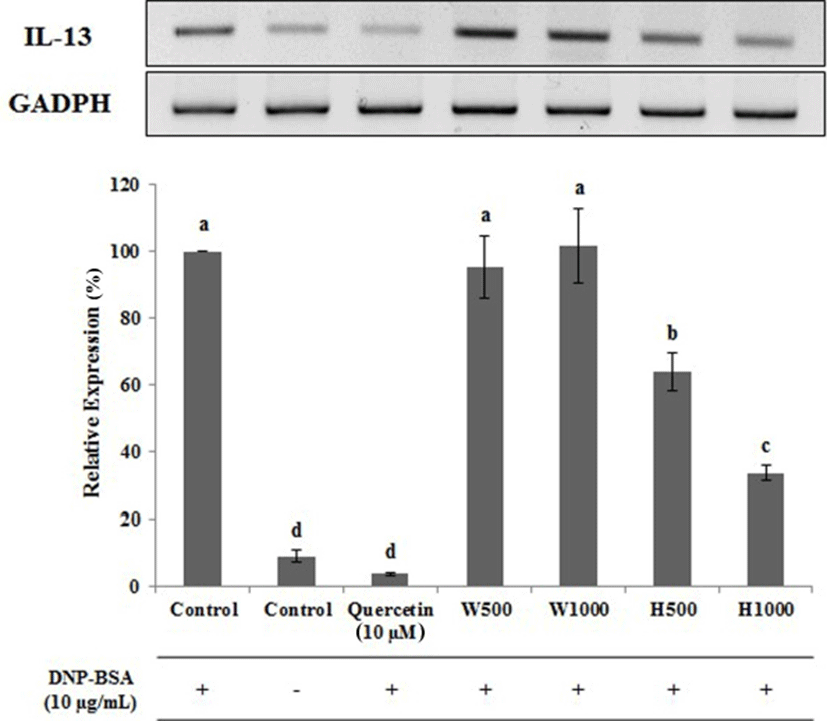
Similar data were observed for IL-4 (Fig. 7). The IL-4 expression level was lowest for the untreated cells, and following treatment with the positive control inhibitor quercetin, being 6.67 and 8.00% of the control DNP-BSA treated cells, respectively. Cells treated with W500 and W1000 had IL-4 levels that were 70.33 and 85.33% of control, respectively. The expression of IL-4 increased in a significant (p<0.05) and dose dependent manner. In contrast, cells treated with H500 and H1000 had IL-4 levels that were 49.13 and 34.30% of control, respectively, representing a 21.20 and 51.03% absolute reduction, respectively, when compared with the same whey protein concentration. The data for IL-13 gene expression (Fig. 8), were very similar to those found for IL-4. W1000 had an Il-13 expression level that was 101.67% compared to DNA-BSA-treated control, but this was not significantly different (p<0.05). In comparison, as the concentration of whey protein hydrolysate increased, the expression level of IL-13 was significantly decreased (p<0.05). Therefore, from the gene expression analysis of the cytokines IL-1β, IL-4, and IL-13 using real-time PCR, the whey protein hydrolysates decreased the gene expression levels of IL-1β, IL-4, and IL-13.
Conclusion
This study was carried out to investigate the potential anti-allergic properties of a whey protein hydrolysate prepared using trypsin and α-chymotrypsin. The gene expression levels of β-hexosaminidase, TNF-α, and cytokines (IL-1β, IL-13) were analyzed to assess the potential anti-allergic effect. The degree of hydrolysis of the whey protein using trypsin and α-chymotrypsin was maximal at 8 h. This result was confirmed by SDS-PAGE where proteins with molecular masses of 14 kDa or less, were evident. Treatment of RBL-2H3 cells with the WPC, or its hydrolysate, revealed a high degree of cell viability (greater than 90% in all treatments). The whey protein hydrolysate had a greater degree of β-hexosaminidase inhibition compared to the WPC. In addition, the TNF-α secretion levels were significantly decreased as the concentration of the whey hydrolysate increased (p<0.05). An analysis of cytokine gene expression using real-time PCR revealed that the levels of IL-1β, IL-4, and IL-13 were lower following treatment of cells with the hydrolysate compared to the WPC, and this effect was dose dependent.
Therefore, these data confirm that the whey protein hydrolysate, prepared enzymatically, was more effective in improving the allergenic index than the WPC. This study provides the basic data necessary to improve the allergenic index of whey protein hydrolysates.


