Introduction
Cooked pig trotters, also called Jokbal, are a popular food in Korea. However, a survey by the Ministry of Food and Drug Safety found that 80.1% of cooked pig trotters were stored at room temperature, with 50.1% of respondents believing that there is a risk for foodborne illness associated with cooked pig trotters (MFDS, 2012). In fact, in June 2013, a foodborne illness was caused by pig trotters in a high school in Incheon, Korea, which was identified to be caused by enteroaggregative Escherichia coli (EAEC) (Shin et al., 2015). A report by the Korea Consumer Agency (KCA, 2017) showed that 1 in 6 cooked pig trotters were contaminated with E. coli. Thus, the infection of cooked pig trotters with E. coli needs to be evaluated to allow for implementation of appropriate measures of food hygiene control.
Most foodborne illnesses are caused by bacteria. According to the World Health Organization (WHO), E. coli is the leading cause of foodborne illness (Thangavel and Subramaniyam, 2019; WHO, 2018). E. coli are facultative anaerobic, gram-negative bacilli that are mainly isolated from human or animal feces (Djaja et al., 2018). Thus, animal-derived foods are likely to be contaminated with E. coli. Pathogenic E. coli are categorized into five major pathotypes: enteroinvasive E. coli (EIEC), enterohemorrhagic E. coli (EHEC), enteropathogenic E. coli (EPEC), enterotoxigenic E. coli (ETEC), and EAEC (Jang et al., 2017; Olsen et al., 2000). In addition, E. coli grows well at room temperature. As pig trotters are generally stored at room temperature, their consumption is likely to result in the spread of foodborne illness (Park et al., 2013; Park et al., 2014).
In 2018, the WHO recommended storing foods at safe temperatures as a way to prevent the transmission of E. coli. However, changes in temperature during the transport of food products, among other factors, hinders the characterization of the kinetic behavior of E. coli. A predictive model is needed to help characterize the kinetic behavior of E. coli using parameters, such as lag phase duration (LPD) and maximum specific growth rate (μmax), followed by the development of a dynamic model using kinetic parameters (Ha et al., 2019; Lee et al., 2019).
Therefore, we developed a dynamic model to predict the pathogenic E. coli cell counts in cooked pig trotters at a range of temperatures.
Materials and Methods
Pig trotter samples were cut aseptically into 25-g portions and transferred into filter bags. Single colonies of E. coli strains NCCP11142 (EHEC; isolation sources have not been identified and serotype is O157), NCCP14037 (ETEC; isolated from ascites and the serotype is O6), NCCP14038 (atypical EPEC negative for the bfpA gene; isolated from stool and the serotype is O15), NCCP14039 (EAEC; isolated from stool), and NCCP15661 (typical EPEC positive for the bfpA gene; isolation sources have not been identified) were each inoculated into 10 mL tryptic soy broth (TSB; Becton, Dickinson and Company, Franklin Lakes, NJ, USA), and incubated at 37°C for 24 h. Thereafter, 0.1 mL aliquots of the cultures were each inoculated into 10 mL fresh TSB, followed by incubation at 37°C for 24 h. The subcultures were harvested by centrifugation at 1,912×g and 4°C for 15 min. The resulting pellets were washed twice with phosphate-buffered saline (PBS) (KH2PO4 (0.2 g), Na2HPO4·7H2O (1.5 g), NaCl (8.0 g), and KCl (0.2 g) in distilled water (1 L) [pH 7.4]). The suspension of each strain was mixed and serially diluted using PBS to adjust the E. coli count to 5–6 Log CFU/mL for use as the inoculum.
The 0.1-mL of E. coli inoculum was inoculated onto the sample surface in filter bags. The samples were then rubbed vigorously to spread and attach the bacterial cells onto their surface. Pig trotter was usually stored at room temperature after cooking, and thus, it was stored at 10°C to 25°C. E. coli-inoculated samples were stored aerobically at 10°C, 20°C, and 25°C for up to 192 h, and analyzed at appropriate intervals during storage to determine the E. coli cell counts. The samples were homogenized with 50 mL 0.1% BPW using a pummeler for 1 min and the resulting homogenates were plated on Petrifilm™E. coli/Coliform Count plates. The plates were incubated at 37°C for 24 h, and the resulting colonies were then counted manually.
To calculate the kinetic parameters, such as LPD (h) and μmax (Log CFU/g/h), the E. coli cell counts determined for each storage temperature were fitted with Baranyi model using DMfit curve-fitting software (Institute of Food Research, Norwich, UK) for primary modeling (Baranyi and Roberts, 1994). To analyze the effect of temperature on LPD and μmax were fitted with a polynomial equation in SigmaPlot 10.0 (Systat Software, San Jose, CA, USA) for secondary modeling.
The performance of the developed models was validated with the root mean square error (RMSE), bias factor (Bf), and accuracy factor (Af). The RMSE, Bf, and Af were calculated by comparing the predicted and observed values obtained from different sets of experiments at 15°C and 23°C. The following equations were used:
where n represents the number of data points.
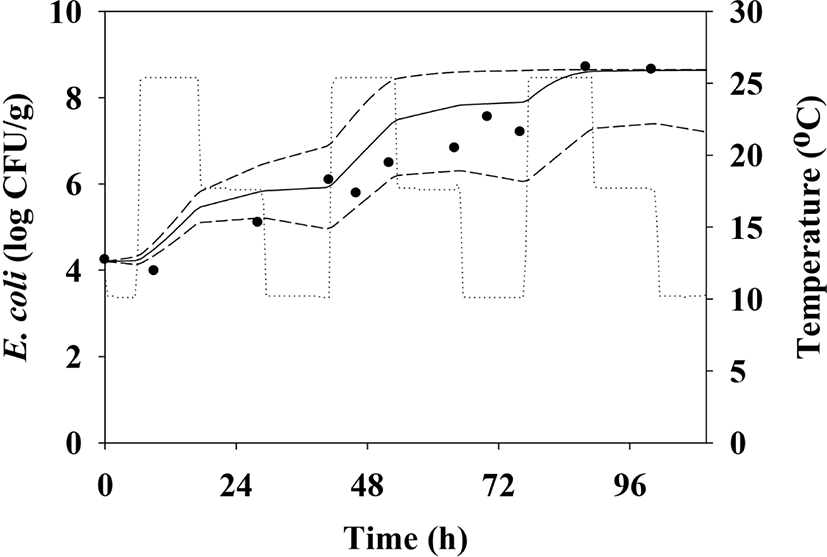
To elucidate the kinetic behavior of E. coli during the transportation and storage of pig trotters, a dynamic model was developed using the equation presented in a study by Baranyi and Roberts (1994). To compare the cell counts simulated by the dynamic model with recovered E. coli cell counts at the same temperature profile used for model simulation, the samples inoculated with E. coli inoculum were exposed to changing temperatures from 10°C to 25°C. During storage, the E. coli cell counts were determined as described previously.
Results and Discussion
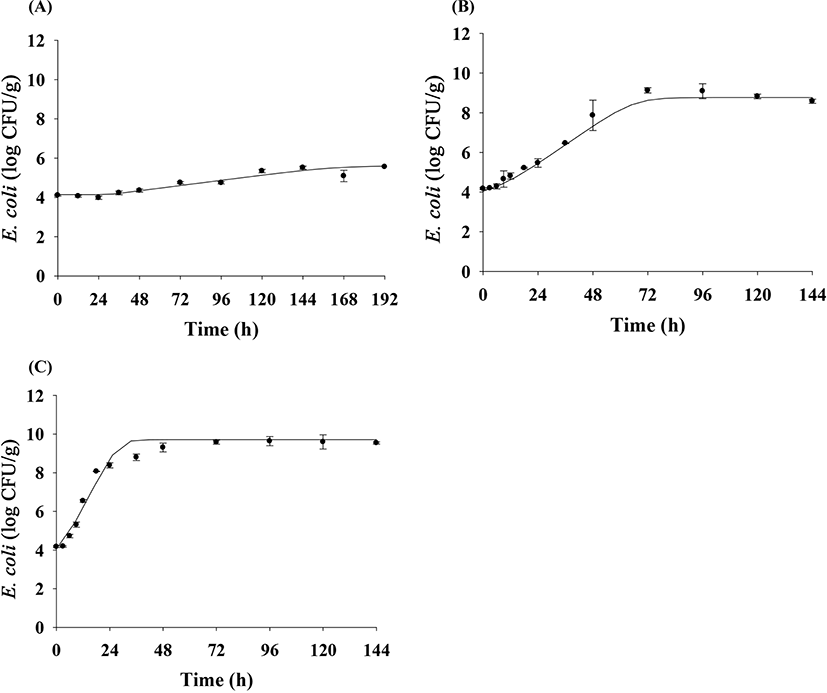
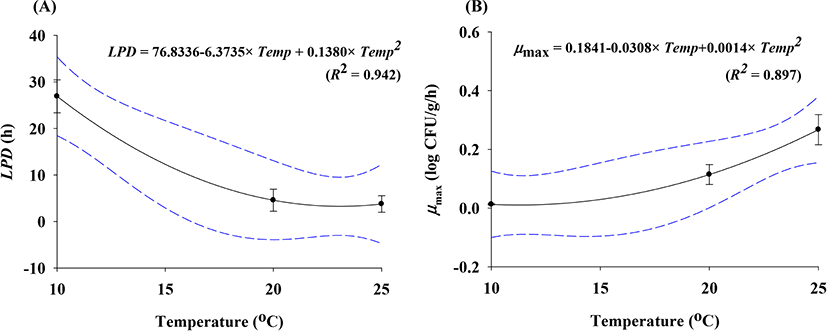
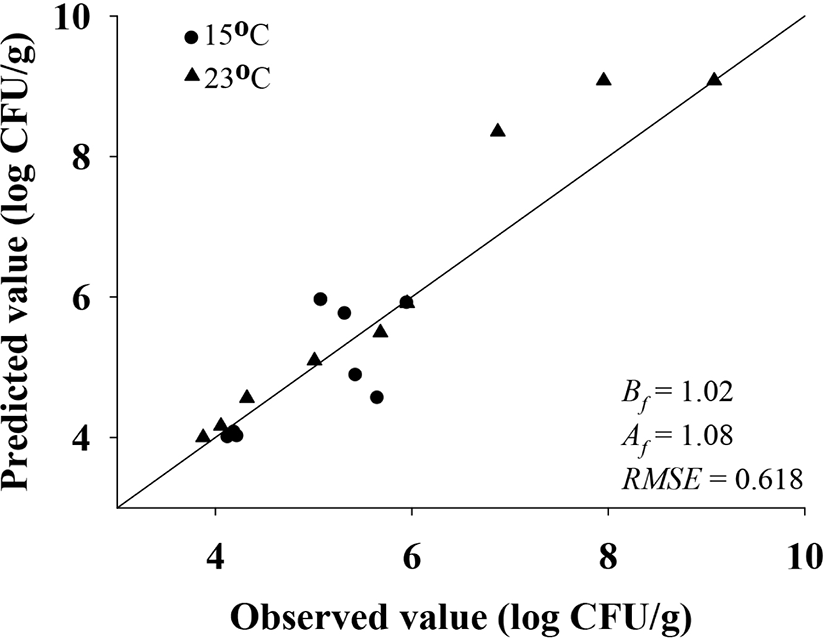
To predict E. coli cell counts in pig trotters, E. coli cell counts were fitted with the Baranyi model (Baranyi and Roberts, 1994). The primary model was able to appropriately describe the kinetic behavior, with an R2 of 0.894–0.973 (Table 1). The model showed that the E. coli cell counts in pig trotters increased during storage at 10°C, 20°C, and 25°C (Fig. 1). At 10°C, denoted as the threshold temperature of refrigeration (MFDS, 2020), E. coli populations were maintained at 4 Log CFU/g until approximately 24 h, but gradually increased as storage time increased (Fig. 1). In Korea, the maximum temperature for refrigeration is 10°C in the regulation (MFDS, 2020). As expected, the μmax values were higher (p<0.05) at high temperatures than at low temperatures (Table 1). The LPD values decreased (p<0.05) as the temperature increased, and the values were 26.90 h for 10°C, 4.58 h for 20°C, and 3.77 h for 25°C (Table 1). Even at 10°C, E. coli initiated growth after 26.90 h, as indicated by LPD, at 0.01 Log CFU/g every hour, as indicated by μmax (Table 1). This result can be used to predict E. coli growth in pig trotters. h0 is used to indicate the initial physiological state of E. coli in new environments (Baranyi and Roberts, 1994), and the values (0.34 and 0.44) were similar among the storage temperatures, especially at 10°C and 20°C (Table 1). This indicates that the physiological conditions of E. coli at 10°C were not different from those at 20°C. This indicates that despite being stored to 10°C for a long time, if the temperature is raised to 20°C, E. coli is able to grow as if exposed only to 20°C. To evaluate the effects of storage temperature on the kinetic parameters, secondary modeling was conducted. The LPD and μmax values were fitted to a polynomial model, with fitting completed at an R2 of 0.897–0.942 (Fig. 2). This means that the secondary model was appropriate for evaluating the effects of temperature on the kinetic parameters of E. coli in pig trotters. To validate the accuracy of the developed models, the models were validated with the results from the different sets of studies and conducted at 15°C and 23°C. The validation resulted in a Bf and Af of 1.02 and 1.08, respectively. According to Ross (1999), a model is considered to have a “good” performance when the Bf value is between 0.9 and 1.05, and the Af value is below 1.15. Also, RMSE was calculated as 0.618, indicating that the performance of the model developed in this study was determined to be good. The majority of the data points were found to regress to the line, as shown in Fig. 3, denoting the observed data that were the same as the predicted values. These results indicate that the primary and secondary models can be used to characterize the growth of E. coli in pig trotters (Fig. 3). However, because pig trotters are often stored at varying temperatures, we also developed a dynamic model using the equation suggested by Baranyi and Roberts (1994) with the results obtained by the primary and secondary models. When the dynamic model was used to simulate E. coli growth in pig trotters stored at temperatures ranging from 10°C to 25°C, the predicted data were also found to be close to the observed values. Our findings indicate that the dynamic model can be used to describe the fate of E. coli in pig trotters. Our simulated results showed that E. coli cell counts increased in pig trotters when temperatures varied between 10°C and 25°C (Fig. 4).
| Storage temperature (°C) | Lag phase duration (h) | μmax (Log CFU/g/h) | h0 | r2 |
|---|---|---|---|---|
| 10 | 26.90±5.01A | 0.01±0.00B | 0.34±0.00 | 0.894 |
| 20 | 4.58±3.35B | 0.11±0.05AB | 0.44±0.16 | 0.972 |
| 25 | 3.77±2.51B | 0.27±0.07A | 1.10±0.95 | 0.973 |


In summary, the models developed in this study provide an accurate description of the kinetic behavior of E. coli in pig trotters. E. coli was found to grow in pig trotters even at 10°C, after approximately 26 h, with an increase of 0.01 Log CFU/g every hour. In addition, the physiological state of E. coli at 10°C was not very different from that at other high temperatures. Thus, E. coli subjected to 10°C for long may grow at higher temperatures in a manner similar to when exposed to only the higher temperature. Thus, as such, the models can be used to predict of E. coli cell counts in pig trotters under changing temperature.


