


Introduction
Beef is a major source of essential amino acids needed in the human diet, and it attracts a premium price. Aside from being a source of protein, it is also a major source of other valuable nutrients such as vitamin, fat, and micronutrients, all of which are responsible for good human health. In recent years, meat quality has become a relevant topic for consumers concerning health and for meat industry stakeholders because it affects their profitability (Hocquette and Chatellier, 2011). Meat quality is usually defined by physical, chemical and biological attributes. With the current growing need for low production cost and high efficiency, the meat processing industry is facing several challenges, including maintenance of high-quality standards and assurance of food safety while avoiding liability issues. Meeting these challenges has become crucial in regards to grading beef for different markets. Traditionally, quality assessment of beef involves human visual inspection, in addition to chemical or biological determination experiments which are tedious, time-consuming, destructive and sometimes environmentally unfriendly. Meat processing companies and suppliers need accurate, fast, real-time, low-cost and non-chemical detection technologies to optimize quality assurance of meat to enable them to satisfy different market’s needs, thereby raising their competitiveness and expanding their market share. Imaging methods have been recently applied successfully to visually assess the quality or to classify meat or food products on the processing line based on color, shape, size, surface texture features (Chmiel et al., 2011; Girolami et al., 2013; Iqbal et al., 2010; Jackman et al., 2011). Computer vision (CV) is one such method. It is a nondestructive, fast, cost-efficient, consistent and objective method for the inspection and assessment of food quality and safety in the processing line (Gümüs et al., 2011). It is an RGB color vision method that has achieved good results in the assessment of the external features of foodstuffs (Tan, 2004). CV has such advantages as being online, non-invasive and thus nonhazardous (Chmiel et al., 2016). As a rapid and non-destructive technique, imaging technique has received huge attention in recent times for measuring quality attributes of agricultural products including meat and meat products. Part of the reasons why CV has gained popularity in times includes the fact that it can obtain reliable and reproducible results (Yagiz et al., 2009). It can potentially replace human vision and perception of images in meat quality assessment and safety assurance. Furthermore, machine vision is capable of providing reliable descriptive data with human intervention, which speed up the overall evaluation or measurement processes. Finally, it is proved to be objective, effective, reliable, non-destructive and capable of constant recording of food samples being examined and the effects of processing regimes which is suitable and important for further or subsequent analysis (Brosnan and Sun, 2004). The superiority of the imaging technique compared to traditional analysis methods is that they allow the display and overlay the distribution of the analyzed properties (Turgut et al., 2014). CV system has been used for color measurement in meat by Fatih et al. (2016). Researchers used CV technology for assessing water holding capacity in meat (ElMasry et al., 2011; Monroy et al., 2010; Qiao et al., 2007). Analysis of images obtained from a digital camera is presently being used for assessing the external qualities of meat. However, these assumptions may be possible because one previous research reported that frozen breast meat with low water-holding capacity had more flat in shape during extended storage time (Lee et al., 2008). Direct measurements are inconvenient and time-consuming when used in the continuous processing of meat. Thus, image analysis with a digital camera may provide an alternative method for evaluating or predicting the quality attributes by determining the conformation parameters and surface appearance such as color, texture, bitonality etc. A number of high-performance techniques have been applied successfully for determining or predicting the quality characteristics of various meat and meat products, such as the hyperspectral imaging technique (Iqbal et al., 2013; Qiao et al., 2007), near-infrared (NIR) imaging (ElMasry et al., 2011), and nuclear magnetic resonance (NMR) (Bertram et al., 2001) have been used. However, these techniques require costly equipment, whereas image analysis using a digital camera is less expensive. Although the machine vision has been originated during the dates back to the 1960s, it has not been introduced commercially in the food or processing industries until the 1990s. Machine vision has a distinct drawback such as its application during analysis of digital images, it is restricted to the identification and extraction of external image features or quality factors like color, size, and surface structure (Chmiel et al., 2011; Chmiel et al., 2012; Penman, 2001; Zhang et al., 2015). In consequence, it can not be used in chemometrics modeling in which chemical composition and internal quality characteristics of meat or samples under consideration (Peng and Dhakal, 2015).
Though the hypothesis of CV technology is related to conformation parameter of foodstuffs, an effort has been taken to find out the correlation between image value and chemical composition of beef through this experiment.
Materials and Methods
Beef samples were collected from 45 carcasses between the 12th and 13th ribs (longissimus dorsi muscle) of young zebu bulls. All samples were collected from different abattoir at Mymensingh town, Bangladesh. The indigenous bulls were around two and a half years of age with a live weight ranges from 250 to 300 kg. Each steak was 2.5 cm thick and weight was around 130 g. Samples were areal-packed and stored in the refrigerator for 24 h at 4°C as it takes at least 24 h to convert muscle into meat. After 24 h samples were removed from the refrigerator and then kept it in a tray for about 10–12 minutes to allow moisture to appear on beef surface. Then the surface of the samples were soaked gently with the help of blotting paper which subsequently used for better color value estimation.
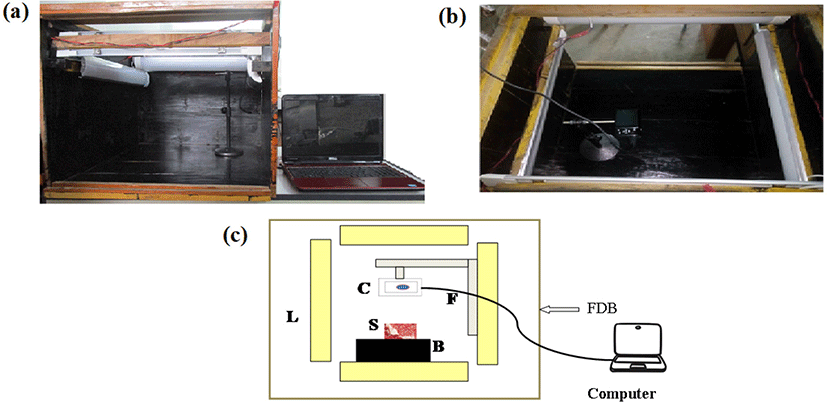
Image acquisition of the sample was performed with the help of imaging system (Computer Vision System, Fig. 1) developed locally following the information reported by Iqbal et al. (2010) and Valous et al. (2009). The main components of the developed system are: an illumination source, a color digital camera (Canon IXUS, Model No. 190, Tokyo, Japan), and a computer-supported with an image acquisition software package (Matlab 2015a, The Mathworks, Natick, MA, USA). Images of the samples were captured using the camera of imaging system and were stored in the computer for further processing. An image processing software (Matlab 2015a, The Mathworks, USA) was applied for image analysis.
The surface color of the samples were measured in terms of L* (lightness), a* (redness) and b* (yellowness) values using a Chroma meter (CR-400, Konica Minolta, Osaka, Japan) following the guidelines provided by Commission International de I’Eclairage (CIE) system (CIE, 1976).
The pH value in beef was measured by meat pH meter (Model no. HI99163, Hanna Instruments, Woonsocket, RI, USA). The pH meter was adjusted with pH 7.01 buffer solution before the measurement. The electrodes were rinsed with cleaning solution after use.
For DL measurement 30 g sample was hung with a wire and kept in an air tight plastic container for 24 h. After 24 h the sample was weighed and calculated the difference. It was expressed as percentage (%).
30 g beef sample was taken in a poly bag and heated it in water bath until the temperature rises to 71°C in sample. Beef with 71°C was taken out from the water bath and soaked it with tissue paper. Weight loss of the sample was measured during cooking beef. CL was calculated using following formula:
Moisture, protein, fat, and ash was determined as per the standard procedures of association of official analytical chemists (AOAC, 2005).
Three types of biochemical analysis were carried out in this study: (i) thiobarbituric acid reactive substance (TBARS), (ii) free fatty acid (FFA) and (iii) peroxide value (POV) measurement. Three types of analysis are discussed below:
Lipid oxidation was assessed in triplicate using the 2-thiobarbituric acid (TBA) method described by Schmedes et al. (1989). Samples (5 g) was blended with 25 mL of 20% trichloroacetic acid solution (200 g/L of tricholoroacetic acid in 135 mL/L phosphoric acid solution) in a homogenizer (IKA) for 30 seconds. The homogenized sample was filtered with Whatman filter paper number 1 and 2 mL of the filtrate was added to 2 mL of 0.02 M aqueous TBA solution (3 g/L) in a test tube. The test tube was incubated at 100°C for 30 minutes and cooled with tap water. The absorbance was measured at 532 nm using a UV-VIS spectrophotometer (UV-1200, Shimadzu, Kyoto, Japan). The TBA value was expressed as mg malondialdehyde (MDA) per kilogram of sample.
POV was determined according to Sallam et al. (2004). The sample (3 g) was weighed in a 250-mL glass stopper Erlenmeyer flask and heated in a water bath at 60°C for 3 min to melt the fat, then thoroughly agitate for 3 min with 30 mL acetic acid-chloroform solution (3:2 v/v) to dissolve the fat. The sample was filtered under vacuum through Whatman filter paper number 1 to remove meat particles. Saturated potassium iodide solution (0.5 mL) was added to filtrate and continue with addition of starch solution. The titration was allowed to run against standard solution of sodium thiosulfate (25/1).
The formula is expressed as:
Where,
S is the volume of titration (mL),
N is the normality of sodium thiosulfate solution (n=0.01) and
W is the sample weight (g).
POV was expressed as milliequivalent peroxide per kilogram of sample.
FFA value was determined according to Rukunudin et al. (1998). 5 g sample was dissolved with 30 mL chloroform using a homogenizer (IKA T25 digital Ultra-Turrax, IKA, Königswinter, Germany) at 10,000 rpm for 1 min. The sample was filtered under vacuum through Whatman filter paper number 1 to remove meat particles. After five drops of 1% ethanolic phenolphthalein was added as indicator to filtrate, the solution was titrated with 0.01N ethanolic potassium hydroxide. The formula is expressed as:
Microbiological analysis was determined by Ikhlas et al. (2012). The procedures which were followed for microbial assessment of total viable count (TVC), total coliform count (TCC) and total yeast-mould count, are described below:
For the determination of total bacterial counts, 0.1 mL of each ten-fold dilution was transferred and spread on triplicate PCA agar using a sterile pipette for each dilution. The diluted samples were spread as quickly as possible on the surface of the plate with a sterile glass spreader. One sterile spreader was used for each plate. The plates were then kept in an incubator at 35°C for 24–48 h. After incubation, 30–300 colonies were counted with the aid of a colony counter. The average number of colonies in a particular dilution was multiplied by the dilution factor to obtain the TVC. The results of the total bacterial count expressed as the number of organism of colony forming units per gram (CFU/g) of sample.
For the determination of TCCs, 0.1 mL of each ten-fold dilution was transferred and spread on triplicate MacConkey agar using a sterile pipette for each dilution. The diluted samples were spread as quickly as possible on the surface of the plate with a sterile glass spreader. One sterile spreader was used for each plate. The plates were then kept in an incubator at 35°C for 24–48 h. After incubation, 30–300 colonies were counted with the aid of a colony counter. The average number of colonies in a particular dilution was multiplied by the dilution factor to obtain the TCC. The results of the total bacterial count expressed as the number of organism of colony forming units per gram (CFU/g) of sample.
For the determination of total yeast and mould counts, 0.1 mL of each ten-fold dilution was transferred and spread on triplicate PDA agar using a sterile pipette for each dilution. The diluted samples were spread as quickly as possible on the surface of the plate with a sterile glass spreader. One sterile spreader was used for each plate. The plates were then kept in an incubator at 25°C for 48–72 h. After incubation, 30–300 colonies werecounted with the aid of a colony counter. The average number of colonies in a particular dilution was multiplied by the dilution factor to obtain the yeast and mould count. The results of the yeast and mould count were expressed as the number of organism of colony forming units per gram (CFU/g) of sample.
Descriptive statistical analysis and Pearson correlations between the image data and reference data both were determined using the statistical package, Statgraphics Centurion XV.I. STATPOINT TECHNOLOGIES. Warrenton, Virginia, USA with a significance level of p<.05. The calibration and validation model were fitted using the software Unscrambler X version 9.7.
Results and Discussion
Color measurement is more important for the visual impression of the meat than an actual quality parameter. Color is usually measured in the CIE lab L*a*b* scale where L* denotes the lightness, a* the redness and b* the yellowness. The color values obtained from image analysis in beef were 50.75±3.43, 13.08±6.96, 13.66±2.33 for L*, a*, b* respectively (Table 1). The L*, a*, b* values from direct measurement using colorimeter were 41.67±4.08, 14.35±2.1 and 10.44±1.89 respectively and shown in Table 1. Where Fatih et al. (2016) found 48.90, 24.21 and 12.31 for L*, a*, b* respectively from image analysis and 46.73±1.01, 21.94±1.24 and 13.11±1.00 for L*, a*, b* respectively from direct measurement and Kamruzzaman et al. (2016) stated L*, a*, b* values for beef were 47.25±5.19, 15.81±2.25 and 7.56±3.29 respectively. The L* and a* values obtained from colorimeter by Weglarz (2010) were 37.40±1.38 and 13.44±2.07 respectively that are almost similar to the findings of the present study.
L*image, L*value from imaging analysis; a*image, a* value from image analysis; b*image, b* value from imaging analysis; n, sample size; CV, co-efficient of variation; DL, drip loss; CL, cooking loss; DM, dry matter; CP, crude protein; EE, ether extract; TBARS, thiobarbituric acid reactive substance; POV, peroxide value; FFA, free fatty acid; TCC, total coliform count; TYMC, total yeast-mould count; TVC, total viable count.
The descriptive statistic of pH, DL and CL are shown in Table 1. Measurements of pH have proven to be an important analytical measurement. Muscle pH is the key to the conversion of muscle to meat. During the early post-mortem changes in muscles of slaughtered animals, the pH falls from around 7.0–7.2 in the muscle of a living animal to 5.5–5.8. The pH value found in the longissimus dorsi muscle was 5.9±0.12 which is close to the findings of Weglarz (2010) and Rahman et al. (2015). The loss of fluid from meat is important for the industry because of its economic implication. DL and CL obtained from the samples were 3.2±0.6 and 29.01±1.96, respectively. The results obtained by De Marchi et al. (2007) for DL and CL as 3.87±1.72 and 23.8±3.55, respectively which are very close to the present study.
Dry matter, moisture, crude protein, fat and ash content of the sample has been shown in Table 1. The values were 24.79±2.26, 75.21±2.27, 20.88±2.69,1.57±0.63, 1.28±0.21 for dry matter, moisture, crude protein, fat, and ash, respectively. These findings are in close agreement with those reported by De Marchi et al. (2007).
The oxidative stability of beef depends upon the balance of anti and pro-oxidants and the composition of these oxidation substrates (Bertelsen et al., 2000). Average TBARS, POV and FFA value of beef longissimus dorsi were found 0.11±0.01, 1.85±0.35 and 0.04±0.01 respectively (Table 1) where researchers found almost same values in fresh beef from hind limb of bull (Rahman et al., 2000). The biochemical traits measured in this experiment were lower than the limit (TBARS: <0.6 mg MDA/kg, POV: <6 meq/kg and FFA<1.2) for rancidity.
Microbiological traits measured by the laboratory method are presented in Table 1. The average values with standard deviations were 5.09±0.05, 5.91±0.07 and 7.7±0.08 for TCC, TYMC, and TVC respectively. The TVC level of this study was in close agreement with the findings of Saba et al. (2018) but the TCC and TYMC value were higher than results of Murshed et al. (2016), Afrin et al. (2017) and Alam et al. (2017). The possible cause of this variation in microbial load might be due to the differences in the aging period.
Correlation between image data and reference data of beef longissimus dorsi is presented in Table 2. The L* value from image analysis had medium correlation with L*(0.46), pH (0.41), DL% (0.37), DM (0.31), CP (0.24) and Ash (0.25) obtained from laboratory method. A higher correlation found in a*(0.65) and moisture (0.56) with ‘a*’ value obtained from imaging technique. The ‘b’ value resulted from image analysis had a medium correlation with fat (0.33) and TVC (0.37) whereas Mello et al. (2015) measured intramuscular fat and Luo et al. (2018) determined marbling in beef using image processing. The imaging technique, CV system was very similar that were used for both the previous works and present study.
L*image, L*value from image analysis; a*image, a* value from image analysis; b*image, b* value from imaging analysis; DL, drip loss; CL, cooking loss; DM, dry matter; CP, crude protein; EE, ether extract; TBARS, thiobarbituric acid reactive substance; POV, peroxide value; FFA, free fatty acid; TCC, total coliform count; TYMC, total yeast-mould count; TVC, total viable count .
It is known that the coefficient of determination (r2) indicates the accuracy of model, varying from 0 to1. Table 3 presents the results of calibration and prediction of color, pH, DL, dry matter, crude protein, POV and ash content of the meat samples using image data. The calibration coefficients, r2 range from 0.21–0.73 and the range of prediction data r2 is 0.01–0.69. The root mean square error for calibration and prediction are general low, less than 2.4. Lightness, L* has the most association with the image data in both calibration and prediction analyses. ElMasry et al. (2012) predicted L* and pH values with coefficients of determination (r2) of 0.88 and 0.73 and root mean square errors estimated by cross validation (RMSECV) of 1.21 and 0.06 respectively in beef. Chmiel et al. (2011) used computer image analysis to detect pale, soft, and exudative (PSE) defects in pork meat. They found higher values of L* (56.01±1.62) in PSE meat compared with normal meat (48.44±0.52). From image analysis they found significantly higher values of R, G, B components for PSE meat compared with normal meat. Sun et al. (2016) applied CV method for assessing the color score in pork meat. They found very significant correlation (p<0.0001) between L*, a*, and b* features of images and Minolta colorimeter 0.91,0.80 and 0.66 respectively. They assessed the coefficient of determination (r2) for predicted pork color features was 0.83. The coefficient of determination was found 0.85 for CD large in IMF feature of longissimus dorsi muscle in beef using an image processing algorithm by Du et al. (2008).
Conclusion
The study aimed at assessing the ability of the CV system to predicts beef quality traits. Samples were analyzed for color, physicochemical, proximate, biochemical and microbiological values by conventional analytical techniques. CV technology has been standardized. After the standardization correlation coefficient was determined between image data and reference data. The calibration model and validation model was applied to find the level of accuracy of the CV technology. The highest calibration and prediction accuracy was found for color lightness (L*), medium accuracy was found in the redness (a*), pH, DL, crude protein and ash content of the sample. However, more samples and trials are to be conducted in future for the development of robust models and getting higher predicting values of the studied parameters.