


Introduction
Campylobacter jejuni is a microaerobic bacterium that can survive with the status of viable but non-culturable, and thus it is difficult to detect (Gomes et al., 2018; Hsieh et al., 2018). In Korea, there were no reported Campylobacter outbreaks until 2002, but the number of annual outbreaks has continued to increase since then (MFDS, 2018).
The symptoms of C. jejuni foodborne illness are fever, diarrhea, abdominal pain, and severe diseases such as Guillain–Barré syndrome and Reiter’s syndrome (Lopes et al., 2018; Schmutz et al., 2017). C. jejuni is also the causative pathogen of traveler’s diarrhea (Hsieh et al., 2018). To treat C. jejuni foodborne illness, antibiotics are used, but C. jejuni has become a multi-drug resistant bacterium that is resistant to several antibiotics (Lee et al., 2017; Zhong et al., 2016). Thus, the risk of C. jejuni should be assessed to manage and ensure the food safety.
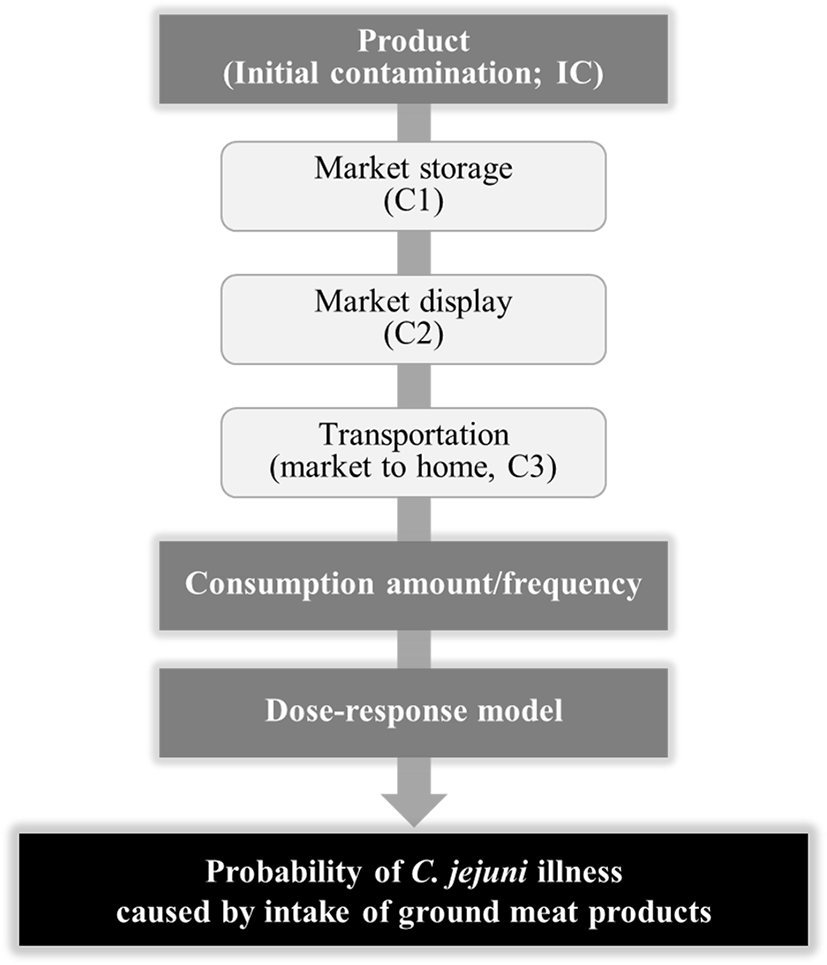
Microbial risk assessment (MRA) is conducted to support scientific evidences to control food safety (Nauta et al., 2009), and it evaluates the probability for the risk of foodborne pathogens in food. MRA is comprised of four steps: hazard identification, exposure assessment, hazard characterization, and risk characterization (CAC, 2015). The MRA scheme is very important for the analysis of the risk. As each food has various distribution environments such as time and temperature, these should be reflected in the MRA scheme.
The ground meat products in Korea might be the hamburger patty, meatball, and cutlet. The sales of ground meat products ranked fourth among processed meat products in Korea in 2016 (MFDS, 2017). The possibility for C. jejuni contamination in ground meat products has been suggested. However, the risk of C. jejuni in ground meat products has not been evaluated. Therefore, the objective of this study was to evaluate the risk of foodborne illness caused by C. jejuni in ground meat products in Korea.
Materials and Methods
To identify the prevalence of C. jejuni, three types of ground meat products (patty, meatball, and cutlet) were collected from supermarkets and foodservices in Korea, and 224 samples were analyzed in this study. They were made from only one meat (pork, chicken, or duck meat) or from more than two different meat (pork, beef, and chicken). Each sample was cut to obtain a 25-g sample, and the samples were placed in sterilized sample bags (3M™, St. Paul, MN, USA) and pummeled for 60 s with 50 mL of 0.1% buffered peptone water (BPW; Becton, Dickinson and Company, Sparks, MD, USA) using a BagMixer (Interscience, St. Nom, France). The 1-mL aliquots of the homogenates were plated on three modified CCDA-Preston agar plates (mCCDA; Oxoid Ltd., Basingstoke, Hampshire, UK), and the plates were then incubated microaerobically with CampyGen (Oxoid Ltd.) in a tightly–sealed container at 42°C for 48 h. After incubation, one typical Campylobacter colony was streaked on two Colombia agar (bioMérieux, Marcy–l′Étoile, France) plates, and each plate was incubated microaerobically or aerobically at 42°C for 48 h. Only one colony that grew on the microaerobically–incubated plate was further analyzed by colony PCR for the identification of C. jejuni, using specific primers [5′−CAA ATA AAG TTA GAG GTA GAA TGT−3′ (forward) and 5′–CCA TAA GCA CTA GCT AGC TGA T–3′ (reverse); Wang et al., 1992].
The initial contamination of C. jejuni in ground meat products was calculated using prevalence data, to estimate the probability of illness caused by C. jejuni intake. The C. jejuni prevalence data (PR) collected from this study were substituted into the Beta distribution (α, β), where α was the number of positive samples plus one, and β was one plus the number of positive samples, subtracted from the number of total samples (Vose, 1998). The equation [–Ln(1−PR)/weight], presented by Sanaa et al. (2004), was used to calculate the initial contamination of C. jejuni in ground meat products.
C. jejuni strains ATCC 33560 and NCTC 11168 stored at −70°C were streaked on Colombia agar and incubated microaerobically at 42°C for 48 h. Each colony was streaked on fresh Colombia agar plates using a sterilized swab, and the plates were incubated microaerobically at 42°C for 48 h. Five milliliters of phosphate-buffered saline (PBS, pH 7.4; 0.2 g of KH2PO4, 1.5 g of Na2HPO4, 8.0 g of NaCl, and 0.2 g of KCl in 1 L of distilled water) was poured over the colonies, and the colonies were harvested by scraping with a glass rod. The harvested cells were transferred to 50 mL conical tubes and centrifuged (1,912×g, 15 min, and 4°C). The pellets were washed twice with PBS and re-suspended in PBS. The OD values of the cell suspensions at 600 nm were adjusted to 2.0 to obtain 5−6 Log CFU/mL of C. jejuni. Two strains were mixed, and the mixture was then used as the inoculum.
Three ground meat products (patty, meatball, and cutlet) were purchased from markets and cut to obtain 25 g portions. Samples were transferred to sample bags, and 100 μL of the inocula were inoculated into each sample. The samples were rubbed 30 times to smear the inoculum, and they were stored at 4°C or 10°C for up to 5 d. The samples were analyzed microbiologically at appropriate time intervals. Into each sample bag, 50 mL of 0.1% BPW was poured and pummeled for 60 s using a BagMixer. After pummeling, the homogenates were diluted serially using 9 mL of 0.1% BPW, and 100 μL of the diluents were spread–plated on mCCDA. The mCCDA plates were incubated at 42°C for 48 h under the microaerobic condition.
To develop a predictive model to describe the behavior of C. jejuni, 100−μL aliquots of inocula were inoculated on sample surfaces in sample bags and rubbed 30 times. The inoculated samples were left for 15 min. The samples were then placed under an aerobic condition (same condition as a commercial product on the market) and stored at 4°C, 10°C, 15°C, 25°C, or 30°C for up to 15 days. To enumerate the C. jejuni cell counts, samples were placed in sample bags, containing 50 mL of 0.1% BPW and pummeled for 60 s. The homogenates were diluted with 9 mL of 0.1% BPW, and 0.1 mL of the diluents were spread-plated on mCCDA with a flame-sterilized rod. The plates were microaerobically incubated at 42°C for 48 h, and the colonies were then manually counted. C. jejuni cell counts were fitted by the Weibull model.
Where, N is the number of cells at a specific time, N0 is the initial number of cells, ρ is the curve shape, and δ is the time of the first decimal reduction. To analyze the effect of the storage temperature on kinetic parameters, the Davey model was fitted to the δ and ρ values.
Where, Y is the δ or ρ value, a, b, and c are constants, and T is the temperature. For validation of the developed predictive model, additional experiments were performed at 12°C and 23°C. The observed data for 12°C and 23°C were compared with the predicted data obtained from the developed predictive model. Differences between the observed and predicted data were quantified by the root mean square error (RMSE).
The temperatures and times for the storage, display, and transport of ground meat products were collected through communication with a person who works in the industry and from literatures (Jung, 2011; Kim, 2002). The collected temperature and time data for each step were analyzed with @RISK (Palisade Corporation, Ithaca, NY, USA) to obtain appropriate probabilistic distributions.
Consumption data of ground meat products were obtained through face-to-face interview by Gallup Korea (Seoul, Korea) from May 29 to July 8, 2015. The interviewee were about 1,500 adults (≥19 years old) in Korea (excluding Jeju Island). Of the 1,500 people, 743 (49.5%) were male and 757 (50.5%) were female, and they were classified into five groups (19–29 years, 30s, 40s, 50s, and ≥60s) according to their ages. In the questionnaire, the approximate size of the food was presented to help the respondents for estimating food amount they consumed. The sampling was extracted by square root proportional allocation and proportional quota sampling method to guarantee the representativeness and accuracy of the interview. More than 20% of the people were called and confirmed to verify if the interview was conducted properly. Collected data (95% confidence interval) were computerized by the SPSS program (IBM Software, North Carolina, USA) to obtain raw data. The computerized data were analyzed by @RISK to find an appropriate probabilistic distribution for consumption of ground meat products.
To evaluate the dose-response of C. jejuni after intake of the pathogens, we searched a dose–response models. The MRA scheme was prepared, as shown in Fig. 1. Especially, a simulation model was prepared with the initial contamination level data for C. jejuni, predictive models, probabilistic distributions for the temperature and time, the probabilistic distribution for the consumption data, and a dose–response model in Microsoft Excel (version 2007, Microsoft Corporation, Seattle, WA, USA). A simulation was then performed by @RISK for 10,000 iterations to calculate the risk of C. jejuni foodborne illness from the intake of ground meat products.
Results and Discussion
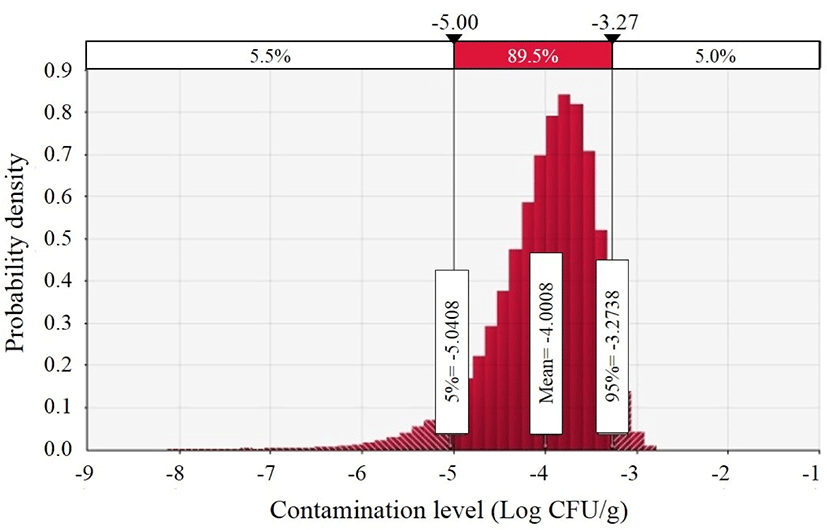
To investigate the prevalence of C. jejuni in ground meat products, the three ground meat products were selected, and 96 patties, 73 meatballs, and 55 cutlets were analyzed. Of the 224 ground meat products, there was no C. jejuni in any of the samples. C. jejuni is usually detected in fresh meats, such as chicken, duck, turkey, beef, and pork (Hussain et al., 2007; Korsak et al., 2015; Lee et al., 2017; Narvaez-Bravo et al., 2017; Zhao et al., 2001). Soultos et al. (2015) also showed that there was no C. jejuni in 105 Greek meat products, called as souvlaki. Additionally, meat products (pork chops, fermented sausage, and beef/chicken wieners) were negative for C. jejuni (Bohaychuk et al., 2006). These previous studies suggest that C. jejuni does not usually exist in processed meat products, which is consistent with our data. To preserve the food, some hurdles (oxygen, water activity, and other competing bacteria) are involved, and C. jejuni is sensitive to the hurdles (Duffy et al., 2001; Leistner, 2000; Soultos et al., 2015; Zhao et al., 2001). Thus, C. jejuni might not be detected in ground meat products. Although there were no C. jejuni–positive samples, the initial contamination level of C. jejuni in ground meat products was estimated with the Beta distribution suggested by Vose (1998), in which the α and β parameters were 1 and 225, respectively. The distribution was substituted in the equation presented by Sanaa et al. (2004), and then the mean initial contamination level of C. jejuni in ground meat products was –4.0±0.6 Log CFU/g (Fig. 2).
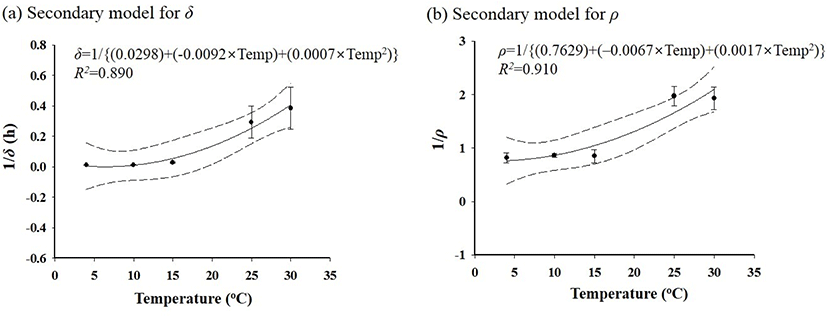
C. jejuni cells were inoculated in ground meat products (patty, meatball, and cutlet) and stored at 4°C or 10°C for 5 days. The C. jejuni cell counts for all of the samples decreased, but the C. jejuni cell count decrease was slower for the cutlet than for the patty and meatball (data not shown). Hence, the cutlet was selected as a model food, considering it as the worst case scenario. To develop a predictive model, C. jejuni–inoculated cutlet samples were stored at 4°C, 10°C, 15°C, 25°C, or 30°C, and the C. jejuni cell counts in the cutlets decreased as the time and temperature increased. The survival data were fitted by the Weibull model, and then, the kinetic parameters (δ and ρ) were calculated (Table 1). The mean of the δ value, derived from the developed model, was 94.2 h at 4°C, and it decreased as the temperature increased (Table 1). These results indicate that Campylobacter can survive longer at low temperatures than at high temperatures. The ρ values were 1.2 at 4°C, 10°C, and 15°C (concave shape) and 0.5 at 25°C and 30°C (convex shape). The Davey model was fitted to the δ and ρ values to develop the secondary model. The secondary models are presented in Fig. 3. Since the R2 values were relatively high, the secondary models were suitable to describe the correlation between the temperature and the δ and ρ values. The validation result showed that the RMSE value was 0.589 Log CFU/g. This result indicates that the developed model was appropriate to describe the kinetic behavior of Campylobacter in ground meat products.
| Kinetic parameter | Temperature (°C) | ||||
|---|---|---|---|---|---|
| 4 | 10 | 15 | 25 | 30 | |
| δ (h)1) | 94.2±10.9 | 76.7±12.0 | 37.2±6.7 | 3.9±2.0 | 3.0±1.5 |
| ρ 2) | 1.2±0.2 | 1.2±0.1 | 1.2±0.3 | 0.5±0.1 | 0.5±0.1 |
Ground meat products are usually exposed to a freezing environment during storage and display at markets. Kim (2002) reported that the mean temperature of the shelf for frozen cutlets was −18.8°C with −23.6°C as the minimum temperature and −14°C as the maximum temperature. Thus, the Pert distribution (−23.6, −18.8, −14) was applied for the storage and display temperature at the market to obtain the probabilistic distribution (Table 2). Additionally, Jung (2011) presented that the minimum, mean, and maximum temperatures during transport from the market to the home were 10°C, 18°C, and 25°C, respectively. Thus, the Pert distribution (10, 18, 25) was applied to obtain the probabilistic distribution (Table 2). The times for the storage and display of ground meat products were investigated by communication with merchants at markets. Thus, the Pert distribution (0, 72, 120) for market storage and the Pert distribution (0, 36, 168) for market display were applied to obtain the probabilistic distributions (Table 2). Jung (2011) showed that the minimum and maximum times for transport were 0.325 h and 1.643 h, respectively. The mean time for transport was calculated as 0.984 h from the minimum and maximum times. Thus, the Pert distribution (0.325, 0.984, 1.643) was used for the transport time to obtain the probabilistic distribution (Table 2).
| Input model | Unit | Variable | Formula | References |
|---|---|---|---|---|
| Product | ||||
| Campylobacterjejuni contamination | ||||
| Prevalence | PR | =RiskBeta (1,225) | This research; Vose (1998) | |
| Initial contamination level | CFU/g | Ci | =–LN (1–PR)/25 | Sanaa et al. (2004) |
| Log CFU/g | IC | =Log (Ci) | ||
| Market | ||||
| Market storage | ||||
| Time | h | Mark-timest | =RiskPert (0, 72, 120) | Personal communication1) |
| Temperature | °C | Mark-Tempst | =RiskPert (−23.6, −18.8, −14) | Kim (2002) |
| Survival | ||||
| Delta | δ | =1/{0.0298+(−0.0092×Mark-Tempst)+(0.0007×Mark-Tempst2)} | This research; Davey (1991) |
|
| ρ | ρ | =1/{0.7629+(−0.0067×Mark-Tempst)+(0.0017×Mark-Tempst2)} | This research; Davey (1991) |
|
| C. jejuni survival | Log CFU/g | C1 | =IC–{(Mark-timest/δ)ρ} | Mafart et al. (2002) |
| Market display | ||||
| Time | h | Mark-timedis | =RiskPert (0, 36, 168) | Personal communication |
| Temperature | °C | Mark-Tempdis | =RiskPert (−23.6, −18.8, −14) | Kim (2002) |
| Survival | ||||
| Delta | δ | =1/{0.0298+(−0.0092×Mark-Tempdis)+(0.0007×Mark-Tempdis2)} | This research; Davey (1991) |
|
| ρ | ρ | =1/{0.7629+(−0.0067×Mark-Tempdis)+(0.0017×Mark-Tempdis2)} | This research; Davey (1991) |
|
| C. jejuni survival | Log CFU/g | C2 | =C1–{(Mark–timedis/δ)ρ} | Mafart et al. (2002) |
| Transportation (vehicle) | ||||
| Transportation from market to home | ||||
| Time | h | Timetrans | =RiskPert (0.325, 0.984, 1.643) | Jung (2011) |
| Temperature | °C | Temptrans | =RiskPert (10, 18, 25) | Jung (2011) |
| Survival | ||||
| Delta | δ | =1/{0.0298+(−0.0092× Temptrans)+(0.0007× Temptrans2)} | This research; Davey (1991) |
|
| ρ | ρ | =1/{0.7629+(−0.0067× Temptrans)+(0.0017× Temptrans2)} | This research; Davey (1991) |
|
| C. jejuni survival | Log CFU/g | C3 | =C2–{(Timetrans/δ)ρ} | Mafart et al. (2002) |
| Consumption | ||||
| Average consumption amount | g/day | Consum | =RiskExpon (28.262, RiskShift (−0.018841)) | This research |
| Consumption frequency | %/day | ConFre | Fixed 6.98 | This research |
| Consumption pattern | CF(0) | =1–(6.98/100) | This research | |
| CF(1) | =6.98/100 | This research | ||
| CF | =RiskDiscrete ({0, 1}, {CF(0), CF(1)}) | This research | ||
| Amount | =IF (CF=0, 0, Consum) | This research | ||
| Dose-response | ||||
| C. jejuni amount | D | =10C3×Amount | Medema et al. (1996), Teunis and Havelaar (2000) | |
| Parameters | α | Fixed 0.145 | Medema et al. (1996), Teunis and Havelaar (2000) | |
| β | Fixed 7.59 | Medema et al. (1996), Teunis and Havelaar (2000) | ||
| Probability of infection by one ingested C. jejuni | p 1 | =RiskBeta (α, β) | Nauta et al. (2007) | |
| Probability of infection | Pinf (D) | =1–(1– p1)D | Nauta et al. (2007) | |
| Probability of illness given infection | P ill|inf | Fixed 0.33 | Havelaar et al. (2000) | |
| Risk | ||||
| Probability of illness /person/day | Risk | = Pinf (D)×Pill|inf | Nauta et al. (2007) |
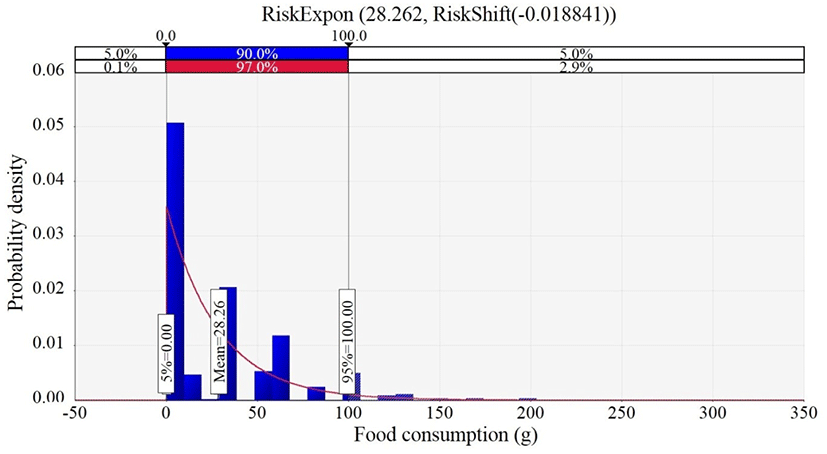
The collected data from the face–to–face interviews were analyzed by @RISK, and the analysis suggested that the best distribution for the data was the Exponential distribution. The probabilistic distribution showed that the mean value for the consumption amount of ground meat products was 28.3 g per day (Fig. 4). The consumption frequency of ground meat products was 6.98% per day (Table 2).
The dose–response model suggested by Medema et al. (1996), Nauta et al. (2007), and Teunis and Havelaar (2000) was chosen as appropriate models for C. jejuni. The probability of illness (risk) from C. jejuni intake was calculated by multiplying the probability of infection (Pinf) by the probability of illness given infection (Pill|inf) (Table 2). The simulation model, including the initial contamination level of C. jejuni, predictive models with probabilistic distributions for the temperature and time, the probabilistic distribution for the consumption data, and the dose-response model, is presented in Table 2. According to the result of the simulation, the C. jejuni cell counts decreased gradually with distribution from the market to the home. It means that the risk of C. jejuni gradually decreases during distribution. Finally, the probability of illness caused by C. jejuni intake from ground meat products at home was 5.68×10⁻¹⁰ per person per day, which can be considered a very low risk (Table 3).
| Probability of illness/person/day | 5% | 25% | 50% | 95% | 99% | Mean |
|---|---|---|---|---|---|---|
| 0 | 0 | 0 | 0 | 0 | 5.68×10⁻¹⁰ |
In conclusion, the developed quantitative MRA model was useful for estimating the risk of C. jejuni in ground meat products in Korea. Although the concern for C. jejuni foodborne illness from the intake of ground meat products has increased, the results from this study indicate that the risk of C. jejuni foodborne illness caused by the consumption of ground meat products is very low in Korea.