


Introduction
Worldwide, pork is the most produced and consumed meat compared to beef or chicken. The United States Department of Agriculture estimates that worldwide beef, chicken, and pork production in 2019 will reach 63.6, 97.8, and 114.6 million tons, respectively. This is believed to be due to continued expansion of pork production in China and the United States. In 2017, pork consumption was 54,812 metric tons in China, 20,817 metric tons in the EU, 2,741 metric tons in Japan, and 1,926 metric tons in the Republic of Korea. In addition, Korea’s pork imports grew by almost 1.5 times to 735 metric tons in 2018 compared to 480 metric tons in 2014 (United States Department of Agriculture, 2019). The pork industry is affected by economic traits of pigs involved in production and quality. Their economic traits can be affected by a wide variety of factors. These factors can be classified as genetic factors and environmental factors. First, genetic factors such as breed and genotype can affect the quality of pork. Depending on breeds, pigs can vary in their number of offspring, ability to grow, meat quality, and sensitivity to stress (Camerlink et al., 2018; Dall’Olio et al., 2018; Fabrega et al., 2002). Even if in the same breeds, their economic traits can vary greatly depending on individual or complex effects of genes (Kwon et al., 2016). For example, pigs with Halothane gene and RN gene known to have direct effects on the quality of pigs are significantly susceptible to stress. They are called PSS (porcine stress syndrome) pigs characterized by PSE (pale soft exudative) (Hamilton et al., 2000; Olivan et al., 2018). PSE pork is pale in color. It lowers consumers’ preference. Low pH of meat leads to high moisture loss and poor texture during cooking (Boler et al., 2010). External factors include feeds, raising conditions, season, pre-slaughter management, slaughter methods, cooling methods, and storage conditions (Channon et al., 2018; Faucitano, 2018; Landerslev et al., 2018; Sbardella et al., 2018). Various studies have been conducted to control these factors to improve the productivity and meat quality of pigs. Pig producers and researchers have applied these techniques to the field where they grow pigs. They have obtained very encouraging results for the development of pork industry.
However, the world is now experiencing abnormal signs caused by environmental changes such as seasons and weather due to accumulation of environmental pollution. Strange seasonal changes have a profound impact on global agricultural production (Das and Sharangi, 2018; Ziska, 2017). In Korea, the average temperature in 2017 was 13.1°C, the highest average temperature was 26.4°C, and the lowest average temperature was –0.2°C. These were 0.6°C, 1.9°C, and –1.7°C different from their normal ones (Table 1; KMA, 2017). Global temperature is gradually rising due to emission and accumulation of greenhouse gases from industrial and livestock (Sarda et al., 2018; Wei et al., 2019). In 2017, the temperature throughout the world’s land and sea increased by 0.84°C over average temperature of 13.9°C in the 20th century. The rise in ambient temperature causes damage to existing growth conditions such as the structure and action of enzymes in crops, resulting in reduced production yield of crops (Keane and Neal, 2018). Pigs have a thicker fat layer compared to other livestock. Their ability to release metabolic heat from the body to the outside is low due to the lack of sweat glands. Hence, they are vulnerable to high temperature stress (Patience et al., 2005). It has been reported that when finishing pigs are exposed to high temperatures, their feed intake is reduced by about 30%. Their hormone secretion promoting protein synthesis is lowered and their weight gain and feed efficiency are also decreased (Bowden and Paitz, 2018; Collin et al., 2001). In the case of lactating sows, abnormalities of the endocrine system due to ambient temperature change may cause deterioration in overall reproductive performance including their feed intake, lactating ability, and weight loss of weaning pigs. The efficiency of boar for semen production is also significantly affected by ambient temperature change (Einarsson et al., 2008; Suriyasomboon et al., 2006). In addition, abnormal weather change can lead to an increase in farm management cost for controlling ambient temperature in the pigpen, for suppressing odor generation from feces and urine, and for reducing incidence of diseases. It may also have a big influence on meat quality of pork due to ease of dead and abnormal meat characteristics (PSE/DFD) during transportation from pig farm to slaughterhouse with increased thermal stress of the pig (Mota-Rojas et al., 2006; Van de Perre et al., 2010a). So far, numerous studies on growth, productivity, and diseases of pigs in relation to season and temperature have been conducted and reported. However, no studies have reported characteristics of grades and primal cuts that produce substantial added value after slaughter. Therefore, the objective of the present study was to investigate slaughter results such as carcass grades, production yield of primal cuts, and fat/meat percentages in domestic commercial pigs according to season.
Materials and Methods
This study included 267,990 LYD (Landrace×Yorkshire×Duroc) crossbred pigs for commercial sale from January to December 2017. All pigs were transported to Dodram LPC in Anseong, Gyeonggi Province, Korea from pig farms of Dodram and Sunjin corporations. These pigs were slaughtered according to the Livestock Products Sanitary Control Act (MFDS, 2017). Carcass grade, carcass weight, backfat thickness, and sex ratio were measured based on hot carcass grading system of Korea Institute for Animal Products Quality Evaluation (2013). Carcasses were stored in a cold room overnight followed by commercial sales.
After bleeding and boiling, pig carcasses were scanned with Autofom Ⅲ™ (Frontmatec, Kolding, Denmark) at a speed of 200 heads per hour. Weights of primal cuts, fat and lean meat contents, and percentages of fat and lean meat were predicted by AFIII and outputted into Dodram slaughterhouse database. Weights of a total of 11 commercial cuts (belly, shoulder blade, spare rib, back rib, loin, tenderloin, shoulder picnic, ham, jowl, false lean, and diaphragm) were predicted by Autofom Ⅲ.
All statistical analyses were carried out using the GLM (Generalized Linear Model) procedure of SAS package (SAS, 2018). Means were compared using the Duncan’s multiple range test at a level of significance of p<0.05 using the following model:
Month to month variation in pig cuts
where μ = observed value of the trait
μ=mean
τ=month effect
ε=random error
Results
Table 2 and Fig. 1 show total number of heads, sex, carcass weight, and grade of slaughtered pigs per month for year 2017. September and November had the highest number of slaughtered heads in a fall of year, showing more than 60,000 slaughtered heads. The lowest number of slaughtered heads occurred in July (early summer). Regarding monthly distribution of slaughtered pigs’ sex, monthly population had a larger proportion of barrows compared to gilts except for July (Fig. 1). Monthly pig carcass weight was 88–87 kg in all months except for July to September. Backfat thickness did not change significantly between seasons. Carcass grading results revealed that a higher frequency of carcasses was graded with 1+ grade in April and May (spring) compared to that in other months whereas a higher frequency of carcasses was graded 1 in January and July.
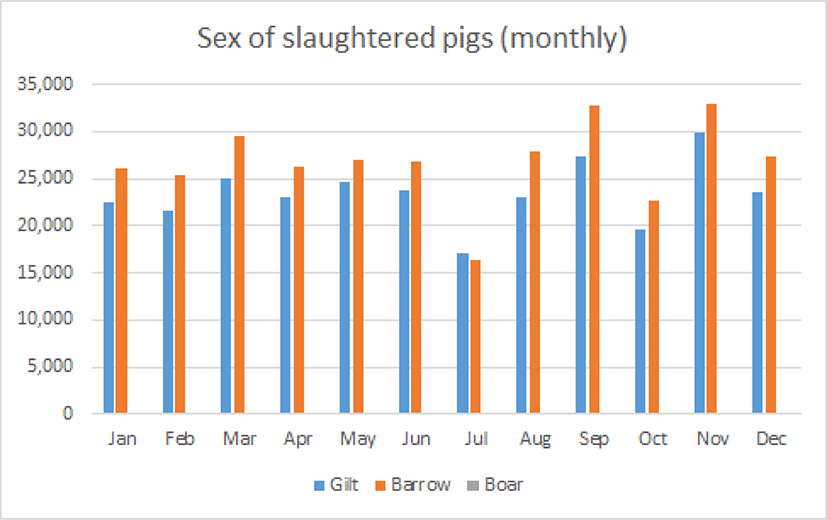
Table 3 shows seasonal (month to month) variation in weight of Dodram commercial belly bone-out incl flank cut (Samgyup-sal) across 2017. AutoForm III predicted weights of belly lean meat and subcutaneous and intermuscular fat originating from full dissection of the belly are shown in Table 2. These traits are also expressed in percentage of the weight of the belly bone-in cut. Total fat in belly is expressed in percent of belly bone-in and listed in Table 3. Total weight of pork belly bone-out per carcass (both halves) was between 11 to 12 kg in all seasons across the year. However, this cut was significantly heavier in February and May compared to other months. In August and September, the weight of belly bone-out was significantly lighter than that in other months. Bellies were the lightest in September (early fall). The weight of lean meat in pork belly per carcass was 10.0 kg in October (midfall), which was the heaviest among all seasons. The weight of lean meat in pork belly per carcass from July to September (midsummer to early fall) was significantly lower than that of other months. The percentage of lean meat was significantly higher in August and September (late summer and early fall) than that in other month. The lean meat ratio was significantly lower in February to May (late winter to late spring) than that in other months. The weight of subcutaneous fat was the heaviest in February. The ratio was significantly higher in February and March/May (late winter and early/late spring) than that in the other months. On the other hand, July to September (early summer to early fall) showed the lowest subcutaneous fat ratio than other months. The weight of intermuscular fat weight of pork belly per carcass was about 2.5 kg in all seasons. It was higher in February and March/May (late winter and early/late spring) than that in other months. Percentages of intermuscular fat and total fat were significantly higher in February to May (late winter to late spring) than those in other months.
Table 4 shows variations in Autofom Ⅲ predicted weight of deboned neck (Mokshim) and loin (Deungsim-sal) as well as lean meat and fat content of those cuts bone-in during 2017. The average weight of deboned neck was about 4.4 kg for all seasons in 2017. October in fall had the highest weight of neck bone-out and neck lean meat. Neck lean meat percentage was significantly higher in August of summer than that in other months. It was significantly lower in February to May (late winter to late spring). The weight of loin bone-out was the heaviest (5.70 kg) in October (midfall), but the lightest in July, August, November, and December (early summer, late summer, late fall, and early winter). Lean meat percentage of loin was significantly lower in February to May (late winter to late spring) than that in other months of 2017. It was the highest in September (early fall) among all seasons. In addition, total fat (subcutaneous and intermuscular) percentage of loin was the highest in February to May (late winter to late spring), but the lowest in August and September (late summer and early fall).
Table 5 shows variations in Autofom Ⅲ predicted traits related to weight and lean meat of shoulder and ham across all seasons in 2017. Weights of deboned shoulder and shoulder lean meat were heavier (p<0.05) in February and October than those in other months. They were the lowest in July to September (midsummer to early fall). Shoulder lean meat weight was significantly lower in summer 2017. Lean meat percentage of shoulder was higher in August and September. It was significantly lower from winter to spring compared to other seasons of 2017. Total weight of deboned ham (both left and right side from carcass) and the weight of ham lean meat were the heaviest in October, but the lightest in July and August (mid and early summer) compared to other months of 2017. Ham lean meat percentage was the highest in September (early fall) 2017, but the lowest from February to May (late winter to late spring).
Table 6 shows traits of rib cut and some special Korean commercial cuts predicted by Autofom Ⅲ across seasons in 2017. The weight of rib bone-in was about 3.6 kg for each month. Total weight was the heaviest in February and October (late winter and midfall). The lightest weight was observed from June to September (summer to early fall) (p<0.05). The weight of rib lean meat was heavier in February and October (late winter and midfall), but the lightest from June to September (summer to early fall) (p<0.05). Special cuts of pig carcass were spare rib, tenderloin, jowl, false lean, and diaphragm. Weights of spare ribs were the heaviest in February (late winter). They were significantly lower from July to September (midsummer to early fall) compared to those in other months. The tenderloin showed the heaviest weight in October (p<0.05) and the lowest weight in July and August (mid and late summer) (p<0.05). The average weight of jowl was 0.51 kg in February, which was the heaviest in the year. The lightest weight of jowl was obtained from July to September (midsummer to early fall). The average weight of false lean in February was 0.40 kg, which was the heaviest during the year. The lightest weight was from July to September (midsummer to early fall). The diaphragm had the heaviest weight in October (midfall) (p<0.05) and the lightest weight in July and August (mid and late summer).
Discussion
Heat stress is a major cause of reduced pork production in the pig industry. St-Pierre et al. (2003) have estimated that the economic loss of the US pork industry due to heat stress is about $299 million annually. Renaudeau et al. (2011) have reported that the performance of growing-finishing pigs is decreased with increasing temperature through a meta-analysis of research papers related to increase in ambient temperature and economic characteristics of pigs. This is because when temperature increases, feed intake of pigs decreases (Collin et al., 2001). In addition, Renaudeau et al. (2012) have reported that atmospheric humidity can influence the feed intake of pigs and that humidity above 80% amplifies heat stress effects on their feed intake. Rinaldo et al. (2000) have reported that large white growing pigs show decreased feed intake at 22 g per day when ambient temperature changes from 20°C to 24.6°C and humidity changes from 75% to 84%. Changes in ambient temperature from 24.6°C to 27.3°C and humidity from 82% to 84% reduced feed intake by 68 g per day. Le Bellego et al. (2002) have raised castrated pigs (Pietrain×Landrace×Large White) from 27 kg to 100 kg at 22°C and 29°C and reported that 15% of average daily feed intake and NE (net energy) intake are reduced in pigs raised at 29°C compared to those raised at 22°C. These results are in agreement with those of Kerr et al. (2003). These decreases in feed intake can lead to a decrease in body weight gain. Pearce et al. (2013) have confirmed this with ambient temperature stress of 35°C in crossbred gilts at the growing period. At the study of Nienaber et al. (1993), growing-finishing pigs did not eat feed anymore as the ambient temperature increased, that was 13% and 26% less compared to thermoneutral controls. Researchers reported that pigs reared at controlled environment like an indoor pen were better than un-controlled environment like an outdoor pen from weaning to finishing periods in both summer and winter seasons (Enfalt et al., 1997; Sather et al., 1997).
Environmental conditions of pig farms would vary from the summer season (July to August) which is very hot and humid compared to the cold and dry winter season in Korea. Such hot and humid conditions would have a negative impact on growth and economic traits of pigs. Thus, this study indicate that the carcass weights of pigs slaughtered during July to September months are significantly low among a year.
According to the Korean Meteorological Administration (KMA), average temperatures in July and August of the whole country were 26.4°C and 25.4°C, respectively, in 2017, the highest temperatures in a year. Rainfall amounts in July and August were 308.0 mm and 241.0 mm, the highest in a year. Relative humidity in July–August ranged from 70% to 85%.
High ambient temperature is associated with seasonal infertility in pigs. It has been reported that heat stress can reduce the implantation of fertilized eggs and inhibit embryonic development in swine (Einarsson et al., 2008). Indeed, one study in Thailand has found that high temperature and humidity have a significant negative impact on the number of piglet birth (Suriyasomboon et al., 2006). In addition, boars produce semen for artificial insemination. High ambient temperature and humidity affect sperm production, mobility, and abnormal rate of sperm head. In addition, high temperatures cause abnormal gene expression in sperm head which reduces sperm viability (Kunavongkrit et al., 2005; Rempel et al., 2018). Moreover, when the uterus of swine has high temperature stress, the testis part of the born piglet tends to be small and the productivity of semen taken from the male is not high which can increase abnormality (Lugar et al., 2018). In general, swine has a gestation period of about 114 days. Mother pigs fertilized in July will produce piglets after 114 days. Their piglets are slaughtered at slaughterhouses after 7 to 8 months of breeding periods. Therefore, piglets born in August, the warmest and humid time in Korea, will have a small population. Considering the period of pregnancy and breeding period of pigs, the number of pigs sold in July is expected to be small. On the other hand, in this study, the number of females was higher than that of males only in July, Sex ratio should be 1:1. However, it can be changed by environmental condition (Hansen, 2009). Recently, global warming and environmental pollution have caused abnormalities in sex ratio. Sex ratio in various organisms can be changed by high temperature (Bowden and Paitz, 2018). Until now, it has been unclear how temperature affects the determination of sex in pigs. It is clear now that high temperature and humidity in the summer have negative effects on the productivity of females and semen production of males.
The fully automated pig carcass grading equipment (Autofom Ⅲ) was installed for the first time in Korea’s D company in 2013. Prediction models installed in the system enable prediction of traits including backfat thickness and yields of a variety of Korean commercial cuts. Validation of its prediction accuracy has been reported by Choi et al. (2018). r2 cv values of five major cuts (deboned neck, shoulder, loin, belly, and ham) of pig carcasses ranged from 0.77 to 0.86. Other small cuts had lower predictive accuracies. We think that verification of small cuts is required to improve the accuracy of Autofom Ⅲ’s prediction ability through continuous feedback with Autofom Ⅲ company C in the future. In Europe, around 100 Autofom Ⅲs are installed in pig slaughter houses for carcass grading and product sorting. Recently, Janiszewski et al. (2018) have shown a high prediction accuracy of Autofom Ⅲ for porkbelly muscle thickness and ham lean meat percentage, with r2=0.98 and r2=0.93, respectively. In Spain, to improve the final quality of dry-cured hams, Masferrer et al. (2018) have concluded that Autofom Ⅲ can be used to predict subcutaneous fat thickness of ham.
Van de Perre et al. (2010b) have reported the rate of PSE incidence in pigs slaughtered in winter (December–March) and summer (April–September) raised in Belgian pig farms by muscles (M. gracilis, M. semimembranosus, and M. longissimus dorsi). The rate of PSE incidence was higher in summer than that in winter. Cooked ham of pigs slaughtered in summer showed lower slicing yield, lower water/protein ratio, and higher protein content. This is a characteristic of a typical PSE meat. It is judged to be a state in which water is released in a large amount (Kauffman et al., 1978). Seasonal heat stress accelerates intramuscular metabolism and physiological changes after slaughter, resulting in rapid pH reduction and lower final pH in meat (McKee and Sams, 1997). In the present study, the reason for the lowest weight of carcass in August is because August is hot and humid during the whole year in Korea. Such condition can affect the occurrence of abnormal carcass of porcine. The weight of pork belly in August was significantly lower than that in other months. This tendency was observed in all cuts (shoulder blade, loin, fore leg, hind leg, rib, tender loin, spare rib, joal, and false lean) except for the diaphragm. Therefore, this characteristic can be regarded as a major cause of increase in the price of pork during the summer in the Republic of Korea.
On the other hand, in a study by Lu et al. (2007), heat stress reduced fat deposition of chickens. Especially, subcutaneous fat and intermuscular fat decreased significantly. The reason of this result was limitation of feed intake caused by heat stress. In pigs, heat-stressed porcine carcasses also show lower fat deposition than those without heat stress (Prunier et al., 1997). Like chicken, pig also has a single stomach. Since both chickens and pigs are susceptible to heat, heat stress might reduce their feed intake. In this study, total fat contents of porkbelly and loin were significantly lower in August and September compared to those in other months. The relatively low fat content might be due to high lean percentage in other cuts. However, various factors (sex, genotype, specification condition, and so on) besides temperature might have effects on fat content. A previous study has reported that decreases of ME intake and average daily gain of pigs are due to environmental factors related to seasonal changes such as temperature increase that can limit feed intake, with larger pigs being more sensitive to heat stress than smaller pigs (Renaudeau et al., 2011). Therefore, fattening pigs with sale period approaching in the summer season that are more sensitive to heat stress can affect conductors.
In addition, Le Bellego et al. (2002) have reported that energy distribution between protein and fat depositions in pigs depends on feed intake and temperature. Ambient temperature of 30°C resulted in lower feed intake of barrows than ambient temperature of 23°C, leading to a low daily fat accumulation rate of pigs. On the other hand, Katsumata et al. (1996) have reported that when tallow fat (100 g/kg) is fed to barrows (Duroc×Large White×Landrace) at high ambient temperature (30°C), it can induce high backfat thickness, carcass fat accumulation, and internal organ fat at high ambient temperature because high temperature causes higher digestible energy (DE) intake than low ambient temperature (23°C). However, in this study, feed factors were not included in the analysis of data. More research is needed on consumer’s preference of pork in the summer.
Conclusion
This study assessed and summarized characteristics of carcass properties and meat cuts predicted by Autofom Ⅲ for one year based on seasonal slaughtering performance (30,000–60,000 heads/month) of a typical pig slaughterhouse (LPC) in Korea in 2017. There were significant differences in seasonal slaughter number and sex ratio. Also, carcass weight and carcass grades were different according to seasons. In midsummer – early fall when ambient temperature was high, the ratio of slaughtered pig number to barrow number and carcass weights were low. Regarding characteristics of cuts during the hot seasons (July–September), weights of cuts were smaller than those in other months while belly, neck, loin, shoulder, ham, and rib showed high percentage of lean meat but low fat percentage. These results are thought to indicate the traits difference of the periods when environmental effect such as temperature and humidity during intense seasons, which are important to the pig’s growing periods, are consequently slaughtered, and the results of this study suggest that management of pigs depending on the seasons can affect the quality of porcine carcass and pork quality after slaughter.