Introduction
Cheese, as a traditional dairy product, its consumption is increasing gradually in China. During the cheese manufacturing, it generates a large amount of whey, which represents about 85%-90% of the milk volume (Siso, 1996), and it has been estimated around 200 million tons of whey per year with an increased rate of about 2% per year (Illanes, 2011). As the main by-product of cheese, it retains more than half of the nutrient in milk, such as lactose, vitamins, minerals, bioactive proteins and other small molecular substances (Michaelidou and Steijns, 2006), which made it drawn considerable attention from researchers (Kinsella and Whitehead, 1989). The separation of its bioactive components will be a promising strategy for the utilization of cheese whey.
Cyclic adenosine-3′,5′-monophosphate (cAMP) is regarded as one of the most important “second messenger”, which plays the regulatory role in several fundamental cellular processes, including metabolism, differentiation, cell cycle and proliferation (Ahmad et al., 2015; Goula and Lazarides, 2015). It has been reported that cAMP was obtained mainly by three approaches: chemical synthesis, microbial fermentation and extraction from natural materials (Taguchi and Mushika, 1975; Cyong and Hanabusa, 1980). Given that the abundant raw material, simple operation and non-toxic side effect, extraction from natural materials was the main method and a lot of attentions have been paid on the cAMP study (Bressan and Ross, 1976). Although there were numerous reports showed that the cAMP was usually extracted from cells, animal and plant tissues (Lomovatskaya et al., 2011; Reinecke et al., 2013), the separation and purification of cAMP from cheese whey were rare. It will be a promising strategy to separate cAMP from the abundant cheese whey in dairy industry.
Due to the differences in food culture between east and west, as well as the limited processing technic, the industrialization of cheese is still in its primary stage in China. Therefore, this study tried to provide a new way to promote the utilization of cheese whey, and also proves that the cheese whey may be a novel and promising source of cAMP. In this study, we aimed to make semi-hard cheese (Gouda) and got the whey simultaneously. The cAMP was separated and purified from cheese whey used three different types of macroporous resins. The adsorption and desorption performance of macroporous resins and optimized the conditions of cAMP separation were also explored.
Materials and Methods
Fresh bovine milk was purchased from dairy farmers in Xi'an suburbs (Shaanxi province, China), and transported to the laboratory at a low temperature (2°C). Standard substance of cAMP were purchased from Sigma-Aldrich (chromatography grade, USA).
The Gouda cheese was processed according to the method described in a previous study (Ong et al., 2011). Before pasteurization (72°C for 15 s), the fresh milk was filtered by a gauze filter to remove impurities such as hair and foam then cooled to 32°C. The pasteurized milk was then inoculated in mesophilic stater culture containing Lacctococcus lactic ssp. lactics and Lactococcus lactis ssp. cremoris (Danisco Choozit MA14 LYO 50 DCU) and cultured at 32°C for 40 min. Both CaCl2 and rennet (Nabisco, USA) were added to initiate the coagulation process at 32°C for 2 h. After complete coagulation, the resultant gel was cut into cubes and transferred into the molds for draining of whey at 40°C. After the whey was totally removed, the solid was repressed overnight. Thereafter, the cheese was collected and stored in aluminum foil at 4°C and 90% humidity for postripeness. The composition analysis of whey and milk were based on the methods described in the Chinese national standard (GB5413-2010).
The Box-Behnken Design (BBD) is one of the response surface methodology (RSM) based on three levels incomplete factorial designs. In this study, BBD was used to optimize the cheese processing. Three central points were used to estimate the experimental error and the suitability of a certain model. The rennet (g/L, A), cheese culture (g/L, B) and CaCl2 (g/L, C) were selected as the independent variables according to our preliminary experiments. The ranges and levels for both codes and actual values of the independent variables were listed in Table 1. The performance of the process could be described by the following quadratic polynomial equation:
Where Y represented cheese sensory evaluation score (response variable), β0, βi, βii, βij, were intercept coefficient, linear term, quadratic term and interaction term, respectively; xi and xj were coded levels of independent variables. The Design Expert 8.00 software was used for the regression analysis and numerical optimization.
| Independent variables | Factor levels | ||||||||
|---|---|---|---|---|---|---|---|---|---|
|
|
|||||||||
| −1 | 0 | 1 | |||||||
| Rennet (g/L) | A | 0.02 | 0.04 | 0.06 | |||||
| Starter Culture (g/L) | B | 0.02 | 0.03 | 0.04 | |||||
| CaCl2 (g/L) | C | 0.1 | 0.2 | 0.3 | |||||
Descriptive sensory analysis is widely used in food research and development (Bárcenas et al., 2000). In this study, sensory analysis was performed to evaluate the cheese according to ISO 22935-1, 2, 3 (Cardello and Segars, 1989; Muir and Hunter, 1991; Piggott and Mowat, 1991). The panelists were screened and trained for the basic taste recognition and ranking tests (Meilgaard et al., 2006). And then 17 samples were randomly coded and presented to panelists. All samples were kept with undifferentiated scale and shape and evaluated by 15 trained panelists (4 males and 11 females, 22 to 26-year-olds). The consumption was limited to two pieces for each panelist because excessive consumption might saturate the sensory elevators. The marking table of sensory evaluation was shown in Table 2.
In order to remove soluble protein, the whey samples were heated to 75°C and then centrifuged at 5000 rpm for 10min, the top layer and precipitates were discarded. The supernatant was collected and stored at 4°C until the crystallization of lactose was formed (approximately 12 h). Then the sample was centrifuged at 3000 rpm for 10 min to discard the sediment. The supernatant was concentrated with a rotary evaporator at 40°C and stored at 4°C for further analysis. High-performance liquid chromatography (HPLC) system equipped with HC-C18 (5 µm, 4.6 mm × 250 mm) chromatographic column (Agilent, USA) was used to analyze the concentration of cAMP. The column was maintained at 25°C, and the flow rate was 1 mL/min with methanol mixed with 0.05 mol/L potassium dihydrogen phosphates at a ratio of 4:6 (V/V). The detection wavelength was 259 nm and the injection volume was 20 µL.
Macroporous adsorption resins (MARs) D290, D101 and 201 × 7 provided by Jingbo chemical Co. Ltd. (Xi’an, China) were selected to purify cAMP according to the previous methods (Wu et al., 2015). These resins were washed by 95% ethanol to remove the monomers and porogenic agents, then rinsed with deionized water.
The preliminary selection of MARs was based on their static adsorption capacities and desorption ratios (Chang et al., 2012). Briefly, in the static adsorption capacities test, a pre-weighed amount of MAR (approximately 20 g wet MAR) was mixed with 30 mL concentrated cAMP solution in a flask, then the flask was placed in a shaker (100 rpm) until the cAMP content in the solution was constant. The concentrations of cAMP in equilibrium liquid-phase were analyzed using HPLC.
Static desorption process was carried out as follows: after adsorption, the MAR was separated from adsorption liquid and washed by 100 mL deionized water for several times, following by mixing with 200 mL HCl (0.1 mol/L) -NH4Cl (0.2 mol/L) solution in a flask, and then placed in a shaker (100 rpm) until the concentration of cAMP in desorption solution was constant. Three replicates of adsorption and desorption experiment were conducted for each resin.
The adsorption capacity and desorption ratio of MAR was calculated as reported previously (Wu et al., 2015), and the adsorption capacity qe [µg/(g wet MAR)] was calculated according to the following equation:
The desorption ratio of MAR, desorption ratio D (%), was calculated according to the following equation:
Where C0 and Ce were the initial and equilibrium liquid-phase concentration (µg/mL) of cAMP, respectively, V was the volume of adsorption solution (mL), and W was the weight of wet MAR (g). Cd and Vd were the concentrations of cAMP in desorption solution (mg/mL) and the volume (mL) of desorption solution.
An orthogonal array design (3 factors 3 levels) was constructed to optimize the purification conditions of cAMP by D290. The range of each factor was determined by the single-factor experiments and the experimental design was shown in Table 3. The adsorption capacity of D290 was considered as the dependent variable and calculated with the equation displayed before.
Adsorption and desorption tests were conducted in a glass column (Φ 2.4 cm × 35 cm) according to Yang’s description (Yang et al., 2015). Briefly, the single-factor experiments were performed under different conditions: sample concentration (25, 50, 100, 150, 200 µg/mL, respectively); flow rate (1, 2, 3, 4, 5 mL/min, respectively) and pH (3.5, 4.0, 4.5, 5.0, 5.5, respectively). Subsequently, the eluent was collected for the further analysis.
In order to obtain the optimal parameters of cAMP desorption on the chromatography column, 250 mL cAMP solution (50 µg/mL, pH 4.5) was loaded into the column at rate of 1 mL/min, and the MARs adsorbed cAMP was washed with 300 mL NH4Cl (0.2, 0.3, 0.4, 0.5,0.6 mol/L, respectively) at flow rate of 1, 2, 3, 4, 5 mL/min, respectively. The eluent was collected to detect the cAMP concentrations by HPLC.
Results
The BBD experimental results were shown in Table 4. A step-wise regression model of response surface for cheese sensory score (Y) was calculated according to following equation:
Y=84+A+0.88B−1.63C+3.50AB−3.00AC+5.25BC−8.38A2−2.13B2−2.13C2
In the quadratic regression model, the ANOVA analysis (Table 5) revealed that the second-order response surface model was highly significant (p<0.0001), which indicated that the model was appropriate. Furthermore, the R2 coefficient was 0.9894, which means that this model was reliable because more than 98.94% of the cheese sensory evaluation score was attributed to a high correlation between the independent variables, while only less than 2% could not be explained by the model. Besides, the relatively high adjusted determination coefficient (Adj-R2=0.98) accounts for a high significance of the model (Wang and Lü, 2014). Table 5 showed that R2 and Adj-R2 values were similar, which indicated that there was no insignificant term included in the model. The significance of each term was also shown in Table 5 based on p-value. A smaller p-value indicated a more significant term. We found that A2, B2, and C2 etc. had greatest impacts on cheese sensory score, followed by terms of A and B.
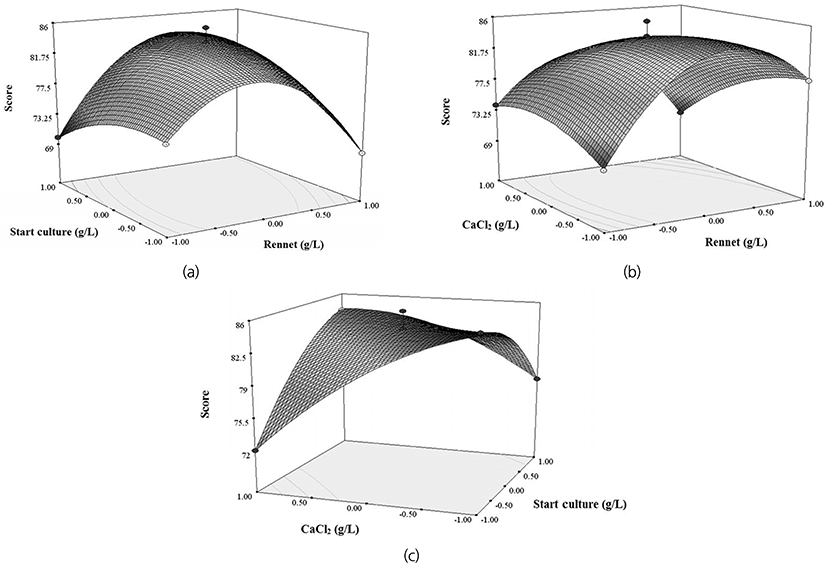
To visualize the relationship between variables and responses, the 3D response surface plots were generated for the function model of two variables. As indicated in Fig. 1(a), the increase of the cheese sensory score was related to the high concentration of rennet (0.04 g/L) and start culture (0.03 g/L). In the A-C interaction plot [Fig. 1(b)], the high sensory score appeared at the range of optimal concentrations of A (0.02-0.04 g/L) and C (0.1-0.2 g/L). The B-C interaction plot [Fig. 1(c)] illustrated that the high sensory score was achieved by 0.03 g/L for B, and 0.2 g/L for C. In general, cheese sensory score increased with CaCl2 concentration from 0.1 g/L to 0.3 g/L.

Total protein, lactose, fat and other composition of bovine milk and cheese whey were evaluated (Table 6). Compared with the raw milk, the contents of protein and fat in whey were decreased by 84.78%-87.71%, and the contents of minerals were down-regulated except for sodium and potassium. In contrast, the non-protein nitrogen increased double [(0.061±0.002)% in whey vs. (0.026±0.004)% in raw milk].
a,bmeans with different superscripts were significantly different (p<0.05).
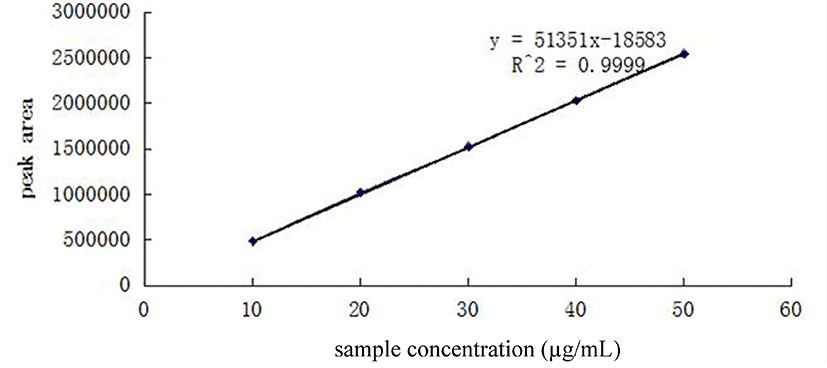
The concentrations of cAMP were calculated according to the standard curves obtained by a series of diluted standard cAMP solutions (from 10 µg/mL to 50 µg/mL) (Fig. 2). All standards and samples were analyzed by HPLC in triplicate. The standard curve was built by plotting peak areas against cAMP concentration (Y=51351X-18583, R2=0.9999, where Y was the peak area of cAMP and X was the corresponding concentration of cAMP). It was investigated that the concentration of cAMP in whey was 0.058 µmol/mL.

The adsorption capacity (qe) and desorption ratio (D) were used to evaluate the adsorbent efficiencies of the MARs. Three MARs, ranging from non-polarity to polarity, were tested for selecting an appropriate MAR for adsorbing cAMP. As shown in Table 7, D290 and 201 × 7 had better adsorption properties than D101, suggesting that the nonpolar MAR was appropriate to adsorb cAMP. In the desorption process, the desorption ratio of D290 was 57.26%, higher than D101 and 201 × 7. Therefore, for the good adsorption and desorption properties, D290 was selected to separate and purify the cAMP.
a,bmeans with different superscripts were significantly different (p<0.05).
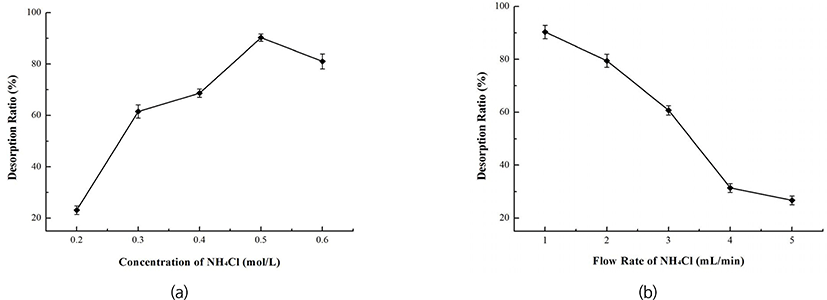
The influence of concentration, pH value and flow rate of the initial sample on adsorption of D290 were investigated, the results were shown in Fig. 3. The adsorption capacity of D290 was increased with the concentration and pH value of the initial sample, but decreased with the flow rate. The adsorption capacity of D290 reached a maximum when the loading concentration was 50 µg/mL or the pH value was 4.5, whereas sharply dropped when the flow rate was faster than 2 mL/min. Based on the R values, effects of the above three factors on adsorption capacity were B > A > C (flow rate > sample concentration > solution pH). The optimal parameters were as follows: Concentration = 50 µg/mL, pH value = 4.5, flow rate = 1 mL/min. Under these optimal conditions, the adsorption capacity could reach 69.57% (Table 3). Moreover, D290 desorption ratio was increased from 22% to 90.08% when the NH4Cl concentration was increased from 0.2 to 0.5 mol/L [Fig. 4(a)], but decreased with the increasing of elution flow rate [Fig. 4(b)]. Thus, we obtained that the suitable eluent condition for desorption of D290 was (0.1 mol/L) HCl-(0.5 mol/L) NH4Cl with the flow rate of 1 mL/min, by which the purification rate of cAMP reached to 62.64%. At this purification rate, the concentration of cAMP was calculated to 0.095 µmol/mL due to loading concentration of cAMP was 50 µg/mL (=0.1519 µmol/mL).


Discussion
Although the cheese consumption has increased in China recently, the development of industrialization manufacture of cheese was still in the primary stage. Therefore, it is necessary to develop a kind of cheese making methods suitable for industrial manufacturing. In the present work, cheese manufacturing was optimized based on the sensory evaluation of Chinese. In the processing, the salting step was discarded because of the flavor, although adding salt could accelerate the draining of whey, benefit for the storage of cheese and also have a special function for the cheese flavor.
In the processing of cheese manufacturing, the coagulation of milk is the most important factor for the cheese quality, which was significantly influenced by microbiology fermentation and concentration of rennet and CaCl2. It has been reported that 0-0.2 g/L of CaCl2 was commonly applied in cheese manufacture (McMahon et al., 1984; Ustunol and Hicks, 1990). The best performance of gel firmness, coagulation rate and viscoelastic properties could be obtained by adding 0.16 g/L CaCl2 (Wolfschoon-Pombo, 1997). It has been suggested that the higher concentration of CaCl2 (>3.0 g/L) had an adverse effect on coagulation property because of the great number of cross-linkages among casein molecular induced by CaCl2 (Ong et al., 2013). In the present study, we found that adding 0.1g/L of CaCl2 could produce the firmer gel with higher sensory score, these differences might be caused by the different properties of milk. Collectively, for the development of cheese products in China, both healthy and suitable manufacturing process are necessary, which was one of the most important points for the cheese research.
It has been reported that cAMP plays a regulatory role in several fundamental cellular processes, including metabolism, differentiation, cell cycle and proliferation (Ahmad et al., 2015; Goula and Lazarides, 2015). However, the cAMP is still mainly extracted from plants, such as dates, tomatoes and some traditional Chinese medicine. Consequently, development of the new source of cAMP can be the crucial aspect. As the production of cheese whey increased rapidly, it may be a good source for the cAMP commercial production. The present study indicated that isolating cAMP from cheese whey was feasible. With optimizing the purification conditions, the final concentration of cAMP was 0.095 µmol/mL, which had a great potential in dairy industry.
Although the cAMP was successfully isolated and purified, there still were several problems: (1) In the processing of isolation, the protein in the whey is heated to be denatured, and then discard by centrifugation. As the whey protein also has special and significant bioactivities (Yadav et al., 2015), it is worth to be developed simultaneously, which need further study in the future. (2) During the absorption and desorption of cAMP by macropore resin, cAMP still could be detected in the solution of absorption and desorption. The purification process was needed to be optimized to improve the yield and purity of cAMP further.
In this study, the cheese manufacturing processing was optimized based on the sensory evaluation, and the compositions of milk and whey were analysed. cAMP was successfully separated from cheese whey, and purified by the macropore resin, which proved the cheese whey was a promising source for the commercial cAMP production.
Conclusion
Based on the BBD, cheese processing was optimized according to the Chinese sensory evaluation. Composition analysis indicated that there has significantly different between fresh bovine milk and whey, especially for the concentration of protein and non-protein nitrogen. With excluding protein, lactose and other substance, cAMP was successfully isolated from cheese whey. Based on the optimum purification conditions, the content of cAMP was increased from 0.058 µmol/mL to 0.095 µmol/mL by D290 resin. Collectively, the results suggested that whey was a novel and promising source of cAMP, which could also promote the development of whole cheese industry.


