


Introduction
Samgyetang is a traditional, healthy Korean cuisine that is popularly known to have a rejuvenating effect (Nam et al., 2010). It is made from a whole chicken that is supplemented with glutinous rice, jujube, garlic, and chestnuts in the abdominal cavity and then cooked with broth for 1-2 h. Ready-to-eat (RTE) Samgyetang is a commercial product that was developed to meet consumer demand for convenience with respect to cooking and serving. This product is generally retorted at 120°C for 50-65 min and can be preserved for more than one year at room temperature. Despite its merits related to storage and cookery, RTE Samgyetang products have some drawbacks with respect to sensory-related qualities, such as excessive fat droplets in its broth that look unappealing and taste greasy, and the deterioration in porridge texture with increased storage time. Jang and Lee (2012) reported that the sensory quality of retorted RTE ginseng chicken porridge is unmarketable after 28 wk of storage at 25°C due to the generation of off-odors and off-flavors and changes in color and texture. They indicated that the retrogradation process of rice after an extended storage period leads to a relatively poor porridge texture. Triyannanto and Lee (2014) reported that the hardness of retorted Samgyetang porridge for various concentrations of supplemental sucrose stearate decreases over time during storage at 25ºC. Moreover, Seo et al. (2014) showed that the meat texture of Samgyetang treated with superheated steam and high hydrostatic pressure is inferior to the texture of meat prepared by conventional cooking.
Sucrose stearate is commonly used in food products, such as bread, margarine, drug capsules, and milk, to improve consumer satisfaction. It is cheap, easy to obtain, hydrophilic, and GRAS (Akoh and Swanson,1994). Sucrose stearate can be used for oil in water (o/w) emulsions and to maintain starch-based food products (Lee et al., 1991).
To our knowledge, there are few records of the application of sucrose stearate to Samgyetang during storage, and particularly few studies have been conducted to examine sensory-related characteristics. Therefore, the effect of sucrose stearate on the sensory-related characteristics of the broth and porridge of RTE Samgyetang during storage were investigated.
Materials and Methods
Korean broiler chicken (approx. 450 g) and seasonings were bought from a local market (Hanaro Mart, Gangneung, Korea). Subcutaneous fat was partially trimmed from parts of the whole chicken (i.e., the neck, wings, abdomen, and tail) to avoid excessive fat droplets in the Samgyetang broth. Samgyetang was made by filling the abdominal cavity with 100 g of glutinous rice, 100 g of ginseng (55 g), garlic (12 g), jujube (13 g), chestnut (20 g), and 200 mL of broth. The broth was prepared by boiling water with chicken powder, an old broiler, garlic, ginger, chestnut, salt, milk vetch root, pepper, and sugar for 2 h while removing fat droplets and foam from the surface. Then, the sucrose stearate emulsifier containing approximately 70% stearic acids (S-1670 HLB 16, Mitsubishi-Kagaku Foods Co., Japan) was added at concentrations of 0.1% (T1), 0.2% (T2), and 0.3% (T3) (w/v) with the broth in different containers. The mixture was mixed thoroughly at 20,000 rpm for 30 s using a homogenizer (T 18 Ultra-Turrax, IKA, Germany) at 85°C. These materials were then packed in a retort pouch (PET 12 μm/AL 9 μm/PA 15 μm/CPP 100 μm) and sterilized in a retort machine (PRS-06-1, Kyonghan Co., Ltd., Korea) at 120ºC for 65 min (F-value of approx. 8.0). All processes were performed in the Packaging Laboratory of Gangneung-Wonju National University and at the Gangneung Industrial Complex, Korea.
Ten to eleven panelists took part in the sensory evaluation. The panelists ranged from 22 to 61 years old (mean = 27.3 years old, SD = 11.28), and included both men and women. The panelists were trained every three mon for one year to understand the quality characteristics of Samgyetang during storage. The evaluation procedures were explained to the panelists in detail prior to the sensory analysis.
Before the analysis, the panelists were given a questionnaire to be completed during the evaluation. The panelists approached a table that accommodated 10-11 individuals, where the RTE Samgyetang was divided into three parts: whole chicken meat, broth, and porridge. The samples were placed on polypropylene trays, labeled with three-digit random numbers, and presented to the panelists under three-wavelength lamps (1,200 lux). The panelists had experience with the Samgyetang sensory analysis during prior experiments. The panelists were also instructed to rinse their mouths with bottled water supplemented with a few drops of acidic apple solution between tasting the broth and porridge samples. After a panelist finished each of the Samgyetang parts (whole chicken meat, broth, and porridge), he or she rinsed their mouth with water. This procedure was designed to avoid any cross-contamination of sensory characteristics among the samples.
During evaluation, the panelists scored their perceptions of the sensory parameters for broth and porridge samples. The broth was evaluated based on color, clarity, size of fat droplets, and taste. The porridge sample was evaluated based on color, softness, vividness, and taste. All packed samples were initially warmed up at 85°C in boiled water for 15 min before the sensory analysis. The samples were evaluated using 9-point hedonic scales for each sample characteristic, where a score of 1 represented excessively dark brown (color), excessively turbid (clarity), excessively large (fat droplet size), and excessively poor (taste) and a score of 9 represented excessively bright, excessively transparent, excessively small, and excessively tasty for the same characteristics. For porridge characteristics, a score of 1 represented excessively dark brown (color), excessively hard (softness), excessively vague (vividness), and excessively poor (taste), and a score of 9 represented excessively bright, soft, vivid, and tasty samples.
The color of the broth of Samgyetang was measured using a spectrocolorimeter (JS555, Color Techno System Corporation, Japan), according to the methods of Aramwit et al. (2010). The color changes in the Samgyetang broth were monitored based on the CIE lightness (L*), redness (a*), and yellowness (b*). The color measurements of the broth were conducted after separating the solids with a 500-μm sieve. The color instrument was calibrated using a white ceramic reference plate (L*=98.59, a*=0.09, and b*=−0.37) and the visible reflectance spectra were obtained using a silicon photocell and a pulsed xenon lamp (Illuminant D65, 0° view angle). Color was measured in triplicate for each sample and treatment.
Turbidity of the broth was investigated using a spectrophotometer (V-650, Jasco, Japan) according to the methods of Kanno et al. (1998), with some modifications. Broth was separated from the solids using a 350-μm sieve and centrifuged at 3,000 g for 5 min (Gyrozen 416G, Gyrozen Co., Ltd., Korea) after heating samples in boiled water at 85°C for 15 min. The filtrate was then transferred to a cuvette before obtaining measurements. Broth turbidity was measured based on absorbance at 600 nm. The turbidity values are expressed as nephelometric turbidity unit (NTU).
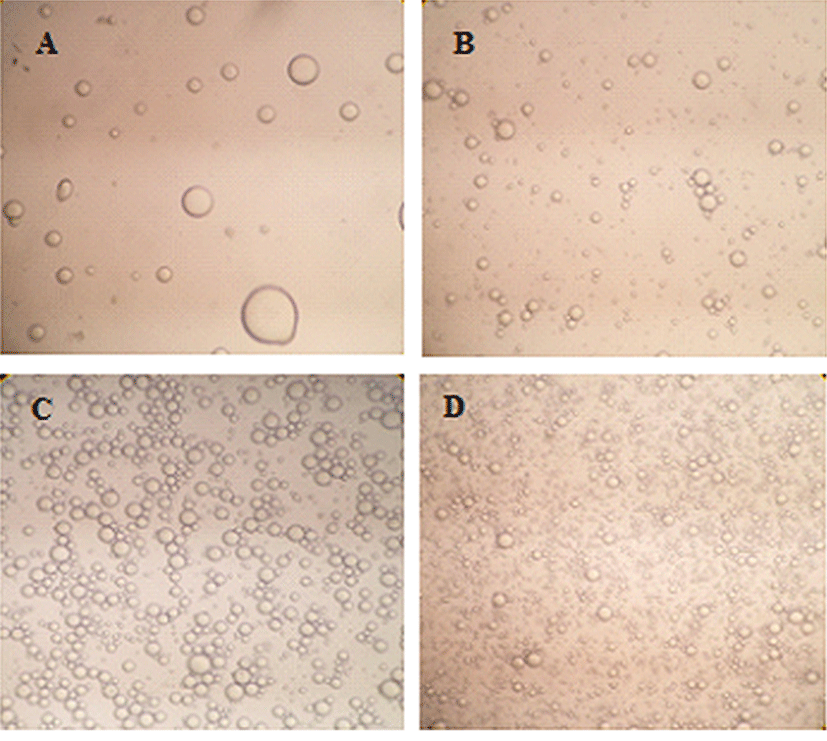
Following the methods of Chiewchan et al. (2006) with slight modifications, the analysis of fat droplets on the broth of Samgyetang was performed using an optical standard microscope (CH30, Olympus, Japan). Broth samples were obtained from a package of RTE Samgyetang and the solid parts (whole chicken meat, porridge, and ginseng-garlic-jujube-chestnut) were separated after samples were heating in boiled water at 85°C for 15 min (as per the cooking instructions indicated on the pack). One hundred milligrams of the broth solution was then placed into a 100-mL flask after filtering with a 500-μm sieve and left without applying physical force for 30 min before measurements were obtained. One milliliter of broth was collected with a graduated pipette (b78-400, Korea Ace Scientific Co., Korea) and then smeared onto an object glass and examined at 20× magnification. The microscopic fat droplets were photographed using a digital camera (ES10, Samsung, Korea).
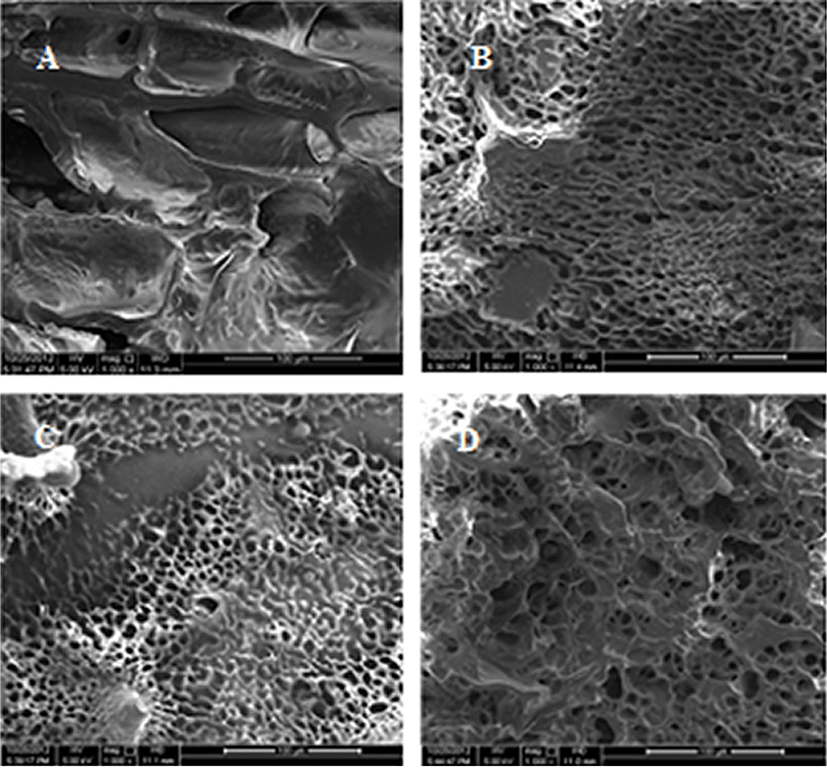
Scanning electron microscopy of porridge samples was performed using the methods described by Hu et al. (2011) with some modifications. The morphological changes in porridge were observed using a scanning electron microscope (SEM; Inspect F, FEI, Japan) at 5.0 kV. The porridge was freeze-dried by a freeze-drying machine (CleanVac, Hanil Science Industrial Co., Ltd., Korea). Each sample was cut using a surgical blade (Surgical Blade Stainless No. 11, Feather Safety Razor Co., Ltd., Czech) and rice cross-sections were observed. Each sample was attached to an SEM stub using double-sided carbon tape. The stub and sample were coated with a thin layer of silver (ca. 5 nm) for 3 min by a sputter coater (SPI-Module, SPI Supplies, USA). The samples were observed at 1,000× magnification and photographed.
A modified method of Korea Food and Drug Administration analysis (KFDA, 2008) was used to analyze the acidity of Samgyetang broth based on the level of potassium hydroxide (mg) that was required to neutralize the free acids in 1 mL of broth sample. After filtering with a 500-μm sieve, 5-10 mL of each sample was added to a 250-mL Erlenmeyer flask, and then mixed with 100 mL of ethanol: ether (1:2). The phenolphthalein solution was used as an indicator based on the color change to pale red by titrating 0.1 N ethanolic potassium hydroxide solutions. The pale red color was measured for 30 s in each sample. The acid values were then calculated using the following formula:
Acid value (mg/g) = (0.1 N KOH (mL) × 5.611) / Sample weight (g)
All data were analyzed by one-way analysis of variance to determine the effect of sucrose stearate and storage using the SPSS (Version SPSS 14, USA) statistical package. Comparisons among groups were carried out using Duncan’s multiple range tests to determine significance at p<0.05.
Results and Discussion
The lightness of broth and porridge is an important factor that affects quality and consumer interest in RTE Samgyetang. Consistent with this, Lawless and Heyman (2010) reported that the initial quality of the product is assessed by its color and appearance. Table 1 shows that the CIE L*, a*, and b* of the broth differed among samples with different concentrations of sucrose stearate. The lightness (CIE L*) values of the broth increased as the sucrose stearate concentration increased. The results shown in Table 1 were in accordance with the color characteristic scores shown in Table 2. The sensory color scores of the broth increased as the concentration of sucrose stearate increased from the beginning of the observational period (p<0.05).
a-dMean±SD in the same column with different superscripts are significantly different at p<0.05
A-EMean±SD in the same row with different superscripts are significantly different at p<0.05
1)Sucrose stearate concentration: 0% (C), 0.1% (T1), 0.2% (T2), 0.3% (T3) (w/v).
a-dMean±SD in the same column with different superscripts are significantly different at p<0.05
A-EMean±SD in the same row with different superscripts are significantly different at p<0.05
1)Sucrose stearate concentration: 0% (C), 0.1% (T1), 0.2% (T2), 0.3% (T3) (w/v).
Lightness is an important part of the subjective perception of color in food products (Piggot, 1984). The lightness (CIE L*) value for the broth of the treated samples increased as the sucrose stearate concentration increased from the beginning of the observation period, while the CIE a* and CIE b* values decreased (p<0.05). A decreasing tendency of CIE b* for the treated broth samples might indicate a reduced effect of the Maillard reaction. Kim et al. (2004) reported that an increment in b* values during the storage of rice gruel and cakes containing different levels of ginkgo nut powder results from the acceleration of the Maillard reaction between the protein and sugar contents in rice. The increased color characteristic scores indicated in Table 2 might reflect o/w emulsification, which results in a homogeneous color, for higher concentrations of sucrose stearate. Moreover, the rice components dissolved in broth might react with sucrose stearate, resulting in an increased broth lightness during storage.
Table 3 shows the sensory color scores of the porridge during storage at 25°C. The color scores of the RTE Samgyetang porridge increased as the concentration of sucrose stearate increased after 6 mon (p<0.05). These results were in agreement with a study by Lee et al. (1991), who showed that the use of sucrose stearate could increase the lightness of starch-based food products. Another previous study also showed that an emulsifier affects the lightness and quality of rice pasta (Lai, 2002). Although the addition of sucrose stearate showed a positive effect on the color characteristic scores of the broth and porridge, these scores decreased for all samples during storage.
a-dMean±SD in the same column with different superscripts are significantly different at p<0.05
A-EMean±SD in the same row with different superscripts are significantly different at p<0.05
1)Sucrose stearate concentration: 0% (C), 0.1% (T1), 0.2% (T2), 0.3% (T3) (w/v).
Table 2 shows the clarity scores for the broth samples during storage at 25°C, which decreased until mon 9 as the sucrose stearate concentration increased (p<0.05), and did not change significantly thereafter (p>0.05). The panelist perception of broth clarity was observed in addition to turbidity measurements. Turbidity is an important sensory characteristic that indicates how clear a food product appears (Lawless and Heyman, 2010). In this study, an inverse relationship between turbidity and clarity characteristic scores in the sensory analysis was observed. As shown in Tables 1 and 2, the turbidity values increased as the sucrose stearate concentration increased, while the clarity scores decreased for both the broth and porridge until mon 9 (p<0.05) and did not change significantly thereafter (p>0.05). Thus, the decrease in clarity scores for the treated samples may be related to the low consumer acceptance of Samgyetang broth based on appearance, which became more turbid as the sucrose stearate concentration increased. It was evident, however, that the control group had the highest scores during storage. This observation showed the o/w emulsification in broth samples with a higher concentration of sucrose stearate had lower clarity characteristic scores. These results were in agreement with those of a study by Hoffmann and Reger (2014), who showed that emulsifier addition during milk processing could increase milk turbidity.
Furthermore, the clarity scores of the broth for all samples decreased over time during storage (p<0.05). This might be explained by the meat debris and other ingredients in the broth, which reduce clarity over time. We observed that debris from meat and porridge in all broth samples increased during an extended storage period. This finding was in agreement with the results of a study by Jang and Lee (2012), who showed that deterioration on ginseng chicken porridge during storage is caused by the weakening of boiled rice porridge, softening of chicken slices, and generation of off-odors and off-flavors.
Table 2 shows that scores for fat droplet size in the broth increased as the sucrose stearate concentration increased (p<0.05), but decreased for all samples during storage (p<0.05). Drewnowski et al. (1989) reported that panelists choose lower fat levels in liquid foods than in solid foods based on a sensory evaluation. The excessive fat droplets with large sizes in the broth were disliked by the panelists owing to their perception that these broths were unhealthy and associated with various diseases. Consistent with this, Melanson et al. (2009) found that overconsumption of fat and sugar was associated with obesity, high blood cholesterol, and coronary heart diseases.
In this study, the emulsification of fat droplets in the broth by the addition of sucrose stearate resulted in small and dispersed fat droplets. As shown in Fig. 2, the samples treated with higher concentrations of sucrose stearate had smaller fat droplets than samples treated with relatively less sucrose stearate. This result was in agreement with a study by Akoh and Swanson (1994), who showed that the addition of sucrose stearate as a carbohydrate polyester emulsifies and reduces fat droplets in food products. Neta et al. (2012) also reported that sugar ester has the ability to produce a stable emulsion of fresh coconut milk.
As shown in Table 2, the taste scores for the broth decreased as the sucrose stearate concentration increased during storage (p<0.05). The taste scores for the broth decreased because the panelists detected a slightly sour taste, which was more pronounced for samples with a higher concentration of sucrose stearate. Table 1 shows that the acid values of the broth increased with higher addition of sucrose stearate, i.e., 0.40-0.55 (C); 1.61-1.75 (T1); 1.83-1.98 (T2); 1.92-2.04 (T3). The sour taste that occurs with the extension of storage time for Samgyetang with sucrose stearate might be the result of the hydrolysis reaction of sucrose stearate during storage.
Johanningsmeiner et al. (2005) reported that hydrogen ions are responsible for sour taste. A high percentage of stearic acid (approx. 70% stearic acid) in sucrose stearate could indicate hydrolyzed stearic acid in the broth, which was responsible for the perceived sour taste. Moreover, the taste scores for the porridge samples treated with sucrose stearate were lower than those of the control group (p<0.05), but no significant differences between low and high concentrations of sucrose stearate were examined (p>0.05) (Table 3). These observations might indicate that sucrose stearate accumulated more in the broth than in the porridge as it was added during sample preparation. The porridge part of Samgyetang was affected less by sucrose stearate because it was covered by the chicken abdomen, which reduced the possibility for the porridge to contact sucrose stearate in the broth.
Generally, the sour taste increases as the pH of food decreases (Sowalsky and Noble, 1998). However, in this study, the sensory scores for broth taste decreased as the concentration of sucrose stearate increased throughout the study (p<0.05). Based on this observation, the scores for taste decreased owing to the addition of high concentrations of sucrose stearate, rather a decrease in pH.
We also measured the acid levels to determine the source of the sour taste and to measure the correlation between the sour taste scores and acid levels in the broth (Table 1). The acid values of the broth increased as the taste scores decreased for the treated samples, indicating that an increase in the hydrolysis of sucrose stearate occurred, resulting in an acidic taste. The acid values of the treated samples ranged from 1.61-2.04 during storage. These results were higher than those reported in a prior study conducted by Akoh and Swanson (1994), which showed that the acidity of hardened palm oil without additives ranged from 0.16-1.24. However, additional studies are needed to determine the mechanisms underlying the sour taste during the storage of Samgyetang with supplemental sucrose stearate.
As shown in Table 3, the softness scores for the treated porridge samples were higher than those of the control group from mon 3 onward, even though no significant differences were observed among treatment groups (p<0.05). The softness scores of the porridge for all samples also decreased as the storage time increased. A decrease in the softness scores as storage time progressed was consistent with the results of Jang and Lee (2012). They performed a sensory evaluation of the texture of ginseng chicken porridge, which decreased from 9.0 to 4.4 after 7 mon of storage. The study also showed that after a prolonged storage period, the rice porridge texture became weak. In this study, the immersion of rice porridge in the broth during storage might promote weakening during storage.
As reported by Farhat et al. (2000), the texture of waxy maize starch extrudates becomes weak and is affected by temperature and water content. The SEM images of the rice porridge illustrated in Fig. 3 are correlated with the softness scores of the porridge shown in Table 3. According to the figures, smaller rice porridge pores are formed in the treated samples than in the control group. The sucrose stearate might have induced the increase in porosity of rice porridge. Turabi et al. (2008) reported that the addition of an emulsifier to rice cakes has the ability to increase the volume and porosity, which results in softer products. Thus, an increased number of small pores in the rice porridge of Samgyetang might improve its softness. Consistent with this, Gomes-Ruffi et al. (2012) showed that the addition of an emulsifier reduces the firmness of pan bread during storage.
The sensory characteristics of rice porridge are also related to the gelatinization and retrogradation processes of rice starch (Deng et al., 2012). Another factor that might increase the softness scores for Samgyetang porridge is the ability of the emulsifier to retard the retrogradation of rice porridge. Retrogradation is the main cause of the hardening of rice porridge (Zhang et al., 2014). Based on this study, the treated samples had higher softness scores than that of the control group. This might indicate that the retarding of the retrogradation process in the porridge led to higher softness scores. Consistent with this, Liu et al. (2012) reported that an emulsifier can retard the retrogradation process of starch-based products.
As shown in Table 3, the vividness scores for porridge during storage at 25°C were higher in the treated samples than the control group beginning at mon 3 (p<0.05), even though no significant differences were observed among treatment groups (p>0.05). The panelists observed more vivid and appealing rice porridge for the treated samples than the control group. These appearances were in accordance with those reported by Lai (2002), who showed that an emulsifier that has the ability to emulsify oil in water food-based materials can maintain porridge characteristics, such as color, taste, and shape. However, in this study, the vividness of all the samples decreased during storage (p<0.05).
Conclusion
In conclusion, sucrose stearate could be used as a GRAS additive to improve the overall sensory characteristics of RTE Samgyetang broth and porridge during storage, except for the clarity of the broth and the taste of both parts. However, a disadvantage of the addition of sucrose stearate to Samgyetang is the occurrence of a slightly sour taste during storage, for which the reason is not yet known. An exploration of other types of emulsifier that can be used to overcome the shortcomings related to the production of Samgyetang or similar soup products containing oil or fat is necessary.