


Introduction
Owing to its cost-effectiveness and short raising term, chicken meat not only has a high economic benefit but also is in high global consumer demand. Chicken meat also has some health benefits with lower fat and cholesterol contents but higher protein content than red meats (Jaturasitha et al., 2008; Rosen et al., 1994). In Korea, chicken meat is cooked with various methods such as roasted, as a steamed dish, and boiled. Samgyetang is a popular traditional Korean chicken soup that is typically consumed to supply nutrients and energy lost through large amounts of sweat in summer (Kim et al., 2016; Suzuki and Rhim, 2000). Several components deemed to have medicinal value are stuffed into a chicken, including ginseng, garlic, chestnut, and rice, and then the chicken is broiled in a broth for a few tens of minutes. Sodium chloride (NaCl), or salt, is also typically added to samgyetang as a seasoning for the meat broth (Kim et al., 2018). Several studies about the health benefits of the main components of samgyetang have been reported (Park et al., 2003; Seong et al., 2010). However, there is scant information about the effect of salt on the quality traits of the chicken meat used in samgyetang.
NaCl is added to various meats and meat products, which is considered to be a necessary ingredient with an important role in maintaining the water holding capacity (WHC), osmotic pressure, water activity, and sensory characteristics, and also has a preservative effect (Choi et al., 2014). NaCl is dissociated into the Na+ cation and Cl– anion when dissolved in water, which have several activities that affect the quality and taste of meat and meat products, including improvement of flavor, inhibition of microorganism growth, and extraction of salt-soluble proteins (Kim et al., 2018; Theno et al., 1978; Xiong et al., 2000). In addition, phosphate is sometimes used in meat and meat products to enhance WHC and ionic strength of meat protein, and reduce cooking loss (Xiong et al., 2000).
Long periods heating time at high temperature might negatively affect the quality traits of chicken by increasing the toughness of myofibrillar protein in the muscle tissue (Becker et al., 2016). In general, samgyetang is cooked in broth for long heating periods at high temperature. Thus, introducing a curing process with proper permeated salt to the chicken prior to cooking could improve the quality characteristics of the meat (Puolanne and Halonen, 2010).
To test this hypothesis, the aim of this study was to determine the effects of curing chicken with various salt concentrations and with or without the addition of phosphate on the quality characteristics of chicken used for samgyetang.
Materials and Methods
Fresh broiler chicken (aged 5 wk, about 650 g) was obtained from a local market (Harim, Iksan, Korea). For preparation of broth, The NaCl (Hanju salt, Hanju Co., Daegu, Korea) and the sodium phosphate (Sodium phosphate, ES Food, Gunpo, Korea) were used and fourteen broths were prepared. The NaCl concentration of the broth was adjusted to 0% (control), 0.5%, 1.0%, 1.5%, 2.0%, 2.5%, and 3.0% (w/v), and the sodium polyphosphate concentration of the broth was adjusted to 0% and 0.2% (w/v) (NP and PH). Overall, for prevention of tangle between each chicken while tumbling, one chicken was packed in a one polyethylene bag with 40% broth of the weight of the chicken. After tumbling (MGH-20, Vakona GmbH, Stuttgart, Germany) the whole bag for 1 h at 4°C and 25 rpm under vacuum condition (0.75 bar), stored for 12 h at 4°C. After unpacked, 100 g rice-jujube-garlic-ginseng was stuffed into cavity of chicken. Each treatment group was cooked at 100°C for 1 h in a water bath (JSSB-30T, JS Research Inc., Gongju, Korea). All tests was conducted after cooling the chicken meat at room temperature (20°C) for 1 h, and both side chicken breast were obtained and used in experiments. Meat taken at the same location was used in the same experiment. Three chickens were used in each treatment and 21 chickens were used in a batch. The procedure was performed in triplicate for each sample.
The proximate composition (moisture, protein, fat, and ash) of the chicken breast meat from each treatment was measured according to the AOAC (2000) method. The drying method was used for measuring the moisture content of samples in a drying oven (HSC-150/300, MS I&C, Seoul, Korea) at 105°C. The Kjeldahl method (2020, Foss, Hillerød, Denmark) was conducted to measure the protein contents of samples, and Soxhlet methods (E-816, BUCHI Labortechnik AG, Essen, Germany) were used to determine the fat contents. Ash content was measured in Muffle’s furnace (550-126, Fisher Scientific, Hampton, NH, USA).
Each sample was weighed to 5 g and homogenized with 20 mL of distilled water. The pH of each homogenate was then measured by a pH meter (Model 340 pH meter, Mettler-Toledo GmbH, Greifensee, Switzerland) calibrated by buffer of pH 4.0, 7.0, and 10.0.
After homogenizing a 5-g sample with 45 mL of distilled water, the solution was filtered by Whatman No. 1 filter paper. The salinity of the filtered solution was measured by a refractometer (PAL-03S, ATAGO Co., Ltd., Tokyo, Japan).
The WHC of each sample was measured by a modified method of Grau and Hamm (1953). In brief, 300 mg of a sample was placed on Whatman No. 2 filter paper and then pressed for 3 min with constant pressure by a binate plexiglass plate. Each outer and inner section was measured by a planimeter (Planix 7, Tamaya Technics Inc., Tokyo, Japan). The Outer section was considered as the exuded moisture and the inner section was considered the meat. The ratio between the inner and outer section was used as the WHC (%) value.
The thiobarbituric acid reactive substances (TBARS) value is considered to be an indicator of lipid oxidation, which was measured according to the method of Tarladgis et al. (1960). After homogenizing 10-g samples with 97.5 mL of distilled water and 0.2 mL of 0.3% butylated hydroxytoluene (Sigma-Aldrich, St. Louis, MO, USA) in methanol (Daejung Co., Goryeong, Korea), the homogenate was distilled with 4 N HCl (Samchun Co., Seoul, Korea) and an anti-forming agent (KMK-73, Shin-Etsu Silicone Co., Ltd., Seoul, Korea). A mixture of 5 mL of distillate and 0.02 M thiobarbituric acid (Sigma-Aldrich) in 90% acetic acid was heated for 35 min at 100°C. After cooling by tap water (15°C), the absorbance of the mixture was measured by an ultraviolet-visible spectrophotometer (Optizen 2120 UV plus, Mecasys Co. Ltd., Seoul, Korea) at 538 nm.
The inner surface color of chicken breast meat was determined using a colorimeter (CR-410, Minolta, Japan; illuminate C). Lightness, redness, and yellowness were expressed as CIE L*, CIE a*, and CIE b*, respectively. Conditions of the calibration white plate were as follows: observer 2°, CIE L*=97.83, CIE a*= −0.43, CIE b*=1.98. Six measurements were recorded for each sample.
The weight of each sample was compared before and after cooking at 100°C for 1 h and then cooling at 20°C for 1 h. The weight loss of the sample in the uncooked and cooked state was expressed as percentage and considered to reflect the cooking loss.
Each sample was cut into 2.5×2.5×2.5 cm3 sections, which were used for measuring the shear force of the chicken breast meat in samgyetang. Shear force was measured by a texture analysis instrument (TA-XTplus, Stable Micro Systems, Surrey, England). A Warner-Bratzler blade was used for texture analysis and the pre-test speed, test speed, post-test speed, distance, and trigger force were 5 mm/s, 5 mm/s, 10 mm/s, 30 mm, and 5 g, respectively.
A sensory panel consisting of 12 members belonging to the Food Processing Research Center of Korea Food Research Institute was recruited for sensory evaluation of the samples. The panel members trained for 3 d, for 30 min a day, using sensory test items such as appearance, flavor, salty, tenderness, juiciness, and overall acceptability with screening process, and did not eat any sharp-tasting food for 3 h before the sensory evaluation. For the sensory evaluation, each chicken breast meat was cut into 2.5×2.5×2.5 cm3 cubes and six samples were served in a given section, which were given a random three-digit number. Panelists evaluated the samples under fluorescence light and rinsed their mouths with lukewarm water between samples. The following sensory items were scored using a 9-point descriptive scale: appearance (1=extremely undesirable, 9=extremely desirable), flavor (1=extremely undesirable, 9=extremely desirable), salty taste (1=extremely salty, 9=extremely bland), tenderness (1=extremely tough, 9=extremely tender), juiciness (1=extremely dry, 9=extremely moist), and overall acceptability (1=extremely undesirable, 9=extremely desirable).
To compare the results statistically, one-way analysis of variance, an independent two sample t-test, and general linear model procedure were performed using the SPSS statistical software program (SPSS Ver. 20.0, SPSS Inc., Chicago, IL, USA). The salt concentration of the broth and addition of phosphate were considered as the main effects in the model for assessment. Duncan’s multiple range test was performed, with a p-value of 0.05 or less indicating significant differences between treatments. Correlation coefficients analysis between variables was performed using SPSS Statistical software program.
Results and Discussion
The proximate compositions of samgyetang samples were shown in Table 1. In NP group, the moisture content of the control and 0.5% was the lowest (p<0.05). With increasing level of salt in the broth, the moisture content of chicken meat of samgyetang increased except for 3.0%; when salt concentration of broth were 2.0% or 2.5%, breast showed the highest moisture contents (p<0.05). In general, salt and phosphate increase the water holding capacity (WHC) of meat muscle (Theno et al., 1978). In PH group, there were no significant difference in moisture content between 1.0% and 3.0% (p>0.05), even control was not significant different with treatment except for 1% (p>0.05). Therefore, adding phosphate might be a useful way to enhance the moisture content of samgyetang meat when using low salt concentration brine. The protein content of control was the highest (p<0.05) and salt concentration affected protein content of samples. This phenomenon was due to lower moisture content than other treatment. Neither the salt concentration nor the addition of phosphate influenced the fat content of samples (p>0.05) and the tendency of ash content was increased by salt concentration; although there were no significant different up to 1.0% in NP group, 1.5% had higher value than 1.0% and 3.0% had higher value than 1.5% (p<0.05). There was no critical difference between treatment in PH group, however treatment added salt had higher value in ash content than control (p<0.05) except for 0.5 and 2.0% (p>0.05). Increased ash content might be due to the increased salt concentration.
a–e Means within a row with different letters are significantly different by salt concentration of broth (p<0.05).
* Means within a column are significant different between NP and PH with same salt concentration (* p<0.05).
1) Control, boiled with broth of 0.0% salt concentration; 0.5%, boiled with broth of 0.5% salt concentration; 1.0%, boiled with broth of 1.0% salt concentration; 1.5%, boiled with broth of 1.5% salt concentration; 2.0%, boiled with broth of 2.0% salt concentration; 2.5%, boiled with broth of 2.5% salt concentration; 3.0%, boiled with broth of 3.0% salt concentration.
The pH, salinity, WHC, and TBARS value of samgyetang under different chicken treatments are summarized Table 2. The pH value of samples without phosphate added was generally lower than those of samples with phosphate, and the pH value of samples processed with a low salt concentration was higher than those of samples cooked in broth of higher salt concentrations (p<0.05). This tendency was likely due to a salt that dissociate hydrophilic molecules from the meat protein and phosphate which are typically used for this purpose as acidifying agents in meat products (Kijowski and Mast, 1988, Puolanne and Halonen, 2010).
a–f Means within a row with different letters are significantly different by salt concentration of broth (p<0.05).
* Means within a column are significant different between NP and PH with same salt concentration (* p<0.05, ** p<0.01, *** p<0.001).
1) Control, boiled with broth of 0.0% salt concentration; 0.5%, boiled with broth of 0.5% salt concentration; 1.0%, boiled with broth of 1.0% salt concentration; 1.5%, boiled with broth of 1.5% salt concentration; 2.0%, boiled with broth of 2.0% salt concentration; 2.5%, boiled with broth of 2.5% salt concentration; 3.0%, boiled with broth of 3.0% salt concentration.
As expected, the salinity of samgyetang was increased with increasing salt concentrations (p<0.05). At the 3.0% salt concentration, the salinity of samgyetang was the highest regardless of the addition phosphate (p<0.05). Salt concentration of the broth had a significant effect on the WHC of the chicken (p<0.05). In a concentration-dependent manner: the highest WHC value as detected with the 3.0% salt concentration and the lowest was detected with no salt. Moreover, samgyetang with phosphate added had a higher WHC than that without phosphate in all cases, except for under the treatment of 1.0% salt. Moreover, the mean difference in WHC with and without phosphate increased when the salt concentration of the broth increased; with a 0% salt concentration, the mean value difference was 1.91, whereas that at a 3.0% salt concentration, was 14.72. This effect is likely due to the salt ions, Na+ and Cl–, reaching the sarcomeres to ultimately increase the ionic strength between the myofibrillars (Puolanne and Halonen, 2010). Therefore, the increase of salinity of samgyetang meat affected WHC of meat positively.
Thiobarbiutric acid reactive substance (TBARS) has been used as lipid oxidation indicator (Kim et al., 2018). The higher salt concentration of brine led to the higher TBARS value of samgyetang; 3.0% salt concentration had the highest TBARS value and control had the lowest TBARS value (p<0.05) in both NP and PH group. In NP, TBARS value increased steadily from 0.5% and more. Adding salt in meat product is one of main reasons of lipid oxidation of meat product (Mariutti and Bragagnolo, 2017). This disadvantage might be prevented by phosphate. According to Cheng and Ockerman (2003), phosphate increased oxidation stability in tumbled meat product; when added higher phosphate in meat product, TBARS value was lower. This enhanced oxidation stability phenomenon was also shown in this study. In PH, the control and 0.5% to 1.5% treatment showed similar TBARS value (p>0.05).
Table 3 shows the effect of salt concentration and phosphate addition on CIE L* (lightness), CIE a* (redness), and CIE b* (yellowness) value of samgyetang meat. Lightness had no difference regardless of salt concentration and phosphate (p>0.05) and other value (CIE a* and CIE b*) had significant difference between some treatment (p<0.05). According to Kim et al. (2018), marinated samgyetang with salt had lower lightness than non-marinated samgyetang and redness of marinated sample was higher than that of non-marinated sample. In this study, there were no specific trend for salt and phosphate. Therefore, although there were some effect by addition of salt, its concentration may have not specific effect on color of samgyetang meat. Ahn and Maurer (1989) reported that adding salt decrease lightness and increase redness of turkey meat. However, these tendencies were not shown in this study.
a–d Means within a row with different letters are significantly different by salt concentration of broth (p<0.05).
* Means within a column are significant different between NP and PH with same salt concentration (* p<0.05, ** p<0.01, *** p<0.001).
1) Control, boiled with broth of 0.0% salt concentration; 0.5%, boiled with broth of 0.5% salt concentration; 1.0%, boiled with broth of 1.0% salt concentration; 1.5%, boiled with broth of 1.5% salt concentration; 2.0%, boiled with broth of 2.0% salt concentration; 2.5%, boiled with broth of 2.5% salt concentration; 3.0%, boiled with broth of 3.0% salt concentration.
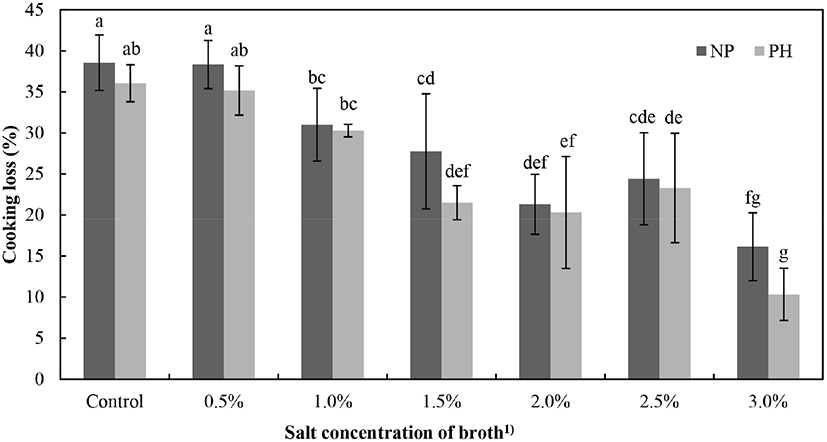
Fig. 1 shows cooking loss of samgyetang by salt concentration and adding phosphate. Salt concentration (p<0.001) and adding phosphate (p<0.05) had significant effect on cooking loss (Table 4). In NP, 3.0% salt concentration had the lowest cooking loss and control and 0.5% salt concentration had the highest value in cooking loss (p<0.05). In PH, cooking loss of control was not significant different with 1.0% salt concentration. Phosphate and salt affected cooking loss positively of meat product (Kijowski and Mast, 1988). This phenomenon can be explained by changed ionic strength between meat proteins. Due to adding salt and phosphate, ionic strength was changed and this change extend the spare space that can stay water, fat, or other components of meat product stably (Trout and Schmidt, 1983).
Shear forces of samgyetang meat are presented in Fig. 2. Both salt concentration and phosphate had critical effect on shear force of chicken meat of samgyetang (p<0.001) (Table 4). When compared with/without phosphate, significant differences were shown in all salt concentration; when added phosphate, shear forces were decreased (p<0.05) and the higher salt concentration had the lower shear force value (p<0.05). This tendency was in line with cooking loss and tendency of WHC was in reverse with shear force. Shear force has high correlation with WHC. The higher WHC of meat affect the lower shear force (Choi et al., 2016). Detienne and Wicker (1999) reported that sodium chloride injected pork loin was tender than not injected pork loin and phosphate addition affected to have a lower shear force.
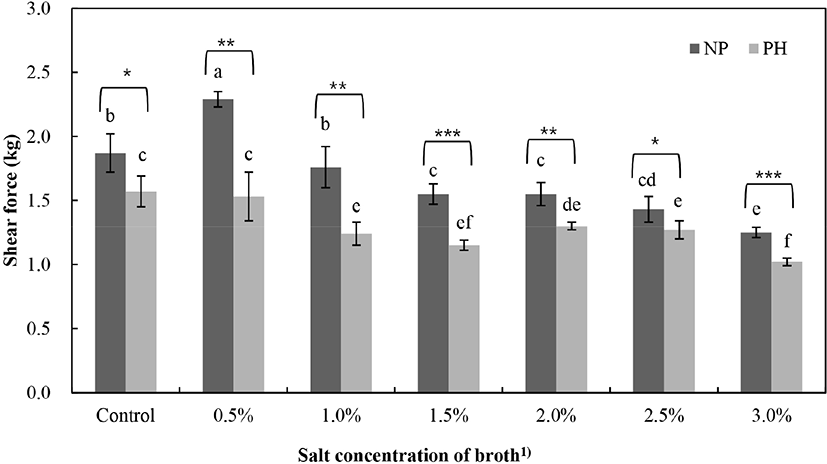
Table 5 shows the effect of salt concentration and phosphate on sensory evaluation of samgyetang. In appearance, there were no significant different by salt concentration and with/without phosphate (p>0.05). In NP group, 1.5% to 2.5% had the highest flavor scores and adding salt had a positive effect on flavor (p<0.05). Juiciness scores of samples were higher when adding salt above 1.0% (p<0.05) in only NP group and tenderness scores also was higher than control when adding salt (p<0.05) in both NP and PH group. This tendency is consistent with the investigated data such as WHC, salinity, and shear force. 2.0% salt concentration of broth had the highest scores for flavor, tenderness, juiciness, and overall acceptability in NP group. Although salt concentration and addition of phosphate had critical effect on sensory, the excessive addition of salt led to decrease the mean of sensory scores of samgyetang. Furthermore, flavor, salty taste, tenderness, and juiciness were affected by salt concentration and overall acceptability of samgyetang was affected by both salt concentration and phosphate.
The correlation coefficients of main effects (salt concentration and with/without phosphate) and their interactions on quality characteristics of samgyetang are shown in Table 4. There were highly significant correlation to effect of salt concentration on moisture (p<0.001), ash (p<0.001), salinity (p<0.001), WHC (p<0.05), TBARS (p<0.001), CIE b* (p<0.001), cooking loss (p<0.001), shear force (p<0.001), flavour (p<0.001), salty taste (p<0.001), tenderness (p<0.001), juiciness (p<0.001), and overall acceptability (p<0.001). There were highly significant correlation of phosphate effect on pH (p<0.001), WHC (p<0.05), TBARS (p<0.001), CIE a* (p<0.01), CIE b* (p<0.01), cooking loss (p<0.05), shear force (p<0.001), and overall acceptability (p<0.001). In addition, there were highly significant correlation of interaction between salt concentration and phosphate on pH (p<0.001), WHC (p<0.05), TBARS (p<0.001), CIE a* (p<0.01), CIE b* (p<0.01), shear force (p<0.001), and salty taste (p<0.01). Thus, the salt concentration and phosphate addition to samgyetang broth affected the quality of meat products.
a–c Means within a row with different letters are significantly different by salt concentration of broth (p<0.05).
* Means within a column are significant different between NP and PH with same salt concentration (*p<0.05, **p<0.01).
1) Control, boiled with broth of 0.0% salt concentration; 0.5%, boiled with broth of 0.5% salt concentration; 1.0%, boiled with broth of 1.0% salt concentration; 1.5%, boiled with broth of 1.5% salt concentration; 2.0%, boiled with broth of 2.0% salt concentration; 2.5%, boiled with broth of 2.5% salt concentration; 3.0%, boiled with broth of 3.0% salt concentration.
2) Appearance (1, extremely undesirable; 9, extremely desirable), flavor (1, extremely undesirable; 9, extremely desirable), salty taste (1, extremely salty; 9, extremely bland), tenderness (1, extremely tough; 9, extremely tender), juiciness (1, extremely dry; 9, extremely moist), overall acceptability (1, extremely undesirable; 9, extremely desirable).
Conclusion
This study was conducted to investigate the effect of salt concentration and phosphate on quality characteristics of chicken meat in samgyetang. Salt concentration of broth had significant effect on moisture content, ash, pH, salinity, WHC, lipid oxidation, cooking loss, shear force, and sensory. Phosphate had significant effect on pH, WHC, lipid oxidation, color, cooking loss, shear force, and overall acceptability. There were different results by salt concentration and phosphate. However, proper salt concentration and adding phosphate have to be found to get best condition of samgyetang meat. In this study, Although 3% salt concentration had the highest value in WHC and the lowest value in cooking loss and shear force, excessive salt concentration led to lipid oxidation and get lower sensory scores on flavor. Therefore, compared to other measurement, salt concentration of broth that got the highest sensory scores is considered to be 2%.