


Introduction
The shelf-life of foods is the maximum possible period from the date of manufacture to sale. Physicochemical and microbiological quality changes in the food during the storage period affect the value of a product, so it is very important to manufacturers and consumers to be able to predict how long quality will be preserved under specific conditions (Cho et al., 1993).
There are two ways to determine the expiration date of a food product, the accelerated shelf-life test (ASLT) and an actual experiment. Actual experimentation is the principal method used to set an accurate expiration date, but it requires a long experimental time and relatively high costs in cases where products have shelf-lives of 3 mon or more (Park et al., 2014). The accelerated shelf-life test (ASLT) makes it possible to measure shelf-life in a shorter period of time using harsher conditions, so it is used much more frequently than actual experiments to predict the expiration dates of food economically (Kim et al., 2008). There are several methods associated with the ASLT, such as temperature multiplication methods, oxygen pressure multiplication methods, moisture multiplication methods, and mixing methods (Lee et al., 1995; Lee et al., 1999; Han et al., 2005).
The ASLT with temperature is carried out using the effect of temperature on the decay rate of foods, storing samples at 3 or more temperatures, measuring indicators of quality periodically, calculating an equation by plugging the results of experiments at different temperatures into the Arrhenius equation, and then predicting the shelf-life of samples. This method is efficient in economic aspects, such as time and financial cost, especially in cases of products that have shelf-lives greater than 3 mon. It is known to be very accurate when temperature is used as a single variable (Kim et al., 2008).
As the economy has improved and people spend more time enjoying cultural life nowadays, food service industries have become more upscale and diverse. The coffee beverage sector is growing very fast, and domestic coffee beverage consumption in present-day Korea has been rising sharply (Kim et al., 2013). The palatability of coffee has been increasing, and a number of milk beverages with coffee are being produced and sold on the market. In this study, the shelf-life of a milk beverage supplemented with coffee was predicted using the accelerated test with the Arrhenius equation, which is commonly used to predict shelf-life.
Materials and Methods
A milk beverage supplemented with coffee that is currently on the market was provided by Seoul F&B Co. (Korea). It is composed of 30% raw milk, 28% coffee extract, 29% purified water, 6% sucrose, and 0.03% emulsifier. Each sample was stored in an incubator set to a different temperature (10, 20 and 30°C) to perform the accelerated test.
To measure the peroxide value of each sample, lipid extraction was performed according to ISO Standard 14156: 2001 (International Organization for Standardization, 2001). One gram of extracted lipid was melted in 25 mL of acetic acid (Daejung Chemicals & Metals Co., Ltd.) and chloroform (Daejung Chemicals & Metals Co., Ltd.) (3:2). Then, the samples were left in a dark room after being mixed slightly with 1 mL of a saturated solution of potassium iodide (Junsei Chemical Co., Ltd, Japan). After admixing strongly with 30 mL of water, 0.01 N sodium thiosulfate (Daejung Chemicals & Metals Co., Ltd.) was titrated using 1 mL of a starch solution (Yakuri Pure Chemicals Co., Ltd, Kyoto, Japan) as an indicator.
Where a is the amount of 0.01 N sodium thiosulfate (mL) used in the sample test, b is the amount of 0.01 N sodium thiosulfate used in the blank test, and f is the titer of 0.01 N sodium thiosulfate.
To analyze the microbial content of samples stored at 10, 20, and 30°C for 8 wk, 1 mL of each sample was diluted 10-fold with 0.1% peptone solution (Becton, Dickinson and Company, USA). Total aerobic bacteria were counted on 3M PetrifilmTM aerobic count plates (3M Health Care, USA) that were incubated for 48 h at 35°C. E. coli and coliform were counted on 3M PetrifilmTME. coli and coliform count plates (3M Health Care, USA) that were incubated for 24 h at 35°C. Yeast and mold were counted on 3M PetrifilmTM yeast and mold count plates (3M Health Care, USA) that were incubated for 5 d at 25°C. To enumerate thermophiles, the samples were left in an 80°C water bath for 15 min, and assessed for total aerobic bacteria, E. coli, yeast, and mold. Then, red colonies created after incubation were counted and multiplied by the dilution rate.
The amount of caffeine in samples was measured using HPLC (LC-20A, Shimadzu Co., Japan) with a Luna C18 column (10 μm, 250 × 4.6 mm, Phenomenex, USA). Methanol (Fisher Scientific Korea LTD., Korea), acetic acid (Daejung Chemicals & Metals Co., Ltd.), and water (Fisher Scientific Korea Ltd.) were used as mobile phases (20:1:79) and compounds obtained from the column were analyzed at a wavelength of 280 nm. The column was kept in a column oven at 35°C and a flow rate of 1.0 mL per min to achieve optimum resolution of caffeine. One gram of each sample diluted in 100 mL of water was filtered with a 0.45 μm syringe filter (Adavantec, Japan), and then the solution containing the sample was used to measure the caffeine content. The caffeine content in each sample was quantified by diluting authentic caffeine standard (Sigma, USA) in distilled water at a variety of concentrations to make a standard curve.
A trained sensory panel of 10 researchers at the Program of Animal products and Food science, Kangwon National University evaluated the milk beverage supplemented with coffee once a week over an 8 wk period. The sensory panel consisted of 5 women and 5 men educated in how to evaluate and describe the quality and taste of the sample beverage. Sensory analysis attributes were color, body of coffee, aroma flavor, aftertaste, sweetness, sourness, bitterness, and overall acceptance; the qualities were scored using a scale ranging from 1 (very slight perception) to 5 (very intense perception).
To predict the shelf-life of the milk beverage supplemented with coffee, a slope, an intercept, and a correlation coefficient were calculated based on the Arrhenius equation through linear regression analysis of PV by accelerating temperature (10, 20, and 30°C).
In most cases, deterioration of the quality of foods follows a zero-order of a first-order reaction formula, indicated with the following numerical expression:
Where A is the quality measurement at time t, A0 is the measurement at time t0, n is the order of the reaction, t is the reaction time (wk), and k is a constant; a zero-order reaction Eq. (2) was derived from Eq. (1), then Eq. (3) was obtained by integrating the zero-order reaction Eq. (2).
Also, the first-order reaction was analyzed with Eq. (4), below, from Eq. (1), then Eq. (5) was obtained by integrating the first-order reaction Eq. (4).
Eq. (6) was derived by taking the natural logarithm (ln) of Eq. (5).
The Arrhenius equation, which is universally used to determine activation energy, was used to measure the temperature dependence of quality deterioration in the samples. Eq. (7) was revealed by the Arrhenius equation.
Eq. (8) was obtained by taking the natural logarithm of Eq. (7).
Where T is the absolute temperature, k is the reaction constant at temperature T, R is the gas constant (1.987 Kcal/mol), Ea is the activation energy, S is the slope, and lnA (I) is the intercept.
Meanwhile, the rate of deterioration of product quality was revealed with the below equations using the prior equations and formulas.
Here, t is the storage period, A0 is the quality index at the time of initial storage, At is the quality index at a specific point in time (t), and kt is the reaction constant at a specific point in time.
Results and Discussion
Rancidity of edible oils and fatty foods caused by lipid oxidation is a serious problem in some sectors of the industry. Because of the unfortunate consequences of lipid oxidation in foods, it is critical that information about the oxidative stability of susceptible food items be obtained before they are marketed (Ragnarsson & Labuza, 1977).
An increase in temperature is the most common and effective means of accelerating oxidation. The rate of the reaction is exponentially related to the temperature; thus, shelf-life decreases logarithmically with increasing temperature. In single-component lipid systems, oxidation can be represented by the following equation:
Where RH = polyunsaturated lipid substrate; O2 = oxygen; ROOH = lipid hydroperoxide (primary product), and K = overall rate constant for ROOH production.
According to the result of lipid oxidation, it is likely that the PV of 100% lipids extracted from milk beverages stored at each temperature (10, 20, and 30°C) will increase gradually with increasing temperature and storage period (data not shown). However, PV was converted into the concentration of lipid oxidation in 2.3% of lipids in the samples (Table 1). The time point at which 20-40 meq/kg of the PV is reached is generally considered as the starting point of fat rancidity in the case of animal lipids; however, in fresh lipids, it is the time point at which 10 meq/kg of the PV is reached.
Foods have a high possibility of supporting microorganisms as time goes by; pathogenic microbes might be especially harmful to humans. Although sterilization and pasteurization are performed on food products, populations of microorganisms can be revived and grow from spores over time, so a bacterial indicator is very important in determining the end of shelf-life (Korea Food and Drug Administration, 2011).
We measured the general and thermoduric microbial count (total aerobic bacteria, E. coli, yeast, and mold) during the storage period (8 wk) and found that none of the microorganisms were detected over the course of 8 wk, which means that sterilization of the beverages was performed properly when they were first manufactured (Table 2, 3).
1N.D: Not detected.
1N.D: Not detected.
Caffeine stimulates the central nervous system and can improve alertness and reaction time and mitigate tiredness (Griffiths and Grifiths, 2005). However, higher doses of caffeine (over 200 mg/d) can also cause health problems, including anxiety, increase in blood pressure, headache, nervousness, panic attacks, tremors, sleeplessness, and so on (Griffiths and Grifiths, 2005; Hicks et al., 1996; Stephenson, 1977). Coffee is the most common beverage that people use to take in caffeine, so caffeine content and changes in caffeine content during the storage period need to be measured in beverages supplemented with coffee.
We measured the caffeine content of the milk beverage with coffee. The caffeine content of the samples tended to decrease over the course of 8 wk (Table 4). The caffeine content of samples before storage was the highest (0.43±0.01 mg/mL) among all samples. Some reports mentioned that the caffeine content of coffee or tea is likely to decrease when beverages are stored for a long time (Park and Kim, 2006; So et al., 2014).
A-CDifferent letters in the same row indicate significant differences at p<0.05.
a,bDifferent letters in the same column indicate significant differences at p<0.05.
The results of sensory evaluation are shown in Table 5. There were no significant difference in flavor, aroma, coffee body, and aftertaste during the storage period, but color, sweetness, bitterness, sourness, and overall acceptability changed. Sweetness decreased gradually at 30°C and reached 2.1±1.2, the lowest level of all. In contrast to sweetness, bitterness increased at all temperatures, and sourness also increased during storage, especially significantly at 30°C, and reached 2.9±1.2 at 8 wk, the highest value of all. Overall acceptability likewise decreased, and was lowest at 30°C (1.7±0.8).
A-CDifferent letters in the same row indicate significant differences at p<0.05.
a,bDifferent letters in the same column indicate significant differences at p<0.05.
The results of sensory evaluation of the milk beverage supplemented with coffee showed that all categories tended to receive lower scores gradually during 8 wk of storage. Deterioration of quality was especially pronounced at 30°C as evaluated by taste and overall acceptability.
When evaluating the experiments on the milk beverage supplemented with coffee during the 8-wk storage period, PV was selected as the final indicator of shelf-life. Fig. 1(a) shows changes in PV at each storage temperature; the graph is exponential. Therefore, all PVs were converted into natural logarithm values, which produced a linear equation (Fig. 1(b)).
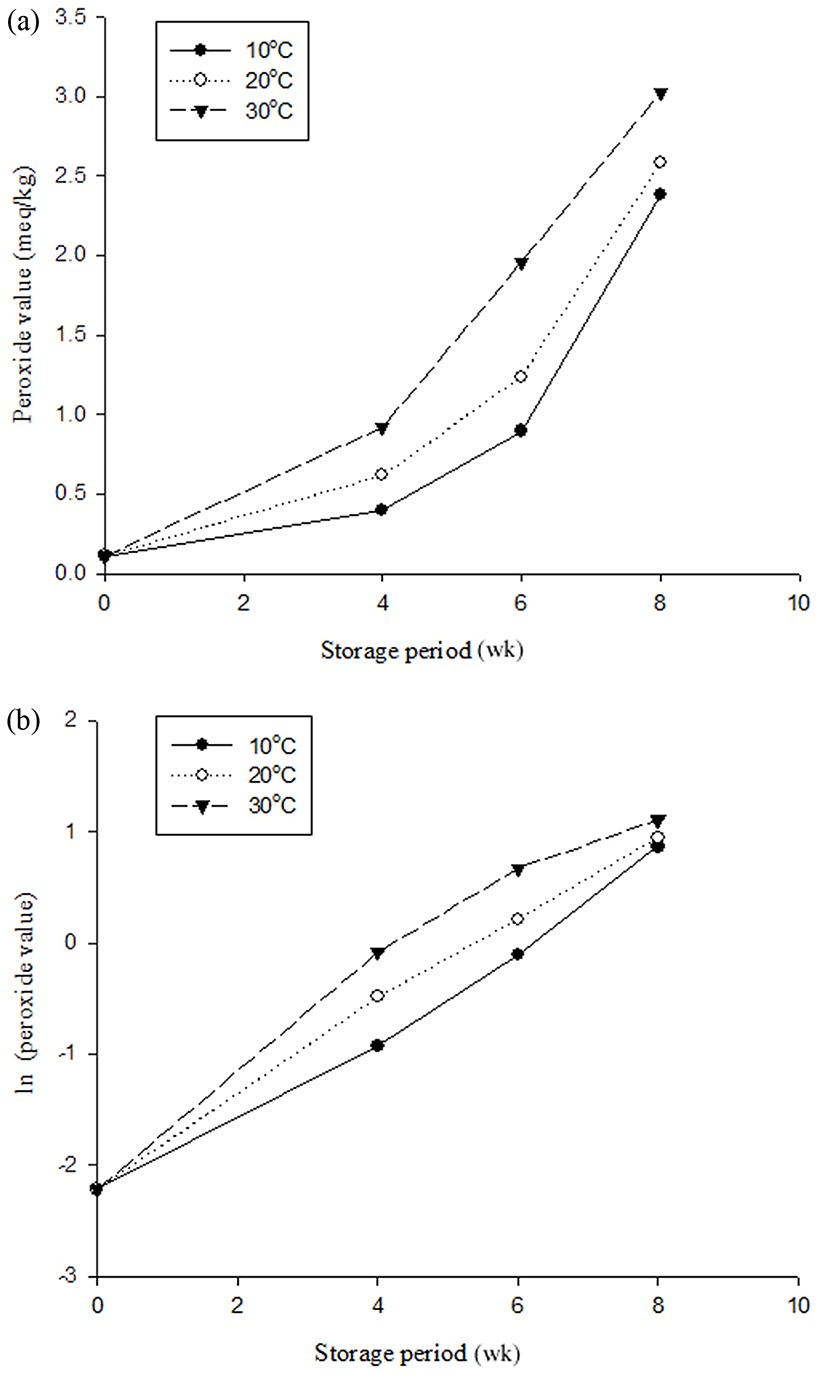
With the peroxide values from samples stored at 10, 20, and 30°C during storage, regression and coefficient (R2) values of each sample were calculated, and are given in Table 6. The coefficient (R2) of the first-order reaction formula was much higher than that of the zero-order reaction formula, so the first-order reaction was used to estimate the shelf-life of the milk beverage with coffee. According to Labuza and Bergquist (1983), the kinetics of PV follow a first-order reaction, and our results corresponded to those findings.
1)ASLT: accelerated shelf-life test.
Activation energy and regression were obtained using the Arrhenius equation with the first-order reaction formula (Table 7). The reaction regression of the milk beverage was lnK = −483.79X + 0.737 and the coefficient of determination (R2) was 0.9677, which means that the regression of samples determined with the Arrhenius equation is highly accurate for quality deterioration by PV of samples kept at different temperatures during the storage period.
1)K: kinetic constant; 2)lnK: logarithmically transformed kinetic constant; 3)R: gas constant (1.987 Kcal/mol); 4)X: 1/T.
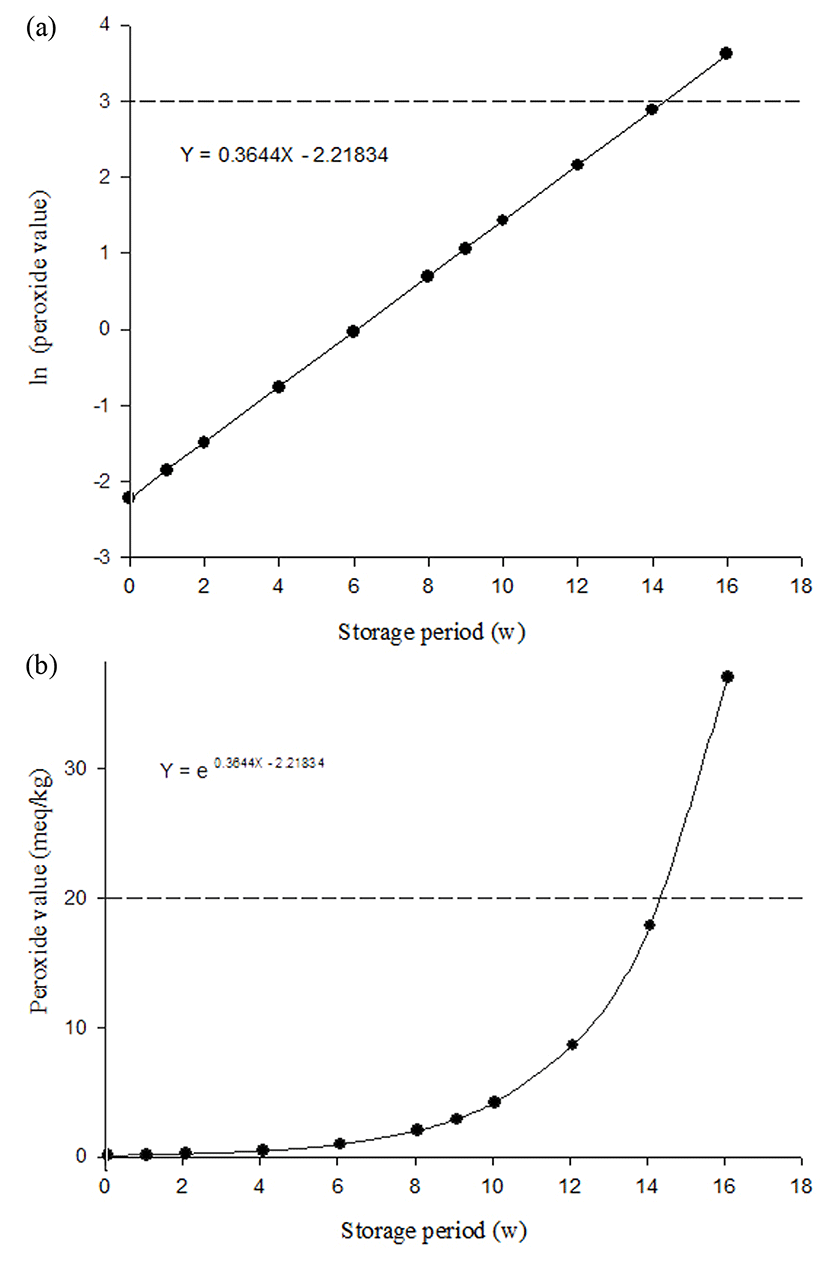
We assumed that milk beverages can be kept at 4°C during distribution and calculated when the PV reached the quality limit point (20 meq/kg) using the equation ln(PV) = 0.3644X − 2.21834, and with this equation, PV = e0.3644X-2.21834 was calculated and indicated in Fig. 2. Therefore, 14.3086 weeks was determined to be the shelf-life of the milk beverage supplemented with coffee during storage at 4°C.
Conclusion
This study was carried out to establish the shelf-life of a milk beverage product supplemented with coffee. During the storage period, total aerobic bacteria, E. coli, yeast, and mold were not detected and the results of overall acceptance in sensory evaluation showed less than 3 points on a 5-point scale after a 4 wk storage period. This study revealed that the PV is a suitable indicator of the shelf-life of the milk beverage product. Given the results of PV analysis, a point of 20 meq/kg was determined to be the end of shelf-life through the Arrhenius equation with an accelerated shelf-life test (ASLT). Finally, the regression for qualitative degradation by an increase of PV in the milk beverage supplemented with coffee was ln(PV) = 0.3644X − 2.21834 by the Arrhenius equation, and the shelf-life of the beverage was estimated to be 14.3086 wk at 4°C.