


Introduction
Poultry meat is known for its low fat content but high nutritional value and is relatively cheaper due to low cost of production compared to beef or pork (Chouliara et al., 2007). According to FAO (2006), poultry meat consumption accounts for approximately 31% of global meat consumption. However, poultry meats are highly perishable due to bacterial contamination (Hong et al., 2007), and in the worst case scenario, the contamination can cause food poisoning. Various processing techniques as well as treatments during storage have been developed to extend the shelf-life of poultry meat and meat products (Hwang and Beuchat, 1995; Kim and Day, 2007).
Ozone is commercially used for the deodorization of industrial waste and the disinfection of drinking water. However, the use of ozone for food stuff has increased after its designation as Generally Recognized as Safe (GRAS) by the Food and Drug Administration (FDA) in 1997 (Kim et al., 1999). Ozone is used in a wide variety of agricultural products, such as vegetables, fruits and fish with broad-spectrum antimicrobial activity and is regarded as a potential bactericidal agent (Greene et al., 2012). Botzenhart et al. (1993) have shown that ozone is a more effective sanitizer than chlorine dioxide. The possible action of ozone for bacterial elimination is that ozone can disrupt the cell membrane and cell wall constituents of bacteria, leading to cell lysis and damage proteins and DNA (Komanapalli and Lau, 1996). The disruption or lysis of cell walls by ozone is a faster bacterial inactivation mechanism than inactivation by disinfectants, which require time to permeate the cell membrane (Pascual et al., 2007). Yang and Chen (1979) found that broiler cuts soaked in water-containing ozone prior to refrigerated storage, had longer shelf-life.
Lipid oxidation is one of the primary factors that reduce the quality of meat and meat products such as discoloration, and the compound generated by lipid oxidation may affect human health. Lipid oxidation occurs through the presence of both endogenous and exogenous pro-oxidants. Environmental conditions also promote the occurrence of lipid oxidation. In fresh meat, the endogenous pro-oxidants, such as reactive oxygen species (ROS) contained in muscle, are the common initiators of lipid oxidation (Chan and Decker, 1994). However, for meat products or fresh meat subjected to processing, the susceptibility to lipid oxidation is greater. Spices or additives, physical processes (including grinding, chopping and mixing), cooking and storage increase the chance of lipid oxidation (Ladikos and Lougovois, 1990). Ozone causes oxidative conditions to which the cells respond by stimulating the expression of antioxidant enzymes such as catalase, glutathione peroxidase (GPx) and superoxide dismutase (SOD) (Lee et al., 2003).
Previous study was focus on the bactericidal effect of gaseous ozone exposure on chicken breast inoculated with Salmonella enterica serovar Typhimurium (Muhlisin et al., 2015). Study on the effect of ozone exposure on poultry meat from different species was limited. Thus, present study reported the effect of gaseous ozone exposure during refrigerated storage on bacterial counts and oxidative properties in chicken and duck breast meat including meat antioxidant enzyme activity.
Materials and Methods
Skinless chicken and duck breast fillets were obtained from a local market on the day of experiment. A 20.0±1.0 g sample was placed on a sterilized petri dish (Ø60 mm × 15 mm; SPL Life Sciences, Korea) in two different chambers (L × W × H = 25 × 20 × 20 cm). The first chamber contained a normal air composition, and the second chamber was equipped with an ozone generator (MA-2, NOAH environmental clean, Korea). It generates electric tension to produce a continuous flux of ozone (10×10−6 kg O3/m3/h) and negative ions. The ozone generator was set to on for 15 min and off for 105 min (on/off = 1:7) using an automatic timer plug (Theben 0260.0, Germany) and this setting was run during the 3-d storage period. The chamber was cleaned with 70% ethanol to eliminate potential contaminants during storage. The chambers were placed in a refrigerator at a temperature of 4±1℃. Daily experiments were conducted to measure the bacterial counts and oxidative properties. The bacterial counts included total plate counts of coliform, aerobic and anaerobic bacteria bacteria. The oxidative properties measurements included instrumental color, TBARS and antioxidant enzyme activity.
Approximately 1 g of sample was put in a sterile bag (Nasco Whirl-Pak, USA) and was homogenized with 9 mL sterilized 0.1% peptone water for 2 min using a stomacher (Lab blender 400 Seward Laboratory, UK). Decimal dilutions were prepared using 0.1% sterilized peptone water. Coliform was enumerated using VRBA (violet red bile agar, Difco, USA), and total bacteria was enumerated using plate count agar (PCA; Difco, USA). For coliform and aerobic bacteria enumeration, the plates were incubated aerobically at 37℃ for 24-48 h. For total anaerobic bacteria count determination, the plates was incubated anaerobically at 37℃ for 24-48 h. Microbial population was counted using a colony counter (C-C03, Chang Shin Scientific, Korea) and expressed as Log CFU/g.
The surface color of the samples was measured instrumentally using a chromameter (CR-400, Konica Minolta Sensing Inc., Japan) on each day of storage. The light source of illuminant C (2° observer) was calibrated with a white plate (Y=93.6, X=0.3134, y=0.3194). The instrumental surface color of the CIE L* (lightness), a* (redness) and b* (yellowness) of the sample was measured in triplicates for each sample. Chroma (C* = (a*2 + b*2)0.5) and hue-angle (h° = arctan (b*/a*)) were calculated using a data processor (DP-400, Konica Minolta Sensing Inc., Japan). Three measurements of each sample were performed on the surface immediately after the samples were taken out of the chamber.
HPLC-grade chloroform was purchased from Daejung Chemical and Metals Co. Ltd. (Korea). Distilled water (DW) was purified with a glass still (Mega-PureTM System MP-11A, Corning Inc., USA). All other reagents were purchased from Sigma-Aldrich Co., LLC. (USA).
Each 0.5 g of sample was mixed with three drops of antioxidant solution, 3 mL of TBA solution and 17 mL of 25% (w/v) trichloroacetic acid (TCA), followed by incubation in a water bath at 100℃ for 30 min. The mixture was cooled, and 5 mL volume was removed and centrifuged at 2,400 g for 30 min. The absorbance of the supernatant was measured at 532 nm using a spectrophotometer (UVmini-1240, Shimadzu, Japan). The results were expressed as mg of malonaldehyde (MA) per kg of sample (Sinnhuber and Yu, 1977).
A 5-g sample was homogenized with 25 mL of 50 mM phosphate buffer (pH 7.0) using a homogenizer (Ultra- Turrax T25 basic, IkaWerke GmbH & Co., Germany) for 15 s at 13,500 rpm. Centrifugation was performed at 1,000 g for 15 min at 2℃. The supernatant was filtered through a Whatman filter paper No. 1.
CAT activity was measured using a method described by Aebi (1984). First, 100 μL of filtered supernatant was mixed with 2.9 mL of 30 mM H2O2 within a crystal cuvette (light path: 1 cm). The decrease in absorbance at 240 nm was recorded every 10 s for 2 min. The catalase activity was calculated as follows:
The number 3.45 represents the decomposition of 3.45 μmol of hydrogen peroxide in a 3.0 mL reaction mixture to produce a decrease in absorbance at 240 nm from 0.45 to 0.40 absorbance units. T-min corresponds to the time in minutes required for absorbance at 240 nm to decrease from 0.45 to 0.40 absorbance units, and 0.1 mL represents the volume of the meat extract. The catalase activity was expressed as units/g sample. CAT activity was expressed as U/g sample.
The GSH-Px activity measurement was performed according to the enzymatic protocol by Flohé and Günzler (1984) with slight modification. A total of 100 μL of filtered supernatant was mixed with 0.5 mL of phosphate buffer-0.001 M EDTA-0.1 M NaN3, 100 μL of the assay mixture containing 5 units/mL glutathione reductase in 50 mM phosphate buffer, 100 μL of 10 mM L-glutathione reduced, 100 μL of 1.5 mM NADPH in NaHCO3, and 100 μL of 1.5 mM H2O2 within a 10-mm precision cell (104-QS, Hellma Analytics, Germany) and incubated for 5 min at room temperature. GSH-Px activity was measured by recording the decrease in absorbance of the incubated mixture at 340 nm over 2 min. GSH-Px activity was expressed as U/g sample. One unit represents the amount of meat extract needed to alter 1 μmol of NADPH with a mM extinction coefficient of 6.3 at 340 nm.
All values are reported as mean±standard deviation for each treatment group. Analysis of variance (ANOVA) was performed using the general linear model (GLM) procedure of SPSS, version 19.0 (SPSS 2010), followed by Duncan’s multiple range test to compare the mean of oxidative properties. The difference in bacterial counts between the ozone treatment and control groups was determined using a paired sample t-test with a confidence interval of 95% (p<0.05).
Results and Discussion
Total aerobic, anaerobic and coliform are presented in Table 1. Ozone significantly reduced the aerobic bacterial counts in chicken breast from 1 d of storage and in duck breast from 3 d of storage (p<0.05). Ozone decreased the anaerobic bacteria counts from 2 d of storage in both duck and chicken breast. The inhibition rate of aerobic and anaerobic bacteria by ozone treatment was found higher in chicken than duck breast meat on day 3 because the population of aerobic and anaerobic bacteria in non-treated chicken breast meat was higher 1 Log CFU than those in duck breast meat. Total coliform was significantly lower from 2 d of storage in sample exposed to ozone (p<0.05). Moreover, on day 4 of storage, coliform was not detected in both duck and chicken breast exposed to ozone. These data clearly show that ozone was more effective to diminish the population of coliform in duck and chicken breast until day 4 of storage and indicate that exposing ozone at 10×10−6 kg O3/m3/h could disinfect harmful pathogen such as Escherichia coli. This result agrees with a previous study showing that 12×10−6 kg O3/m3/h of ozone treatment reduced the CFU by 0.65 Log CFU/g in a circular beef sample cut from a carcass at 5℃ on day 1 after the samples were inoculated with 50 μL of 108 CFU/mL of E. coli O157:H7 (Cardenas et al., 2011).
Mean values±standard deviation.
a-dMeans in the same column followed by different superscript letters in lower-case are significantly different (p<0.05).
A-EMeans in the same row followed by different superscript letters in upper-case are significantly different (p<0.05).
TBARS value (Table 2) is a strong objective predictor of the perception of rancidity. The TBARS value of the duck breast was higher than that of the broiler chicken throughout storage time. Starting from 2 d of storage, the TBARS value in duck breast meat exposed to ozone was significantly higher compared with duck without ozone exposure and chicken breast (p<0.05). However, the ozone effect on the TBARS of chicken breast was only observed on day 4 of storage.
Mean values±standard deviation.
a-dMeans in the same column followed by different letters in superscript lower-case are significantly different (p<0.05).
A-EMeans in the same row followed by different letters in superscript upper-case are significantly different (p<0.05).
Ozone promotes lipid oxidation in chicken and duck breast meat. The action of ozone on oxidants causes irreversible damage to the fatty acids in the cell membrane and the cellular protein through oxidation (Sekhon et al., 2010). Ozone (O3) is categorized as a radical derivative reactive oxygen species (ROS) that is mainly responsible for the initiation of the oxidation reaction of foods, particularly in lipids, where it destroys essential fatty acids (Choe and Min, 2005). Moreover, ozone gas is unstable and decays naturally into diatomic oxygen (Finch and Fairbairn, 1991). During continuous exposure, the oxygen generated by ozone degradation might increase. Previous studies have reported the effect of oxygen on the promotion of the lipid oxidation in meat (Li et al., 2012; Vitale et al., 2014).
The effects of the ozone treatment on the CAT and GPx activities are presented in Table 3. The initial CAT activity of the duck breast meat was higher that than of chicken breast (p<0.05). As the storage time increased, the CAT activity of all sample groups decreased. The ozone exposure reduced the CAT activity in duck from 3 d of storage (p<0.05). However, the ozone exposure did not statistically affect the CAT activity in chicken breast. The CAT activity in chicken breast exposed to ozone tended to be lower than that in the non-ozone counterpart. The relatively stable CAT activity of beef muscles under aerobic conditions was also reported by Renerre et al. (1996). Pradhan et al. (2000) found stable CAT activity in ground beef during 6 d of aerobically refrigerated storage. Whiteside and Hassan (1988) reported CAT inactivation caused by exposure to ozone gas. They also noted that the inactivation of CAT by ozone depended on the time exposure and pH level. Lee et al. (2003) suggested that the inactivation of CAT by ozone was primarily due to damage in protein moieties, which subsequently led to heme release.
Mean values±standard deviation.
a-dMeans in the same column followed by different superscript letters in lower-case are significantly different (p<0.05).
A-EMeans in the same row followed by different superscript letters in upper-case are significantly different (p<0.05).
GPx decreased as the storage time increased in all samples. The GPx activity of both duck and chicken breast exposed to ozone tended to be lower than in the sample without ozone exposure. A significant effect of ozone on GPx activity was only detected on days 1 and 4 of storage, during which GPx was lower. These results indicate that GPx was more resistant to ozone than CAT. This result is in accordance with that of Lee et al. (2003). CAT and GPx, together with SOD, are known to act to prevent the accumulation of lipid oxidation products (Utama et al., 2016). Because the activity of CAT and GPx was reduced by ozone, these enzymes lost their antioxidant abilities, which resulted in increased lipid oxidation rates.
The changes in surface color of chicken and duck breast exposed to gaseous ozone are shown in Table 4 and Fig. 1. Ozone exposure significantly reduced the redness of duck and chicken breast during storage. This color appearance was instrumentally proved by CIE a* value data measured with a color difference meter. The CIE a* value of duck meat was significantly higher than that of chicken. The redness was significantly reduced by ozone exposure (p<0.05) throughout the storage days and higher decline rate was recorded in duck breast. Ozone accelerated the increasing degree of CIE L*, b* and h° value on the surface of duck and chicken breast during storage. However, the chroma values were affected by ozone exposure in the same manner as the CIE a* values, creating pale and brown characteristics.
Mean values±standard deviation.
a-dMeans in the same column followed by different letters in superscript lower-case are significantly different (p<0.05).
A-DMeans in the same row followed by different letters in superscript upper-case are significantly different (p<0.05).
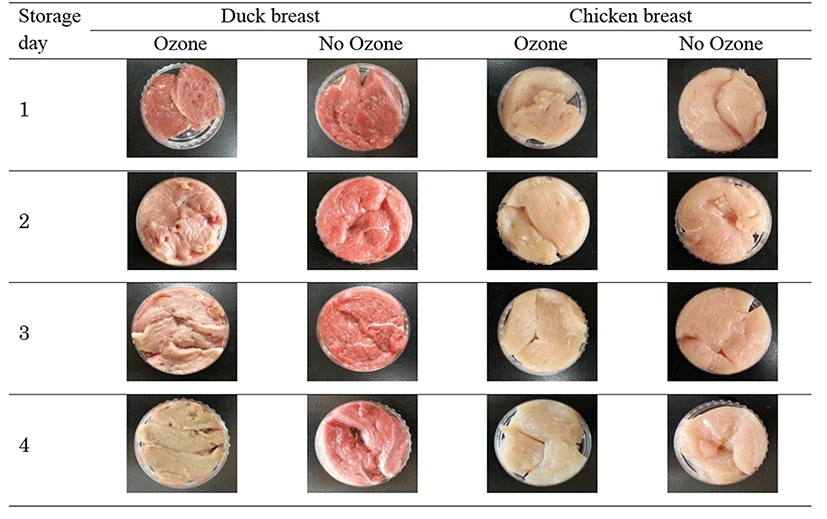
Our results are in line with those of Cardenas et al. (2011), who found lower a* values of beef exposed continuously to ozone for 24 h. An ozone-induced decrease of a* during the storage of ground beef was also reported by Stivarius et al. (2002). The decrease in a* was due to the oxidation of myoglobin and oxymyoglobin to metmyoglobin through the ozone exposure. Ozone and other reactive oxygen species are strong oxidants that initiate lipid and myoglobin oxidation (Bekhit et al., 2013). The oxidation of myoglobin produces metmyoglobin, which causes the discoloration of meat that is characterized by lower redness (Mancini and Hunt, 2005).
Conclusions
Gaseous ozone exposure at 10×10−6 kg O3/m3/h effectively inhibited the growth of coliform and total aerobic and anaerobic bacteria in chicken and duck breast meat during refrigerated storage. As the TBARS values of chicken breast meat were still in acceptable amount until day 3, chicken breast meat could be preserved by gaseous ozone exposure at 10×10−6 kg O3/m3/h until no longer than 3 d of storage. In contrast, preserving duck breast meat by ozone exposure is not recommended as undesirable brown color appears and TBARS values increase rapidly.