


Introduction
Animal blood was considered as the first by-product obtained during the slaughtering process. Blood is composed of blood cells (20-40% of total blood volume, mostly red cells with smaller amounts of white cells and platelets) and suspended in liquid plasma (60-80%) (Leoci, 2014; Tarté, 2011). It composes of 17-18% protein and 75-82% moisture, where hemoglobin, a protein found in red blood cells, makes up approximately 70% of total blood proteins (Leoci, 2014). In plasma fraction, the major proteins are albumin, globulins (α1-, α2-, β- and γ-globulins) and fibrinogen, representing approximately 56%, 40.2% and 0.6%, respectively (Tarté, 2011). Blood is a good source of nutrients, especially for the high content of essential amino acids, and the high bioavailability of iron namely heme iron, and it is considered as non-allergenic protein when compared to dairy and soy proteins (Leoci, 2014). However blood proteins are deficient in some essential amino acids, methionine and isoleucine (Ockerman and Hansen, 2000), and their levels in the blood can vary depending on age and animal species (Gorbatov, 1988).
Due to dark color and unpalatability of whole blood, its application as food ingredients is limited. There were extensively researches and reviews regarding the use of fractionated blood in food application based on their functional forms (Bah et al., 2013; Leoci, 2014; Ofori and Hsieh, 2013; Tarté, 2011). They summarized that the primary utilization of blood in food products, such as gelling agent, binder, emulsifier, stabilizer, fat replacer and protease inhibitors, are obtained by plasma protein and its components. On the contrary, spray-dried red blood cell and hemoglobin have been used for iron fortification and color enhancement.
Although several countries, especially in Europe and Asia, have extensively utilized whole blood as a source of protein and have been commercially available in such products as blood sausage, blood pudding, blood cake and blood curd or blood tofu (Liu, 2002), the information of nutritive value and functional properties of whole blood have been explored to a lesser extent. Especially for comparative data among blood from different animal species, there is the only report from Márquez et al. (2005), who reported the differences in protein and isoleucine, lysine and methionine contents of bovine, porcine and poultry blood. To better utilization of whole blood, the objective of this investigation was to compare the hematological and chemical compositions as well as functional properties of the animal blood obtained from pig, chicken and duck.
Material and Methods
Porcine, chicken and duck blood samples (bleeding from Three-way cross-bred pigs from Duroc × (Landrace × Large white) at 6 mon of age, Arber Acer broilers at 42 d, Cherry valley crossbred ducks at 47 d, respectively) were collected in three batches at different days in the bleeding line of industrial slaughterhouses. Immediately, porcine blood was placed into an EDTA collection tube, and avian blood samples were placed into a lithium heparin collection tube for hematological evaluation. To prevent coagulation of blood for determination of chemical compositions and functional properties, animal blood samples were mixed with tri-sodium citrate solution (10%, w/v) at a ratio of 1:9 (v/v) to obtain the final concentration of 1% (w/v). All samples were kept in polystyrene box containing ice and transported to the Department of Animal Production Technology and Fisheries, Faculty of Agricultural Technology, King Mongkut’s Institute of Technology Ladkrabang within 3 h for further analysis. Blood samples for chemical and functional analyses were then freeze-dried in a FD4 Floral Freeze Dryer (Epsilon Co. Ltd., Thailand). Freeze-dried blood samples from the three batches per species were stored at −20°C until analysis.
The total RBC concentration of avian blood was determined manually with the improved Neubauer counting chamber after the blood was diluted 200 times with Natt and Herrick solution (Natt and Herrick, 1952). The total number of RBCs was expressed as the number of RBCs (106 cell) per microliter.
The PCV was determined after the blood had been transferred to microcapillary tubes and centrifuged at 12,500 g for 5 min. Thereafter, the PCV was read as a percentage directly from a PCV reading chart (Schalm et al., 1975).
The Hb concentration was determined by the cyanmethemoglobin method (Schalm et al., 1975), and reported as g/dL. Values of RBC indices including MCV, MCH and MCHC were calculated from the PCV, Hb concentration, and RBC count as the following equations (Schalm et al., 1975):
Porcine, chicken and duck blood smears were stained with Wright-Giemsa Stain (Schalm et al., 1975) and was observed under a light microscope at 100 of magnification. The RBC diameter of porcine blood as well as the RBC width and length of avian blood were measured on the image files, using UTHSCSA Image Tool® Version 3.00 software (The University of Texas Health Science Center, USA).
Plasma protein concentrations in porcine, chicken and duck blood were determined by the biuret photometric method (Sirois, 2015). To separate the plasma fraction, collected blood was centrifuged at 2,520 g at 4°C for 15 min according to the procedure of Dàvila et al. (2007). The supernatant was collected, designed for plasma protein, and then stored at 20°C. Plasma protein concentration in thawed sample was determined by the biuret method with bovine serum albumin as the standard and expressed value as g/dL.
Moisture, protein, fat, carbohydrate and ash contents of freeze-dried blood sample were analyzed according to the method of AOAC (2012). The values were expressed as % (dry weight basis).
Iron (Fe), magnesium (Mg), zinc (Zn), copper (Cu), manganese (Mn), chromium (Cr), and selenium (Se) contents of freeze-dried blood were determined by the inductively coupled plasma optical emission spectrophotometer, ICP-OES (Optima 8000, Perkin Elmer Instruments, USA) according to the method of AOAC (2012). Samples (4 g) were mixed with 4 mL of concentrated nitric acid and shaken vigorously for 5 min. The mixtures were then heated using a hot plate until digestion was completed. The digested samples were transferred to a volumetric flask and the volume was made up to 25 mL with deionized water. The solution was subjected to ICP-OES analysis. The wavelengths for analysis of Fe, Mg, Zn, Cu, Mn, Cr and Se were 238.204, 285.213, 206.200, 327.393, 257.610, 267.716 and 196.026 nm, respectively. The concentration of mineral was calculated and expressed as mg/kg dry weight.
Heme iron was determined using acidified acetone extraction according to the method of Hornsey (1956) with a slight modification. Freeze-dried blood sample (0.5 g) was weighted into 50 mL centrifuge tubes. To this was added about half of an acidified acetone solution containing 16 mL of acetone, 3.6 mL of distilled water and 0.4 mL of concentrated hydrochloric acid. Each sample was homogenized for 15 s with an Ultra Turrax T25 (IKA-Labortechnik, Germany). Then, the remaining acidified acetone solution (10 mL) was added. The sample was mixed thoroughly and kept in the dark for 1 h. The obtained solution was centrifuged at 2,200 g for 10 min and supernatant was then filtered through Whatman filter paper No.1. The absorbance was measured at 640 nm against reagent blank. Hematin was used as standard (0-50 mg/mL). The hematin concentration in the sample was calculated from the standard curve. Then the iron content in hematin was calculated with the factor of 0.0882 mg iron/mg hematin (Budavari, 1989), and the value was reported as mg/g dry weight.
Non-heme iron content was measured as described by Rebouche et al. (2004) with minor modification. Freeze-dried blood sample (25 mg) was homogenized in deionized water (1:10 w:v) using glass-glass Duall homogenizer on slush ice. Two hundred microliters of homogenates and protein precipitation solution (1 N HCl and 10% (v/v) trichloroacetic acid) were combined in 1.5 mL microcentrifuge tubes, vortex mixed and incubated at 95°C for 60 min and subsequently cooled to room temperature. After centrifugation at 10,000 g for 10 min at room temperature, 250 mL of supernatant aliquots were mixed with 250 ml of chromogen solution (0.508 mM ferrozine, 1.5 M sodium acetate and 0.1% (v/v) thioglycolic acid). Sample blank consisted of tissue extract supernatant and 250 mL of 1.5 M sodium acetate containing 0.1% (v/v) thioglycolic acid. After incubation for 30 min at room temperature, absorbance was read at 562 nm in quartz microcuvette using double beam UV-VIS spectrophotometer (UV-1601, Shimadzu Corporation, Japan). Iron standards (2-10 mg/mL) was used to construct a standard curve. The non-heme iron content was calculated and reported as mg/g dry weight.
For all amino acids, except for methionine, acid hydrolysis was performed in which freeze-dried blood sample (100 mg) was hydrolyzed with 6 N HCl (5 mL) and placed in a heating block at 110°C for 22 h. Regarding methionine, performic acid oxidation followed by acid hydrolysis was applied according to the method of Bosch et al. (2006). The internal standard (10 mL of 2.5 mM α-aminobutyric acid) was added into the cooled hydrolysate, mixed, and then diluted with deionized water. The diluted sample was filtered through 0.45 μm syringe filter. Filtrate (10 mL) was mixed with AccQ Fluor derivative buffer (70 mL) and then added with AccQ Fluor derivative reagent (20 mL) for derivatization at 55°C for 10 min. The AccQ-Fluor amino acid derivatives were separated by reverse phase HPLC (Waters Alliance 2695, Waters, USA) at 35±1°C and detected by a fluorescence detector (Jasco FP-2020, JASCO International Co., Ltd., Japan) with excitation wavelength at 250 nm and emission wavelength at 395 nm. Samples (5 μL) were injected into a Hypersil Gold C18 Column (4.6 mm × 150 mm, 3 μm) (Thermo Scientific, USA). The separation gradient was performed according to the manufacture's protocol, which sodium acetate buffer, pH 4.9 as eluent A and 60% acetonitrile as eluent B were used.
The solubility was tested at different pHs following the method of Intarasirisawat et al. (2012). The sample was dispersed in distilled water and the pH was adjusted to different pHs (2.0, 3.0, 4.0, 5.0, 6.0, 7.0, 8.0, 9.0, 10.0) using either 6 N HCl or 6 N NaOH. The volume of the mixture was adjusted to the desired volume to obtain the final concentration of 10 mg sample/mL using distilled water with the corresponding pH. After stirring for 90 min, the mixtures were centrifuged at 1,800 g for 30 min. Protein concentration in the supernatant was determined using the Lowry method with bovine serum albumin as a standard. Total protein content in the sample was determined after solubilization of the sample in 0.5 N NaOH. Protein solubility was calculated as follows:
To determine effects of temperature and time on gel quality during thermally induced gelation, the method of Nowsad et al. (2000) was applied. Prepared blood samples (100 mg/mL dissolved in distilled water) were placed into small nylon bags (50 mm × 150 mm), heat-sealed and then heated in a temperature-controlled water bath (Memmert, Germany) at 70, 80 and 90°C for 15, 30, 45, 60, 75 and 90 min, respectively. After the heat treatment, gels were cooled on ice water. After storage for 24 h, the gels were cut into 6 cube samples for each heat treatment (20 mm × 20 mm × 20 mm). Texture profile analysis using an Instron universal testing machine model 1011 (Instron Engineering Corp., USA) equipped with a cylinder plate aluminum (155 mm diameter) was conducted. Samples were compressed at room temperature with the following testing conditions: crosshead speed was 60 mm/min and compressed twice to 40% of their original height. The Bluehill 2 software (Instron Engineering Corp., USA) was used to collect and process the data, where hardness (N) and springiness (ratio) were expressed.
The emulsion activity index (EAI) and the emulsion stability index (ESI) were determined according to the method of Pearce and Kinsella (1978), with slight modification. Samples at different concentrations (5, 10 and 20 mg/mL) were prepared using distilled water. Sample solution (6 mL) and soybean oil (2 mL) were homogenized (Ultra Turrax T25, IKA-Labortechnik, Germany) at a speed of 20,000 rpm for 1 min. The emulsions were pipetted out at 0 and 10 min and 100-fold diluted with 0.1% (w/v) SDS. The mixture was mixed thoroughly for 10 s using a vortex mixer. The absorbance was measured immediately (A0) and after 10 min (A10) of emulsification using a spectrophotometer, and was used to calculate EAI and ESI as follows:
where A, A500; ?, path length of cuvette (m); DF, the dilution factor (100); F, oil volume fraction; C, protein concentration in aqueous phase (g/m3) and Δt, 10 min. The control was prepared by mixing distilled water and oil in the absence of sample.
Foam expansion (FE) and foam stability (FS) of sample solutions were performed as described by Nalinanon et al. (2011) with slight modification. The samples were dissolved in distilled water (pH 7.0) to obtain designated protein concentrations (5, 10 and 20 mg/mL). Twenty milliliters of solutions were homogenized in a 100 mL-cylinder at a speed of 13,400 rpm to incorporate the air for 1 min at room temperature. The samples were allowed to stand for 0 and 30 min. FE and FS were then calculated using the following equations:
where VT is total volume after whipping, V0 is the original volume before whipping, and Vt is total volume after leaving at room temperature for 30 min.
Data was subjected to analysis of variance (ANOVA) and mean comparison was performed by Duncan’s multiple-range test. Pearson’s correlation coefficients were evaluated to determine the relationship among parameters. These statistical analyses were performed by using the Statistical Package for Social Science (SPSS for Windows version 11.5, SPSS Inc., USA).
Results and Discussion
There were significant differences in hematological parameters among animal blood as shown in Table 1. Porcine blood had a higher number of RBC than chicken and duck blood (p<0.05). A higher Hb concentration was found in porcine and duck blood than in chicken blood (p<0.05). The highest percentage of PCV was observed in porcine blood, followed by duck and chicken blood, respectively (p<0.05), and this value correlated with Hb concentration (r=0.962, p<0.01) (Table 2). Although MCHC value was not significant differences among samples (p>0.05), the highest values of MCH was shown in duck blood, followed by chicken and porcine blood, respectively (p<0.05). The MCV value indicated that duck blood had the largest RBC size, while porcine blood had the lowest value (p<0.05). All hematological parameters in this report were comparable within the ranges for porcine blood, chicken and duck (Weiss and Wardrop, 2010), where the differences reported for blood hematological parameters are mainly affected by animal species, geographical location and maturity of the animal (Bah et al., 2013).
1Values are given as means±SD of triplicate blood sampling.
2Different superscripts in the same row indicate significant differences (p<0.05).
3SEM is standard error of mean.
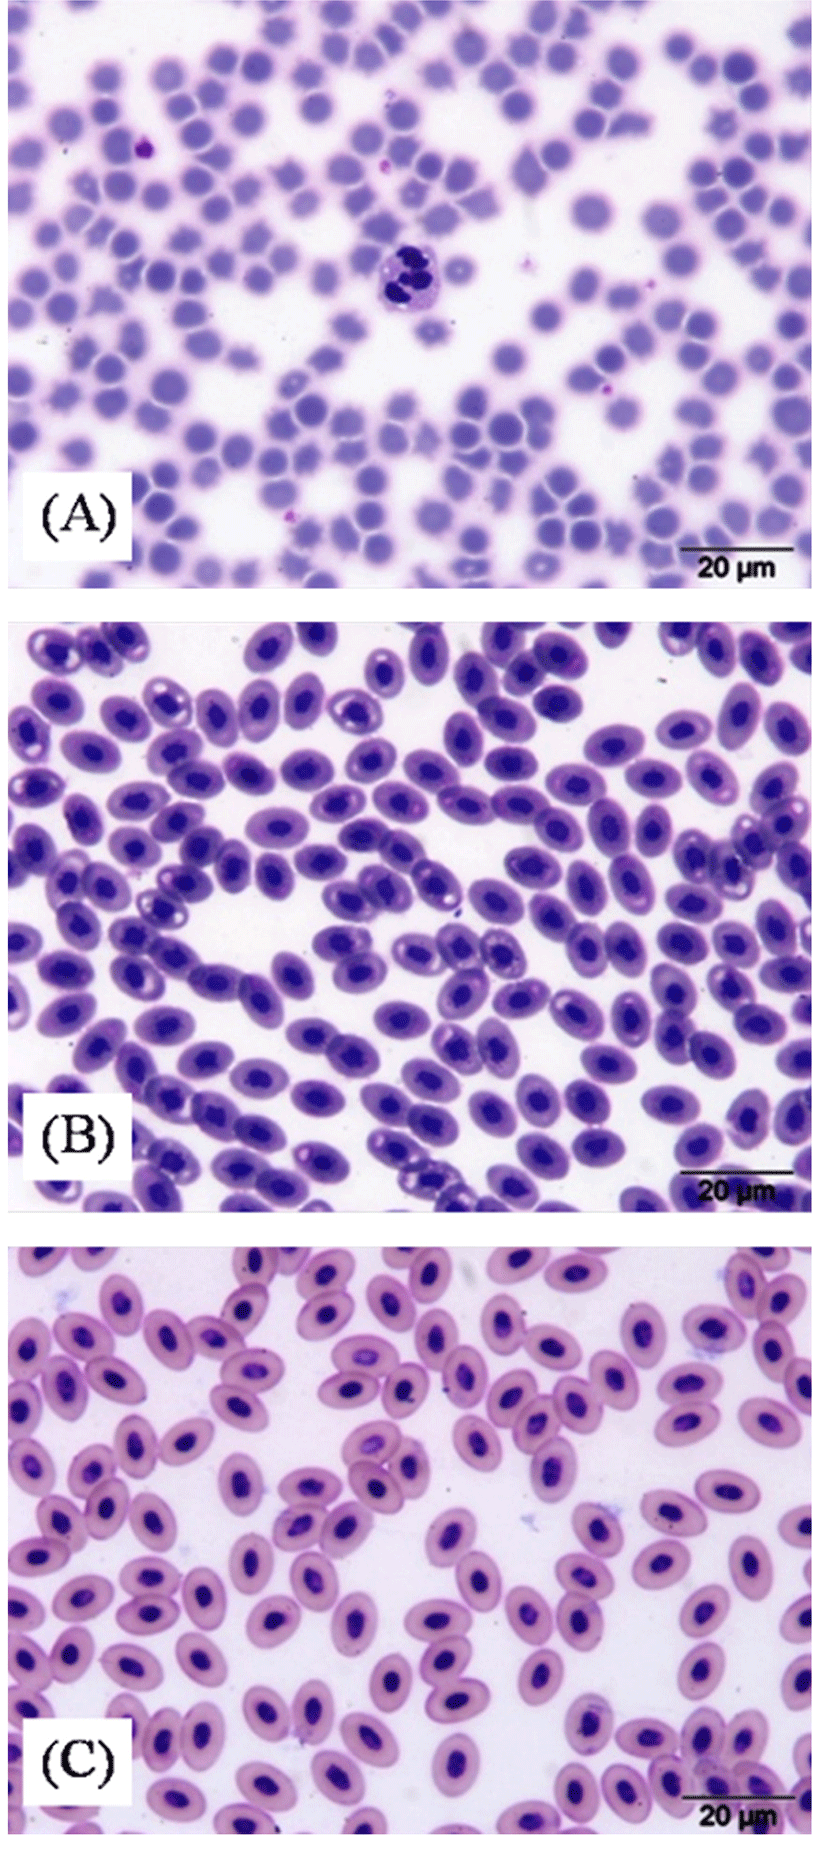
Morphologically, porcine blood had a round RBC with lack a cell nucleus (Fig. 1A) resulted from maximum space for hemoglobin of mammalian species (Weiss and Wardrop, 2010). The erythrocytes of avian blood were oval shaped and, unlike those of mammals, were nucleated cell as represented by centrally positioned purple nucleus and a uniform orange-pink cytoplasm in Wright-Giemsa stained blood (Fig. 1B and 1C). The RBC sizes of duck blood (11.91±0.78 mm of RBC length and 7.78±0.63 mm of RBC width) exhibited the largest value, followed by chicken (10.48±0.28 mm of RBC length and 7.12±0.17 mm of RBC width) and porcine (5.85±0.08 mm of RBC diameter) blood, which was positively correlated with MCV values (r ~ 0.97, p<0.01) (Table 2). Hartman and Lessler (1963) stated that RBC sizes of birds are much larger than mammalian erythrocytes (5-7 mm for many species), but smaller than the cells of reptiles (18×7 mm to 23×12 mm). As compared among avian species, the cytoplasm duck blood was less blue than chicken blood. This feature likely represents older aging of avian cells (Weiss and Wardrop, 2010), which related to the older of ducks than broiler ages in the present study.
*Correlation is significant at p<0.05. **Correlation is significant at p<0.01.
RBC, red blood cell; HB, hemoglobin concentration; PVC, packed cell volume; MCV, mean corpuscular volume; MCH, mean corpuscular hemoglobin; MCHC, Mean corpuscular hemoglobin concentration; PLP, plasma protein; HE, heme iron content; NHE, non-heme iron content; PHE, percentage of heme iron.
The concentration of plasma protein in avian blood was nearly twice lower than in porcine blood (Table 1). Generally, this value was reported in the range of 6-8 g/dL for mammals (Weiss and Wardrop, 2010), while it had been reported approximately 4 g/dL in birds (Griminger and Scanes, 1986). It was probably related to blood glucose in plasma of avian species which are typically more than double those in mammals (Scanes, 2015). Glucose is an active osmotic substance that reduces the protein concentration in order to maintain the colloid-osmotic pressure (Filipović et al., 2007).
The proximate composition (dry basis) indicated that porcine blood had the highest protein and fat contents, followed by duck and chicken blood, respectively (Table 3), but lower ash and moisture contents as compared with chicken and duck blood (p<0.05). The carbohydrate content of chicken blood was evidently higher than those of other samples (p<0.05).
1Values are given as means ± SD of triplicate blood sampling.
2Different superscripts in the same row indicate significant differences (p<0.05).
3SEM is standard error of mean.
4ND: this value is lower than limit of detection.
5Percentage of heme iron is computed as the ratio of heme iron to total iron.
A higher content of protein in whole porcine blood than in chicken blood was also observed by Márquez et al. (2005). As a result of sodium citrate was added to blood samples for preventing coagulation, a high content of ash was expectedly observed in all samples.
Fe, Mg, Zn, Cu, Mn, Cr and Se are trace elements which are essential for well-defined physiological functions of human biological system and insufficient intake of these trace minerals can cause nutritional problems (Guardia and Garrigues, 2015). Among these elements, Fe is one of the vital minerals needed for the optimum function of blood. The World Health Organization (WHO) estimates that some 2 billion people suffer from anemia due to iron deficiency, whose high-risk populations including adolescents, menstruating women and the elderly (Guardia and Garrigues, 2015). The result showed that although Fe content from porcine blood was lower than duck and chicken blood, its heme iron content was similar to duck blood, and was shown a higher content as compared to chicken blood (p<0.05) (Table 3). Additionally, the highest percentage of heme iron was the markedly found in porcine blood (p<0.05). A higher amount of heme iron content or percentage of heme iron of pork and duck blood as compared with chicken blood was related to they contained a higher Hb concentration (r=0.924, p<0.01 and r=0.963, p<0.01, respectively) (Table 2). While the highest content of Fe in chicken blood resulted from a dense in non-heme iron content. Not only a high content of bioavailability of iron, but also the largest values of Cu and Cr were found in porcine blood (p<0.05). The highest Zn was found in chicken blood and the highest Mg and Mn were found in duck blood (p<0.05). Regarding Se content, there was a lower content than the limit of detection of analyzed method. This composition data indicated that the minerals in blood powders depended mainly on the species of animal and could be used as product development or food supplementation to meet the recommended daily intake of expected minerals.
Amino acid composition of freeze-dried blood samples is presented in Table 4. Despite the lack of information regarding cystein and tryptophan due to the limitation of evaluated method, the summation of essential amino acid contents (leucine, lysine, valine, histidine, phenylalanine, tyrosine, threonine, isoleucine and methionine) of all samples were higher than total non-essential amino acid contents. Essential amino acid/non-essential amino acid ratios of porcine, chicken and duck blood were 1.06, 1.09 and 1.07, respectively. When amino acid profile was compared with amino acid requirements of adults recommended by FAO/WHO/UNU (2007), blood samples were an excellent source of essential amino acids, except for isoleucine. Similar amino acid patterns were observed compared with those reported by Donkoh et al. (1999) and Ockerman and Hansen (2000) for amino acid compositions of blood meals in which they possessed the highest content of leucine and rich in other essential amino acids including lysine, valine, histidine, phenylalanine, tyrosine and threonine, but limiting isoleucine and methionine contents. However, quite difference among reports relating isoleucine was observed, where this amino acid from avian blood in the present study was higher than those reports. The deficiency in isoleucine of whole blood from cow (9.3 mg/g protein) and pig (6.9 mg/g protein) than those from chicken (27.5 mg/g protein) was also reported by Márquez et al. (2005). Regarding methionine, there were no significant differences among blood samples in the present study (values were between 6.30 and 7.23 mg/g protein) (p>0.05). Márquez et al. (2005) also reported that methionine contents of whole blood from those species was not significantly different, which value was in the range of 2.8-9.6 mg/g protein and all blood represented deficiency in methionine requirement from FAO/WHO/UNO (2007), presently estimated as 16 mg/g protein. Generally, amino acid imbalance of blood because of the deficit in isoleucine and methionine has usually been reported (Ockerman and Hansen, 2000). For cystine and tryptophan contents, blood meal contained 15 and 11 mg/g, respectively (Ockerman and Hansen, 2000), which was under their requirements as recommend by FAO/WHO/UNO (2007), each approximately 6 mg/g protein.
| Parameters | WHO/FAO/UNU (2007) | Porcine blood | Chicken blood | Duck blood | SEM3 | P-Value |
|---|---|---|---|---|---|---|
| Essential amino acid | ||||||
| Leucine | 594 | 116.30 ± 2.31a,1,2 | 94.75 ± 1.29b | 89.30 ± 0.99c | 0.41 | 0.000 |
| Lysine | 45 | 86.04 ± 1.00a | 75.98 ± 4.97b | 82.13 ± 2.95a | 0.18 | 0.029 |
| Valine | 39 | 72.44 ± 4.29a | 52.91 ± 3.12b | 53.18 ± 3.47b | 0.34 | 0.001 |
| Histidine | 15 | 57.82 ± 2.51a | 48.07 ± 2.78b | 45.45 ± 1.34b | 0.20 | 0.001 |
| Phenylalanine | 38 (Phe+Tyr) | 57.49 ± 2.72a | 56.00 ± 4.73a | 53.21 ± 1.81a | 0.11 | 0.344 |
| Tyrosine | 25.83 ± 0.44b | 31.34 ± 2.33a | 28.39 ± 1.71b | 0.09 | 0.020 | |
| Threonine | 23 | 36.24 ± 0.28c | 49.13 ± 1.10a | 40.80 ± 0.40b | 0.19 | 0.000 |
| Isoleucine | 30 | 10.37 ± 0.73b | 30.55 ± 1.70a | 27.57 ± 1.89a | 0.32 | 0.000 |
| Methionine | 16 | 7.23 ± 0.30a | 6.30 ± 0.88a | 6.65 ± 0.43a | 0.21 | 0.253 |
| Non-essential amino acid | ||||||
| Aspartic acid | 111.25 ± 2.12a | 79.00 ± 2.81b | 82.05 ± 2.24b | 0.52 | 0.000 | |
| Glutamic acid | 95.89 ± 1.69a | 97.43 ± 2.89a | 98.25 ± 2.40a | 0.08 | 0.508 | |
| Alanine | 71.49 ± 0.44a | 67.48 ± 1.19b | 72.80 ± 0.87a | 0.08 | 0.001 | |
| Arginine | 42.94 ± 0.99c | 52.83 ± 2.33a | 47.94 ± 0.78b | 0.15 | 0.001 | |
| Serine | 46.02 ± 0.34a | 41.20 ± 1.26b | 35.27 ± 1.12c | 0.16 | 0.000 | |
| Glycine | 40.64 ± 1.46a | 35.57 ± 1.36b | 32.81 ± 0.67b | 0.12 | 0.001 | |
| Proline | 36.94 ± 0.33a | 35.65 ± 0.58b | 31.18 ± 0.39c | 0.09 | 0.000 | |
1Values are given as means±SD of triplicate blood sampling.
2Different superscripts in the same row indicate significant differences (p<0.05).
3SEM is standard error of mean.
4Amino acid requirements of adults (mg/g protein) estimated by WHO/FAO/UNU (2007).
As comparison among animal species, higher contents of non-polar amino acid with aliphatic hydrocarbon side chain (leucine, valine, glycine and proline) as well as histidine, aspartic acid and serine were observed in porcine blood, compared with other blood (p<0.05). Chicken blood had higher amounts of arginine, threonine and tyrosine, but lower levels of lysine and alanine, as compared with other blood (p<0.05). Blood from avian species, chicken and duck, contained a higher content of isoleucine than porcine blood (p<0.05), while no differences in phenylalanine and glutamic acid contents were observed among samples (p>0.05). Due to the highest content of isoleucine, chicken blood seems to be a better amino acid balance and alternative protein source to formulated food products.
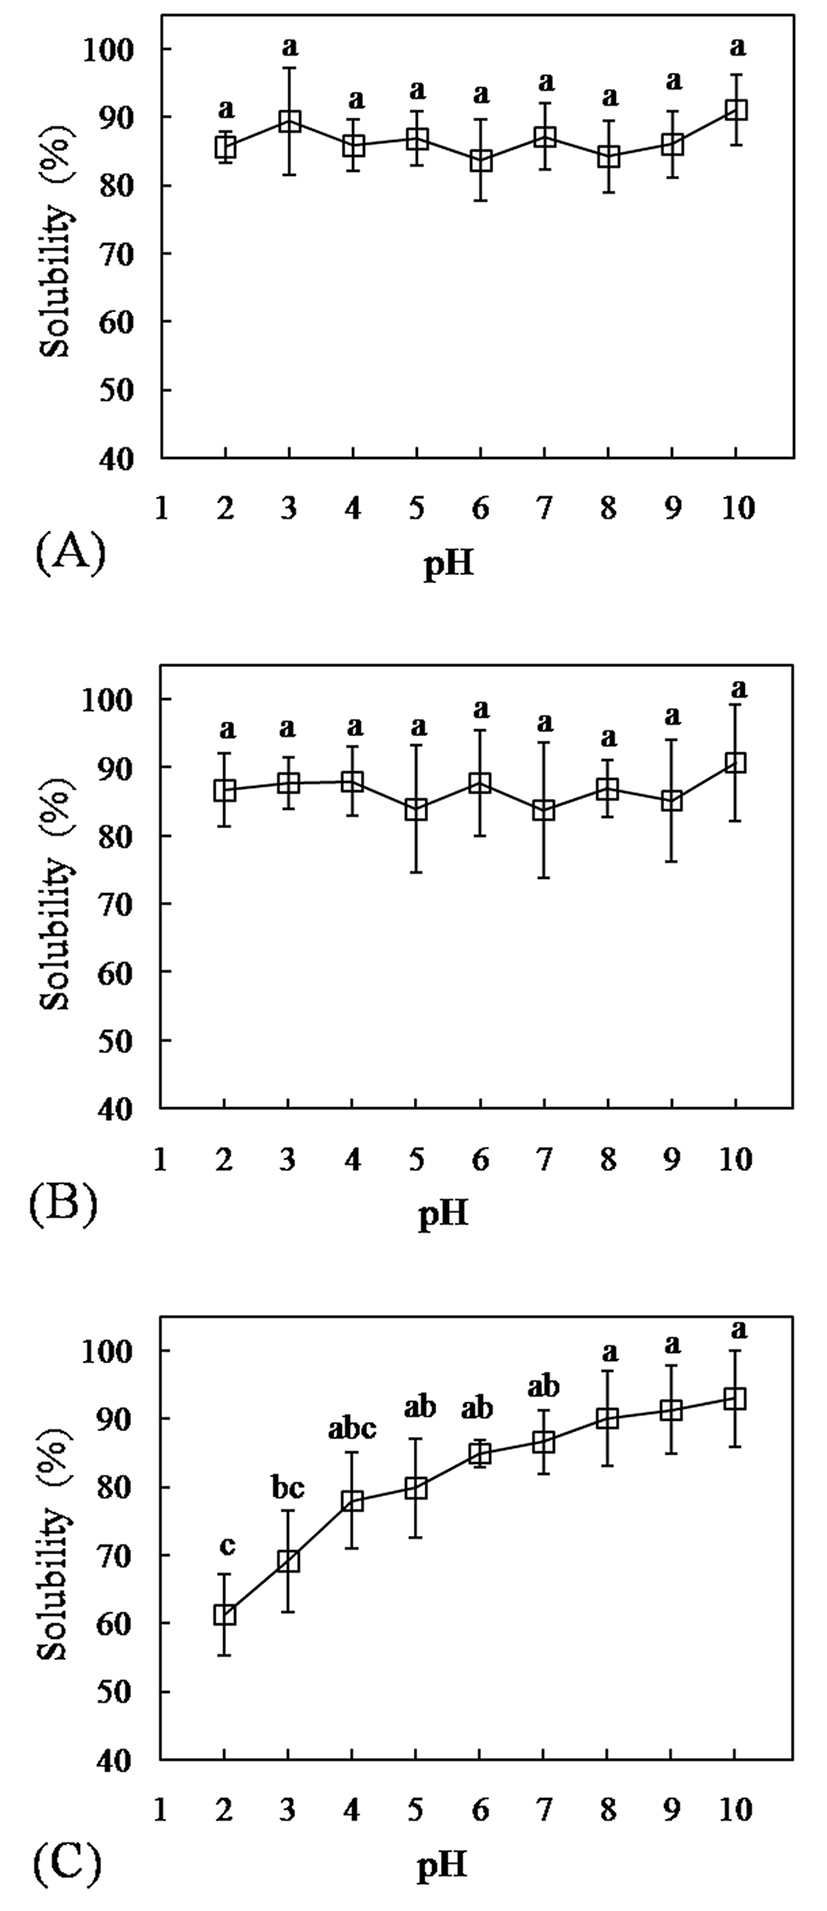
The solubility of blood powders at pH 2-10 is presented in Fig. 2. Porcine and chicken blood showed a similar trend concerning solubility with value in the range of 83-91%. (Fig. 2A and 2B). Differently, duck blood exhibited lower protein solubility at pH 2 and 3 as compared to other samples (Fig. 2C). Most studies on the functional attributes of the blood proteins were usually carried out on whole plasma and hemoglobin fractions. For example, Del Hoyo et al. (2008) stated that solubility of porcine plasma is quite high ranging from 68 to 80% at pH between 3.0 and 8.0, with a very slight effect of pH. Regarding hemoglobin, its solubility varied in the range of 75-95%, with the lowest value corresponding to pH 5.0 (Álvarez et al., 2009). However, blood samples in present study were not tested on their fraction, so the presence of several proteins compositing in blood could be responsible for modifying the solubility profiles. Protein solubility is dependent on several intrinsic factors such as amino acid composition and amino acid sequence (Hettiarachchy, 2012). Consideration of correlation analysis between solubility at different pH and amino acid composition as summarized in Table 5, solubility of blood at pH 2 and 3 had positive correlation with proline (r=0.897, p<0.01 and r=0.859, p<0.01, respectively) and serine (r=0.822, p<0.01 and r=0.741, p<0.05, respectively). Additionally, the glycine content had a positive correlation with solubility at pH 2 (r=0.680, p<0.05) and tended to correlate with solubility at pH 3 (r=0.634, p<0.07). It was shown that a higher content of these amino acids in blood samples (porcine and chicken blood) allowed an easy solubilization in acidic condition. The solubilities of amino acids in water are highly variable in which proline possesses its highest solubility in water (162.3 g/ 100 g H2O at 25°C), followed by glycine (24.99 g/ 100 g H2O at 25°C) as compared to other amino acids (Belitz et al., 2009). Among the hydrophilic amino acids, serine contributes more favorable solubility in water (5.02 g/ 100 g H2O at 25°C) than the other hydrophilic amino acids (Belitz et al., 2009). The wide range of obtained results on solubility at different pH informed a good indication of the potential application of sample, because it influences on other functional properties.
*Correlation is significant at p<0.05. **Correlation is significant at p<0.01.
S2, S3, S4, S5, S6, S7, S8, S9 and S10 = Solubility at pH 2, 3, 4, 5, 6, 7, 8, 9 and 10, respectively. EAI5, EAI10 and EAI20 = Emulsion activity index of protein concentration at 5, 10 and 20 mg/mL, respectively. ES5, ES10 and ES20 = Emulsion stability of protein concentration at 5, 10 and 20 mg/mL, respectively. FE5, FE10 and FE20 = Foam expansion of protein concentration at 5, 10 and 20 mg/ml, respectively. FS5, FS10 and FS20 = Foam stability of protein concentration at 5, 10 and 20 mg/mL, respectively.
The differences in textural characteristics of blood gels among species during heating were observed (Fig. 3A-3F). At 70°C, chicken blood showed the most rapid response to form gels, followed by duck and porcine blood, respectively (Fig. 3A). Heating at 70°C for 30 min resulted in a stronger gel with a higher hardness value of chicken blood as compared to duck blood, while porcine blood started to form a soft gel at 70°C for 60 min. Thereafter, as the time increase, the gel strength of chicken and duck blood tended to increase, while hardness value of porcine blood gel remain unchanged. With increasing temperature to 80°C, the hardness value of duck blood gel was largely increased as the heating time increased (p<0.05) (Fig. 3B). Boiled duck blood at 80°C for 90 min could provide a hard texture (3.40±0.12 N) similar to chicken blood gel (3.34±0.13 N) (p>0.05). As expected, when heating at 90°C, the maximum gel strength of chicken and duck blood were achieved within 60 min, and their gel hardness was similar (around 4.84-5.18 N) (Fig. 3C). Unlike blood from poultry, porcine blood required a minimum temperature of 90°C for 45 min for the formation of a self-supporting porcine blood gel (approximately hardness value > 2 N) as shown in Fig. 3G. Moreover, the maximum gel strength of porcine blood gel was perceived by heating at 90°C for 90 min (~4.15 N). In porcine and bovine plasma, the gel strength increased with increasing heating temperature of gels from 72 to 92°C probably due to an increase in density and the formation of larger aggregates of protein (Zayas, 1997). Concerning on springiness value, the gel obtained from porcine blood showed a higher elasticity during heating at 80 and 90°C than avian blood (p<0.05) (Fig. 3E and 3F).
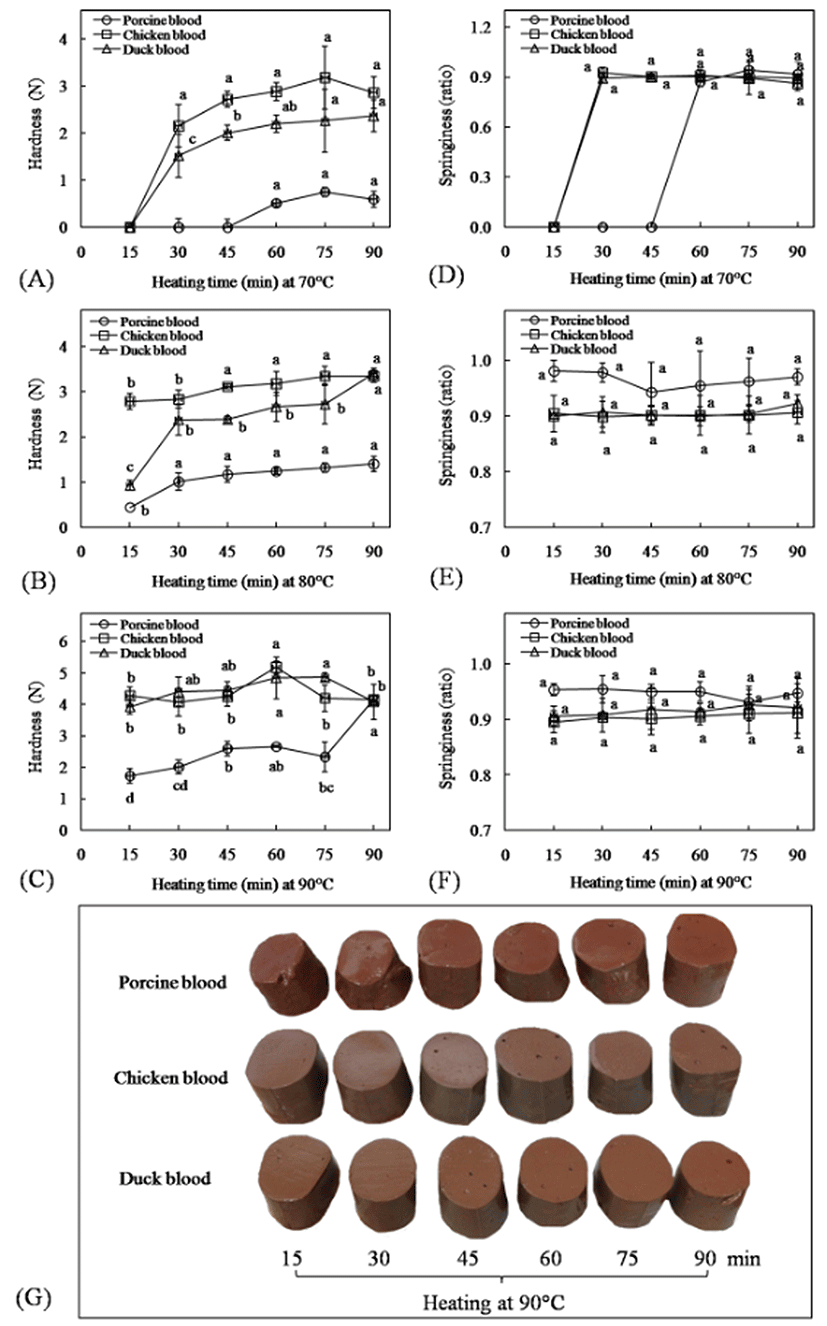
The results of textural characteristic suggested that chicken blood showed the most rapid response to form gels, followed by duck and porcine blood, respectively. The formation of a three-dimensional network, a gel system, in the present of adequate environmental condition, results from the unfolding or denaturation of protein molecules upon heating, followed by the aggregation reactions (Zayas, 1997). However, there were no significant differences in an endothermic peak of samples (100 mg/mL of dried sample solubilized in distilled water) during heating by differential scanning calorimetry, which showed the endothermic peaks between around 60°C and 100°C with the temperature of maximum heat flow (Tp) was approximately 78-82°C (data not shown). The result implied that protein molecules in blood samples should undergo denaturation and unfold during heating with the similar level. Thus, the differences in texture of gels among blood species might be related to their protein aggregation. The formation of aggregates via non-covalent interactions of hydrophobic surfaces, thiol/disulfide exchange reactions and electrostatic interactions of charged groups occur on the surface may occur simultaneously after the partial unfolding of the protein diminishing gel quality (Ockerman and Hansen, 2000; Wang et al., 2010). In the present study, the correlation between hydrophobic amino acids or proximate compositions or hematological parameters and hardness values at various heating conditions were not observed (p<0.05). Surprisingly, there was a significant positive correlation between hardness and Fe or Zn at all heat treatments, except for a period of 15-45 min at 70>°C, which shown coefficient values (r) range from 0.683-0.984. The generally accepted argumentation on the divalent metals role in protein aggregation is based on their ability to act as bridges between the negatively charged groups of the neighboring protein molecules (Navarra et al., 2009). Moreover, Tseng et al. (1998) found that the higher endogenous clotting enzyme activity, transglutaminase (TGase), in duck blood rather than porcine blood contributed the increased breaking strength of duck blood curd. The ability of TGase to cross-link different proteins has been generally known for over two decades and some of this enzyme used was purified from mammalian sources such as bovine plasma (Kurth and Rogers, 1984). Therefore, in the case of porcine blood gels, a higher temperature above Tp may be required for accelerating protein aggregation, might be because of the low content of surface hydrophobicity and their endogenous bridging ions as well as blood clotting enzyme. However, for appropriated condition, at 90°C for 90 min, porcine blood could form a strong gel with similar gel hardness to chicken and duck blood, but a slower aggregation of this sample allowed to form an elastic gel in comparison to other gels. On the contrary, the formation of large aggregation, particularly in chicken blood, probably brought about a hard (high hardness value) and brittle texture (low springiness value). The differences in gelation among animal blood samples could provide a unique texture of blood curd or blood tofu that are a traditional food in China, Thailand, Vietnam and other countries close to the Chinese border, where it made from a mixture of fresh blood and water and coagulated by heat.
There was a converse relationship between blood concentration and EAI as reported in Fig. 4A. All blood powders showed that the amount of fat emulsified per unit of protein decreased as the protein in the system increased, indicating increased emulsifying efficiency at low protein concentration (p<0.05). This behavior can be observed in other protein such as sodium caseinate and whey protein concentrate, possibly due to self-aggregation of protein at high concentration (Ye, 2008). Comparatively among blood, a higher EAI was obtained from chicken blood rather than porcine and duck blood (p<0.05). Additionally, chicken blood at the concentration of 0.5% exhibited a higher ESI than other species (p<0.05) (Fig. 4B). This evident might be result from the differences in intrinsic property of protein among samples in which Hettiarachchy (2012) stated that the emulsification and emulsion stability of protein was mainly governed by three factors: (1) electrostatic repulsion caused by some of the charged amino acid residues in the adsorbed protein molecule at interface, (2) the steric hindrance via the hydrophilic amino acid residues affinity to water and (3) viscoelastic properties of the protein films absorbed at the oil-water interfaces. Consideration for correlation among tested parameters, regardless effect of protein content and its constituent, there was a significant correlation among threonine content and EAI at the concentration of 0.5% or 1.0% (r=0.750, p<0.05 and r=0.947, p<0.01, respectively) (Table 5). Moreover, a significant correlation was also found between threonine content and ESI at the concentration of 0.5% (r=0.712, p<0.05) (Table 5). Threonine is polar amino acid, hydrophilic uncharged side chain with a hydroxyl group and its hydration property was 2 moles of water per mole of amino acid (Hettiarachchy, 2012). The higher content of this amino acid in chicken blood might partly support the steric hindrance effect via binding of water and structuring of the water molecules around this side chain and then express superior emulsifying property than pork and duck blood. Blood proteins have good emulsifying properties and can adequately replace casein and egg in emulsified meat system, especially in low salt meat products (Ofori and Hsiech, 2013). A superior of such properties were found in chicken blood than in pork and duck blood would be a benefit for processing of blood sausage, where the black color is expected and acceptable.
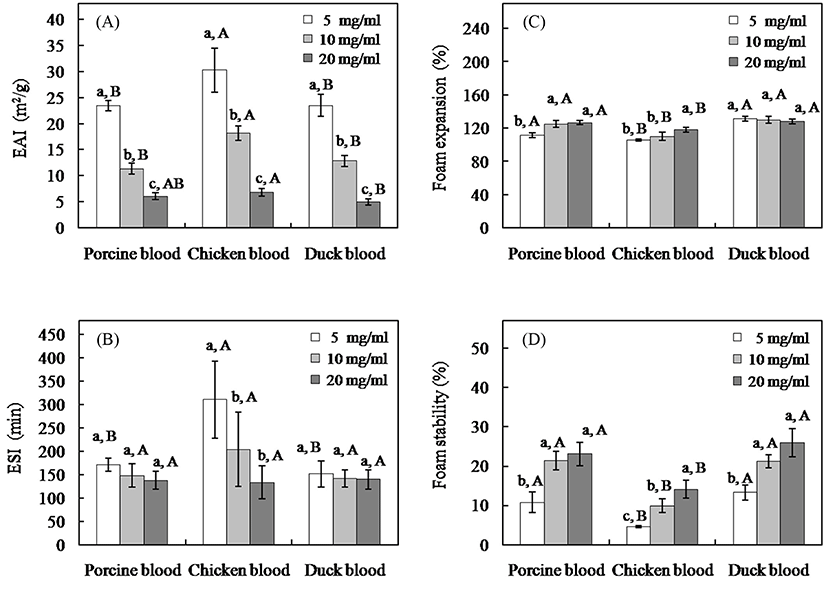
The FE and FS were seemly enhanced by high protein concentration (Fig. 4C and 4D), as high protein concentration increases the viscosity and facilitates the formation of a multilayer, cohesive protein film at the interface (Damodaran, 1997). At the same concentration, pork and duck blood had higher FE and FS than chicken blood at any tested concentration (p<0.05). The basic function of proteins in foams is to decrease air-water interfacial tension, to increase viscous and elastic properties of the liquid phase and to form strong films (Zayas, 1997). Protein molecules can unfold to a certain degree and reorient at the interface with polar groups exposed towards water phase and the non-polar groups towards the air phase (Wierenga and Gruppen, 2010). Zayas (1997) summarized that there was a report of a positive correlation between the content of hydrophobic amino acids and the foaming properties of proteins. In the present investigation, some hydrophobic amino acid in blood, alanine, was correlated with improved foaming properties, which significant correlation between this amino acid and FE or FS among samples were observed (r=0.796-0.888, p<0.05) (Table 5). Moreover, the influences of plasma components on foaming capacity and related food product have been reported (Raeker and Johnson, 1995; Vuono et al., 1979). Vuono et al. (1979) found that among blood components, globin showed the highest foaming capacity followed by albumin, globulin and plasma. Raeker and Johnson (1995) noted that the separating fibrinogen from plasma increased cake volume. Therefore, the differences in these proteins among blood might be also related to their foaming properties. A higher foaming behavior of porcine and duck blood rather than chicken one might be practical means of improving the foaming dependence products such as blood cake, bread and biscuits that are usually consumed in Europe and Asia (Liu, 2002).
Conclusion
Species-specific hematology among blood samples was observed in which higher RBC, hemoglobin, and plasma protein contents with a smaller RBC size were found in porcine blood as compared to chicken and duck blood. The porcine blood seemed to be less nutritive amino acid composition than avian blood due to a larger deficiency in isoleucine, but it was rich in heme iron content that related to higher hemoglobin content rather than avian blood. Based on functional properties, the chicken blood exhibited a superior gelation and emulsion properties, but was quite lower foaming properties as compared to duck and porcine blood.