


Introduction
Rabbit meat offers excellent nutritive and dietetic properties (Hernández and Gondret, 2006) and is characterized by very low monounsaturated fatty acids (MUFA) levels, high levels of polyunsaturated fatty acids (PUFA) and n-3 fatty acids (FAs). Compared with other animal meats, rabbit meat has lower fat levels. Rabbit meat can be used to produce specific functional food, since its good composition (e.g., fatty acid profile, mineral, and vitamin contents) (Dalle Zotte and Szendrõ, 2011; Hernández, 2008). Hyla rabbits are imported from France, which has high breeding efficiency. However, limited information is available on the effect of different cooking methods on the content of intramuscular lipid and composition of total intramuscular fatty acid of Hyla rabbit.
Fat content and fatty acid composition of meat are of major importance for consumers due to their importance for meat quality and nutritional value (Wood et al., 2004). The nutritional value of muscle is determined primarily by the ratio between SFA and PUFA in meat and the balance between fatty acids of the n-6 and n-3 series (Wood et al., 2004). Major groups of fatty acids based on the number of double bonds include MUFA and PUFA. Expert consultation recognised that individual fatty acids within each broad classification of fatty acids might have unique biological properties and health effects (Hosseini et al., 2014). It is evident that The UFA, especially PUFA are highly susceptible to oxidation, and the PUFA are more susceptible to oxidation during heating than their saturated analogues (Alfaia et al., 2010), thus oxidation reactions could be very important during thermal treatment and affect the properties of this type of meat.
To our knowledge, the household cooking methods tested in this project (stewing, microwaving and Al foil-baking) are essential to achieve a palatable and safe product (Tornberg, 2005). In fact, heat treatments applied to meat, improve its hygienic quality by inactivation of pathogenic microorganisms and enhance its flavour and tenderness (Broncano et al., 2009; Rodríguez-Estrada et al., 1997). However, cooking methods as well as cooking conditions, like heating rate, cooking time and temperature, modify the chemical composition of meat with a consequent change of nutritional value due to nutrient losses, especially the fatty acid content (Brugiapaglia and Destefanis, 2012; Clausen and Ovesen, 2005; Kosulwat et al., 2003).
The effects of different cooking methods on intramuscular lipid of Hyla rabbit have not been previously studied. Thus, the aim of this study was to investigate the change of content of intramuscular lipid, as well as the composition of intramuscular fatty acid of Hyla rabbit before and after cooking treatment. Besides, the partial least squares regression (PLSR) was used to analyze the interaction between heating method, heating time and the change of fatty acids.
Materials and Methods
A total of 30 male Hyla rabbits were provided by College of Animal Science and Technology, Southwest University. They were maintained in a closed building under natural environmental conditions in individual wire mesh cages, equipped with metal troughs and automatic nipple drinkers. The rabbits had free access to feed and water. The rabbits were bred under similar production system and slaughtered at the age of 60 d in a local commercial slaughterhouse, and the slaughter weight was recorded as 2.15±0.12 kg. The facilities of the slaughterhouse met the requirements of the Institute of Animal Care and Use Committee. After 24 h post-mortem, the longissimus dorsi muscle (LD) of the carcass was removed and immediately vacuum-packed and frozen at 20℃ until treatment (the cold storage time was less than five days).
The LD samples were thawed and trimmed of visible fat and connective tissue, and each cut into portions approximately 30 × 20 × 20 mm. The samples were divided into four groups (100 g per group), one of which represented as the raw reference, whereas the other groups were randomly cooked by stewing, microwaving and Al foil-baking, respectively. For the stewing treatment, the samples were stewed in water for 3 min (level 1), 6 min (level 2) and 9 min (level 3), respectively. The thickness of Al foil was 0.02 mm. For the microwaving treatment, the samples were cooked in the microwave (2450 MHz) for 1 min (level 1), 2 min (level 2) and 3 min (level 3), respectively. For the Al foil-baking treatment, the samples were baked in an oven (180℃) for 5 min (level 1), 10 min (level 2) and 15 min (level 3), respectively. The Level 3 of the three household cooking methods tested had reached an a final internal temperature of 75℃ as ascertained by an iron-constantan (type J) wire thermocouple connected to a digital potentiometer (Mod. Microtemp2, Eurotron Italiana, S.r.l., Italia). After processing, the cookedsamples were allowed to cool to room temperature for further analysis. Samples of each group were homogenised in a food blender and then distributed into three batches (n=3) to achieve the statistical analysis.
Total intramuscular lipids were extracted according to Folch et al. (1957). Total lipid content was measured by weighing the lipid extracts after solvent evaporation. The total lipids were methylated with boron fluoride-methanol (Sigma Aldrich) according to Morrison and Smith (1964). The fatty acid methyl esters were analyzed by a QP-2010 gas chromatograph (Shimadzu, Japan) equipped with a flame ionization detector and a split injector. One microliter of fatty acid methyl esters was injected in split mode (5:1) onto a Rtx-Wax capillary column (Restek, USA; 30 m × 0.25 mm id × 0.25 μm film thickness). The temperature of the column was programmed as follows: 1 min at 140℃, increments of 8℃/min to 180℃ and held at 180℃ for 2 min; increments of 3℃/min to 210℃; and increments of 5℃/min to 230℃ and held at 230℃ for 10 min. The temperature of the injector and the detector were both 250℃. The flow rate of the carrier gas (N2) was 1.5 mL/min. Fatty acids were identified by comparing the retention time of the samples with those of the standards (Sigma). Results were expressed as percent of the total fatty acid methyl esters.
The Statistical Analysis System (1996) was used to determine the means, standard errors, and analysis of variance. Duncan’s multiple range test was used to compare differences among means. Values at p<0.05 were considered significant.
The effect of cooking methods on the fatty acid composition of total intramuscular lipids were performed by ANOVA-partial least squares regression (A-PLSR). Seven 0/1 indicators variables (raw material, stewing, microwaving and Al foil-baking, level 1, level 2, level 3) in the X-matrix and 21 kinds of fatty acids (C12:0~C22:6n-3 were represented by the number 1~21) in the Y-matrix. Ellipses represent R2=0.5 (50%) and 1.0 (100%). A PLSR was performed using the Unscrambler Software, version 9.7 (CAMO ASA, Norway). All data was centered and standardized before analysis.
Results and Discussion
Table 1 shows the effect of cooking methods on the cooking loss and the content of total intramuscular lipid in LD of male Hyla rabbits. The content of total intramuscular lipid (muscle weight %) were significantly increased after cooking (p<0.05). However, considering the different extent of cooking loss after stewing, microwaving and Al foil-baking, it would be more accurate to use dry matter of the intramuscular lipid (dry weight %) as the metrics. With the increasing of cooking time, the proportion of intramuscular lipid in cooked-LD (dry weight %) were significantly decreased (p<0.05) in all samples. The longer the cooking time was, the higher the degree of reduction was observed.
aResults were expressed as means±SE, data were means of three replicates (n=3).
bValues in the same row with different letters were significantly different (p<0.05).
cSamples were stewed in water for 3 min (level 1), 6 min (level 2) and 9 min (level 3), respectively. For the microwaving treatment, the samples were cooked in the microwave (2450 MHz) for 1 min (level 1), 2 min (level 2) and 3 min (level 3), respectively. For the Al foil-baking treatment, the samples were baked in an oven (180℃) for 5 min (level 1), 10 min (level 2) and 15 min (level 3), respectively.
The percentage of intramuscular lipid in cooked-LD (dry weight %) were in the order mentioned below: microwaving > foil-baking > stewing. Comparing the three cooking methods, microwave showed the lowest influence on the proportion of intramuscular lipid (dry weight %); whilst the greatest influence were found in stewed-sample; the reduction of intramuscular lipid content (dry weight %) in microwaved-sample were relatively flat; while the stewedsample decreased severer with the cooking time increased. In the early stage of the foil-baking (level 1), the proportion of intramuscular lipid decreased more obviously than microwaving and stewing, which may be due to the higher baking temperature (180℃), as well as the longer cooking time (5 min). The adverse effect resulting from thermal treatment is lipid oxidation, which is strongly influenced by temperature and the time of cooking (Byrnea et al., 2002). When different cooking methods were compared, baking, which uses high temperatures for a long time, produces an increased lipid oxidation compared to other methods (Hernández et al., 1999; Rodríguez-Estrada et al., 1997). The microwave treatment, despite using shorter time and lower temperature also promotes lipid oxidation (Rodríguez-Estrada et al., 1997).
The influence of cooking methods (stewing, microwaving and Al foil baking) on the composition of intramuscular fatty acids were showed in the Table 2-4, respectively. The cooking methods and cooking time (level) had significant impact on the composition of intramuscular fatty acids of the samples in all tables. After cooking, the PUFA and MUFA proportion of LD decreased significantly (p<0.05), corresponding to the significant increase of SFA in the cooked-LD (p<0.05). Among them, Al foil-baking caused the maximum increase of the SFA proportion, while the microwaving minimum. Considering the variations of UFA (the sum of PUFA and MUFA), the microwaving treatment was more conducive to keep the stability of UFA than the other two cooking methods, while the long-time Al foil-baking did the most serious damage to UFA, especially the PUFA.
aResults were expressed as means±SE, data were means of three replicates (n=3).
bValues in the same row with different letters were significantly different (p<0.05).
cSFA, total saturated fatty acids; MUFA, total monounsaturated fatty acids; PUFA, total polyunsaturated fatty acids.
aResults were expressed as means±SE, data were means of three replicates (n=3).
bValues in the same row with different letters were significantly different (p<0.05).
cSFA, total saturated fatty acids; MUFA, total monounsaturated fatty acids; PUFA, total polyunsaturated fatty acids.
aResults were expressed as means±SE, data were means of three replicates (n=3).
bValues in the same row with different letters were significantly different (p<0.05).
cSFA, total saturated fatty acids; MUFA, total monounsaturated fatty acids; PUFA, total polyunsaturated fatty acids.
For the palmitic acid (C16:0) and stearic acid (C18:0) profiles, they were the most important SFA found in cooked-LD, and the increasing extent of C16:0 and C18:0 in stewed- and baked- samples were significantly greater than that in microwaved-sample (p<0.05). The MUFA profile of palmitoleic acid (C16:1n-7) and oleic acid (C18:1n-9), and the PUFA profile of linoleic acid (C18:2n-6), arachidonic acid (C20:4n-6), eicosapentaenoic acid (EPA, 20:5n-3), docosapentaenoic acid (DPA, C22:5n-3) and docosahexaenoic acid (DHA, 22:6n-3) were significantly decreased (p<0.05), which account to the dynamic changes of MUFA and PUFA. For the C18:2n-6 portion, the decreasing extent of C18:2n-6 in baked-sample were significantly higher than that in microwaved- and stewed- samples (p<0.05). Besides, the C18:1n-7 proportion decreased significantly in the stewed-sample; the microwaving treatment can reduce the proportion of C20:2n-6 more obviously; the Al foil-baked sample had lower proportion of C17:1 and C18:3n-3, but higher C15:0.
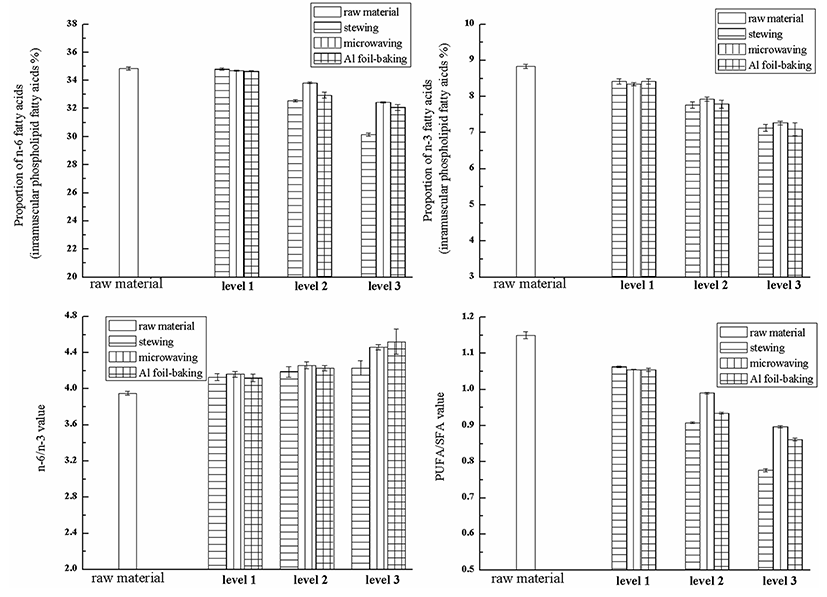
The SFA have been recognized by the international dietary authorities as primary targets for diet reduction (WHO, 2003). In contrast, an increase in the PUFA content, especially n-3 PUFA at the expense of n-6 PUFA, may have a noticeable knock-on effect on public health improvement (British Department of Health, 1994). It is well known that the low PUFA/SFA and high n-6/n-3 ratios of some meats contribute to the imbalance in the fatty acid intake of today’s consumers (Wood et al., 2004). The degradation of intramuscular fatty acids of Hyla rabbit under different processing conditions was showed in Fig. 1. The increasing of n-6/n-3 value, and the decreasing of n-6 PUFA, n-3 PUFA and PUFA/SFA value were observed. The influence of stewing treatment on the proportion of n-6 and n-3 FAs, as well as the n-6/n-3 value was less than the other two methods, while the influence of microwaving treatment on the PUFA/SFA value was less than stewing and baking. As for the Al foil-baking treatment, it did the greatest damage on the PUFA/SFA value and the n-6 PUFA, especially the proportion of C18: 2n-6 and C20:4n-6, which may be due to the severe baking conditions with higher temperature and longer time, resulting in the fatty acid oxidation. Stewing, microwaving and foil-baking changed the n-6/n-3 values of raw material (8.00) to 8.41-8.75, 8.63-9.17, 8.56-9.06, respectively. After cooking, the largest increasing extent of n-6/n-3 value was found in the micromaved-sample, this may because of the greater damage of n-3 PUFA than the n-6 PUFA. According to FAO/WHO, the recommended ratio of essential PUFA in a healthy daily diet was 5/1 to 10/1 (n-6/n-3). Nutritional value is determined primarily by the ratio between SFA and PUFA in meat and the balance between fatty acids of the n-6 and n-3 series. Besides, a lower ratio is more desirable in reducing the risk of many chronic diseases. The optimal ratio varies depending on the disease under consideration (Simopoulos, 2002). Therefore, the cooked-LD of Hyla rabbits may still have excellent fatty acid profile and potential nutritive value.
The PLSR aims to find out the variables and directions in the multivariate space which discriminate the established classes in the calibration set. Using this algorithm, one can build a dummy binary-coded response vector, so that, if a sample belongs to class one, it will have a “1” as the first component and the remaining components will be zero. If it belongs to class two, it will have a “1” as second component, while the remaining will be zero, and so on. Until these assumptions, compute a classification model corresponds to calculating the regression vector between the data matrix and the dummy vector of responses. The result is a linear model that has proven to be statistically equivalent to the solution obtained to Linear Discriminant Analysis (Marini, 2010). This method has been applied in discriminating low-fat and full-fat yogurts (Cruz et al., 2013), as well as the discrimination of Brazilian artisanal and inspected pork sausages (Matera et al., 2014).
The analysis of PLSR on the composition of intramuscular fatty acids in cooked-LD of Hyla rabbit was showed in Fig. 2. After different processing, the composition of fatty acids changed significantly, compared with the raw sample. The analysis of PLSR showed that the first and second main ingredients explained Y variables as 88% and 8%, respectively. Therefore, difference in composition of intramuscular fatty acids affected by heating method and heating time were mainly explained by the first principal component (PC1), and the heating method showed greater influence on the samples than the processing time.
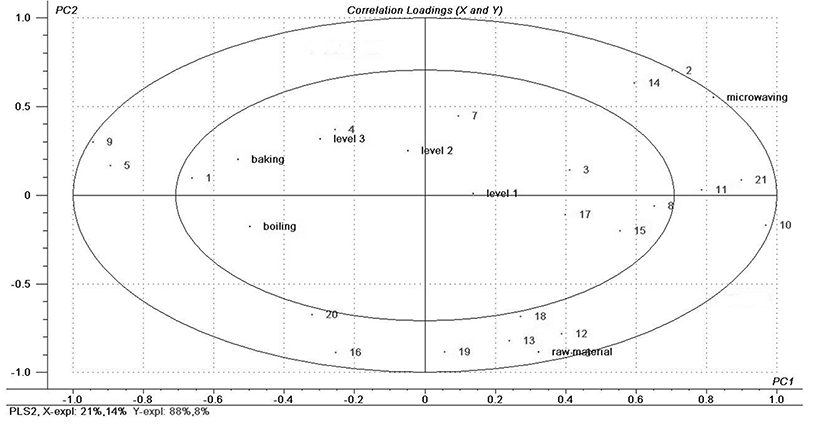
As shown in the Fig. 2, on the first principal component, the “microwaving” (microwaved-sample) and the raw material were all in the right of the rendering, and they were closer with each other in the PC1, indicating that the microwaving treatment was more conducive to preserve the raw composition of intramuscular fatty acid than the stewing and Al foil-baking. The majority UFA of intramuscular lipid were located in the bottom right of the rendering, especially the LC-PUFAs (C20-22), which were related to the raw material and microwaved-sample closely, indicating that the proportion of these fatty acids changed significantly under the three treatment, however, the microwaving did the less influence, followed by stewing and Al foil-baking.
Besides, the raw material and short-time-cooking samples (level 1) were all located in the right of the rendering, so the influence of short-time-cooking on the composition of fatty acids was smaller than the long-time-cooking (level 2 and level 3). The cooked-samples contained more PUFA (e.g., 17(C20:3n-6), 18(C20:4n-6), 19(C20: 5n-3)) and MUFA (e.g., 3(C14:1n-6), 8(C17:1n-7), 15(C 20:1n-9)) in level 1 than that in level 2 and level 3. However, long-time-cooked samples (level 2 and level 3) located in the left of the rendering, which were far away from the raw material in the PC1, affected the composition of fatty acids in larger extent. The long-time-cooked samples were closely related to the majority of SFA (e.g., 4(C15: 0), 7(C17:0)) during this cooking stage. Therefore, the shorter processing time was more conducive to retain the intramuscular PUFA of Hyla rabbit, especially the LC-PUFAs (C20-22). With the increasing of cooking extent, the significantly decreasing of PUFA in total intramuscular lipid was observed. According to the above, compared the three cooking methods, microwaving showed the relatively superiority in reserving the composition of intramuscular fatty acid, especially the content of PUFA profiles, while the Al foil-baking did the most serious damage to the intramuscular UFA, especially the long chain PUFA profiles, which may be due to the higher baking temperature (180℃), as well as the longer cooking time.
Conclusions
The cooking methods of stewing, microwaving and Al foil-baking showed significant influence on the content of intramuscular lipid, as well as the composition of intramuscular fatty acid of Hyla rabbit. Comparing the three cooking methods, microwaving treatment showed the superiority in reserving the intramuscular lipid and the UFA profile (especially the PUFA) of Hyla rabbit, while the long-time Al foil-baking did the most serious damage on the samples. The heating time was longer, the damage was more obvious. Anyway, all of the cooked Hyla rabbit products were within the recommended n-6/n-3 ratio of intramuscular fatty acids.