


Introduction
As society progresses, consumer preference for meat has evolved from focusing solely on quantity to prioritizing quality (Henchion et al., 2014). Specifically, the growing demand for better tasting and quality pork has led to increased research efforts to develop high-quality pork (Becker et al., 2013). Understanding how genetic differences affect meat-quality traits is critical.
Jeju native pig (JNP) is a livestock breed traditionally raised in Jeju and is one of the indigenous breeds representing Korean native pigs that has been preserved without crossbreeding with external breeds (Han et al., 2010). JNP has adapted well to the climate and environment of Jeju, demonstrating robustness (Kwon et al., 2001), and possesses unique genetic traits owing to its long-term isolation on the island (Cho et al., 2009; Cho et al., 2011). Although JNP has the disadvantages of lower growth rates and litter sizes compared to other commercial breeds (e.g., Landrace, Duroc, and Yorkshire), it is known for its firm fat, red meat color, rich juiciness, and high intramuscular fat content, which contribute to a higher consumer preference for JNP pork (Cho et al., 2011; Cho et al., 2019). Therefore, comparative genomic studies between JNP and other commercial pig breeds are necessary to understand the unique genetic traits of JNP and to produce better-quality pork.
Meat quality is closely related to skeletal muscle structure, metabolic characteristics, and muscle fiber properties (Herault et al., 2014; Kim et al., 2013b). In this study, gene expression analysis was conducted using RNA sequencing (RNA-seq) of muscle tissues from Landrace and JNP pigs to understand the differences in meat quality traits between the two breeds and produce high-quality pork. RNA-seq technology is a valuable tool in quantitative gene expression research, providing biological information and helping to identify causative variants underlying complex trait changes (Hudson et al., 2012). This technology allows the comparison of gene expression changes under various conditions by analyzing the transcriptome. Proper analysis of the data obtained from this process is crucial to ensure the reliability of the results and accurately understand the physiological mechanisms of an organism (Yendrek et al., 2012).
Therefore, this study aimed to investigate the differences in gene expression between Landrace and JNP pigs using RNA-seq analysis to elucidate the muscle characteristics of JNP and to identify major genetic factors related to economically significant traits. We hypothesized that differences in meat quality and productivity between these breeds may be due to variations in gene expression patterns. This study aimed to gain a deeper understanding of how variations in gene expression patterns affect muscle growth, meat quality, and other physiological traits. These findings will provide crucial foundational data for improving pig breeds and developing production strategies.
Materials and Methods
This study used eighteen pigs, including nine Landrace pigs (five males and four females) and nine JNP pigs (three males and six females), all of which were raised at the experimental farm of the National Institute of Animal Science, Jeju, Korea. The piglets were weaned at 21 days of age and provided ad libitum access to food and water. All male pigs were castrated. For the analysis, the pigs were slaughtered after being held for 2 h in a lairage following transport to the slaughterhouse. Longissimus dorsi samples were collected from the left side of the carcass, which had been chilled for approximately 18 h in a 0°C carcass cooling room after slaughter. The average age of the Landrace pigs and JNP was 173.89±1.11 and 280.33±25.33 days, respectively. The carcass weight for the Landrace pigs and JNP was 78.22±14.22 and 83.72±24 kg, respectively. All experiments were conducted under identical environmental conditions. Longissimus dorsi muscle samples were collected after slaughter from the same commercial slaughterhouse (Jeju Livestock Cooperative, Jeju, Korea) for meat quality analysis. All animal experiments were approved by the Institutional Animal Care and Use Committee (IACUC) of the National Institute of Animal Science and the study was conducted in accordance with the committee guidelines (Approval Number: NIAS2020469).
The proximate analysis of longissimus dorsi samples was performed using AOAC (2002) methods specific crude moisture, crude fat, crude protein, and crude ash contents determination. The crude moisture and crude fat content were measured using a CEM automatic extraction device (Labwave 9000/FAS 9001, CEM, Matthews, NC, USA). The crude protein was analyzed using a Kjeltec System (Kjeltec Auto 2400/2460, Foss Tecator AB, Hoganas, Sweden). The crude ash content was measured using an ash analyzer (MAS 7000, CEM). The pH was measured by mixing 9 g of the sample with 21 mL of distilled water, grinding the mixture, and then using a pH meter (Orion Star A211, Thermo Fisher Scientific, Waltham, MA, USA). The meat color was measured by exposing the cut surface to air for approximately 30 min after cutting the muscle, and the values of CIE L*, a*, and b* were measured three times using a chromameter (CR-400, Konica Minolta, Osaka, Japan) and the average value was applied. The standard color plate used was a white tile of Y=92.40, x=3,136, and y=0.3196, and was measured using the color difference of the sample. Cooking loss (%) was calculated by cutting the sample into 3.0 cm thick steaks, placing it in a constant-temperature water bath (Model WSB-45, Dehan Scientific, Wonju, Korea) at 80°C until the core temperature of the sample reached 70°C, cooling it in running water for 30 min, removing any moisture remaining on the surface of the muscle sample, and measuring the weight. The difference in weight before and after heating was calculated as a percentage. The shear force was measured using a sample that had undergone cooking loss measurement. The samples were collected parallel to the direction of the muscle fibers using a diameter of 1.27 cm and then measured using a texture analyzer (5543, Instron, Norwood, MA, USA) equipped with a Warner–Bratzler shear blade. To measure the shear force, the sample was cut perpendicularly to the direction of the muscle fibers. The load cell was 50 kg, and the crosshead speed was 400 mm/min (Wheeler, 2001). Texture profile analysis (TPA) measurements were conducted according to the de Huidobro method (de Huidobro et al., 2005). For the TPA measurements, the unheated longissimus dorsi muscles were shaped to a certain size (5×5×5 cm). Subsequently, the samples were compressed twice to 70% of the center of the sample at a speed of 1 mm/s using a universal testing machine (Load cell: 500 N; Instron) equipped with a cylindrical probe with a diameter of 1 cm. The texture measurement results were calculated for hardness, cohesiveness, springiness, gumminess, and chewiness.
To analyze the meat quality phenotypic data collected from the longissimus dorsi muscle, R statistical software (v4.2.2, https://www.R-project.org/) was used. For each dataset, the normality of each dataset was evaluated using the Shapiro-Wilk test. If normality was confirmed, the equality of variances between groups was tested using an F-test. For datasets with equal variances, an independent two-sample t-test was conducted to compare the mean values between the two groups. In cases where equal variances were not assumed, Welch’s t-test was applied. For datasets that did not meet the assumption of normality, the Mann-Whitney U test was employed as a non-parametric alternative to compare the two groups.
Longissimus dorsi muscles were stored in a –80°C ultra-low temperature freezer until RNA isolation. RNA was isolated using the RNeasy Mini Kit (Qiagen, Hilden, Germany) according to the manufacturer’s instructions. The concentration and purity of the extracted RNA were measured using a NanoDrop ND-2000 spectrophotometer (Thermo Fisher Scientific). The RNA had an A260/280 ratio of 1.8–2.0 and an A260/A230 ratio of 2.0–2.6.
The RNA isolated from each sample was used to independently prepare libraries according to the manufacturer’s instructions for the Illumina TruSeq Stranded Total RNA Library Prep Globin Kit (Illumina, San Diego, CA, USA). Libraries were quantified using KAPA Library Quantification kits for Illumina Sequencing platforms according to the Quantitative Real-Time Polymerase Chain Reaction (qPCR) Quantification Protocol Guide (#KK4854, Kapa Biosystems, Wilmington, MA, USA), and their quality was verified using TapeStation D1000 ScreenTape (#5067-5582, Agilent Technologies, Santa Clara, CA, USA). Indexed libraries were subjected to Illumina NovaSeq (Illumina) and paired-end (2×100 bp) sequencing was performed at Macrogen.
The quality of the raw data was checked for total read bases (bp), read bases, GC (%), AT (%), Q20 (%), and Q30 (%) using the fastQC program (v0.12.0, https://www.bioinformatics.babraham.ac.uk/projects/fastqc/). Low-quality reads were removed using Trimmomatic (v0.39) and the trimmed reads were rechecked using fastQC. The trimmed data were then mapped to the pig reference genome using Hisat2 (v2.2.1) software. The reference genome assembly used was Sscrofa11.1 (GCA_000003025.6) from the National Center for Biotechnology Information (NCBI). The data mapped in SAM format was converted into a BAM file using Samtools (v1.17). The converted BAM file was then analyzed for gene expression quantification using the featureCounts (subread - 2.0.6) software. When performing feature counts, the reference annotation file used was Sscrofa11.1 (GCF_000003025.6) from NCBI. The quantified gene read counts were used as data for differentially expressed genes (DEG) analysis.
DEG analysis was performed on the read count data obtained from the featureCounts program using the EdgeR of Bioconductor package (v3.40.2) in R to identify differences between Landrace and JNP. Data normalization was performed using the Trimmed Mean of M-values method to identify DEGs. The adjusted false discovery rate (FDR) was determined using the Benjamini–Hochberg method. After that, DEGs with FDR<0.01 and Log2 fold change (Log2 FC)≥2 were identified. DEGs were divided into upregulated and downregulated genes according to their Log2 FC values. The identified DEGs were used for subsequent analyses.
Enrichment analysis of Gene Ontology (GO) and Kyoto Encyclopedia of Genes and Genomes (KEGG) pathway were conducted using the Database for Annotation, Visualization and Integrated Discovery (DAVID, https://davidbioinformatics.nih.gov/) web tool. Functional enrichment analysis of DEGs identified functions and pathways associated with biological differences in breeds based on Sus scrofa, and GO and KEGG pathways were filtered at FDR<0.05. Furthermore, the DEG results were visualized as networks of functional pathways and biological processes using ClueGO (v2.5.10) and CluePedia (v1.5.10) in the Cytoscape (v3.10.1) environment, and the relationships between genes and their biological functions were analyzed to identify major groups (p<0.05).
Results
The meat quality characteristics of Landrace and JNP were compared. Table 1 shows meat quality traits between Landrace and JNP. JNP exhibited significantly lower values for moisture, CIE L*, cooking loss, shear force, hardness, gumminess and chewiness than those of Landrace. In contrast, crude fat, pH, and CIE a* of JNP were significantly higher than Landrace pigs (p<0.01). There were no significant differences in crude protein, crude ash, CIE b*, cohesiveness, springiness, or gumminess between the two breeds.
We identified the transcriptomes of the longissimus dorsi muscles of the nine Landraces and JNP. An average of ~7.5 Gb of total read bases was generated from 18 samples, and the GC content of the generated transcripts was 48.6%–57.7% and the AT content was 42.3%–51.9%. The Q20 and Q30 percentages were 97.9%–98.6% and 94.3%–95.8%, respectively. The raw statistics of the paired-end data for Landrace and JNP are shown in Table 2. The generated sequences were mapped to the reference genome, and 89.53%–98.16% of the total sequences were mapped to each sample (Table 3).
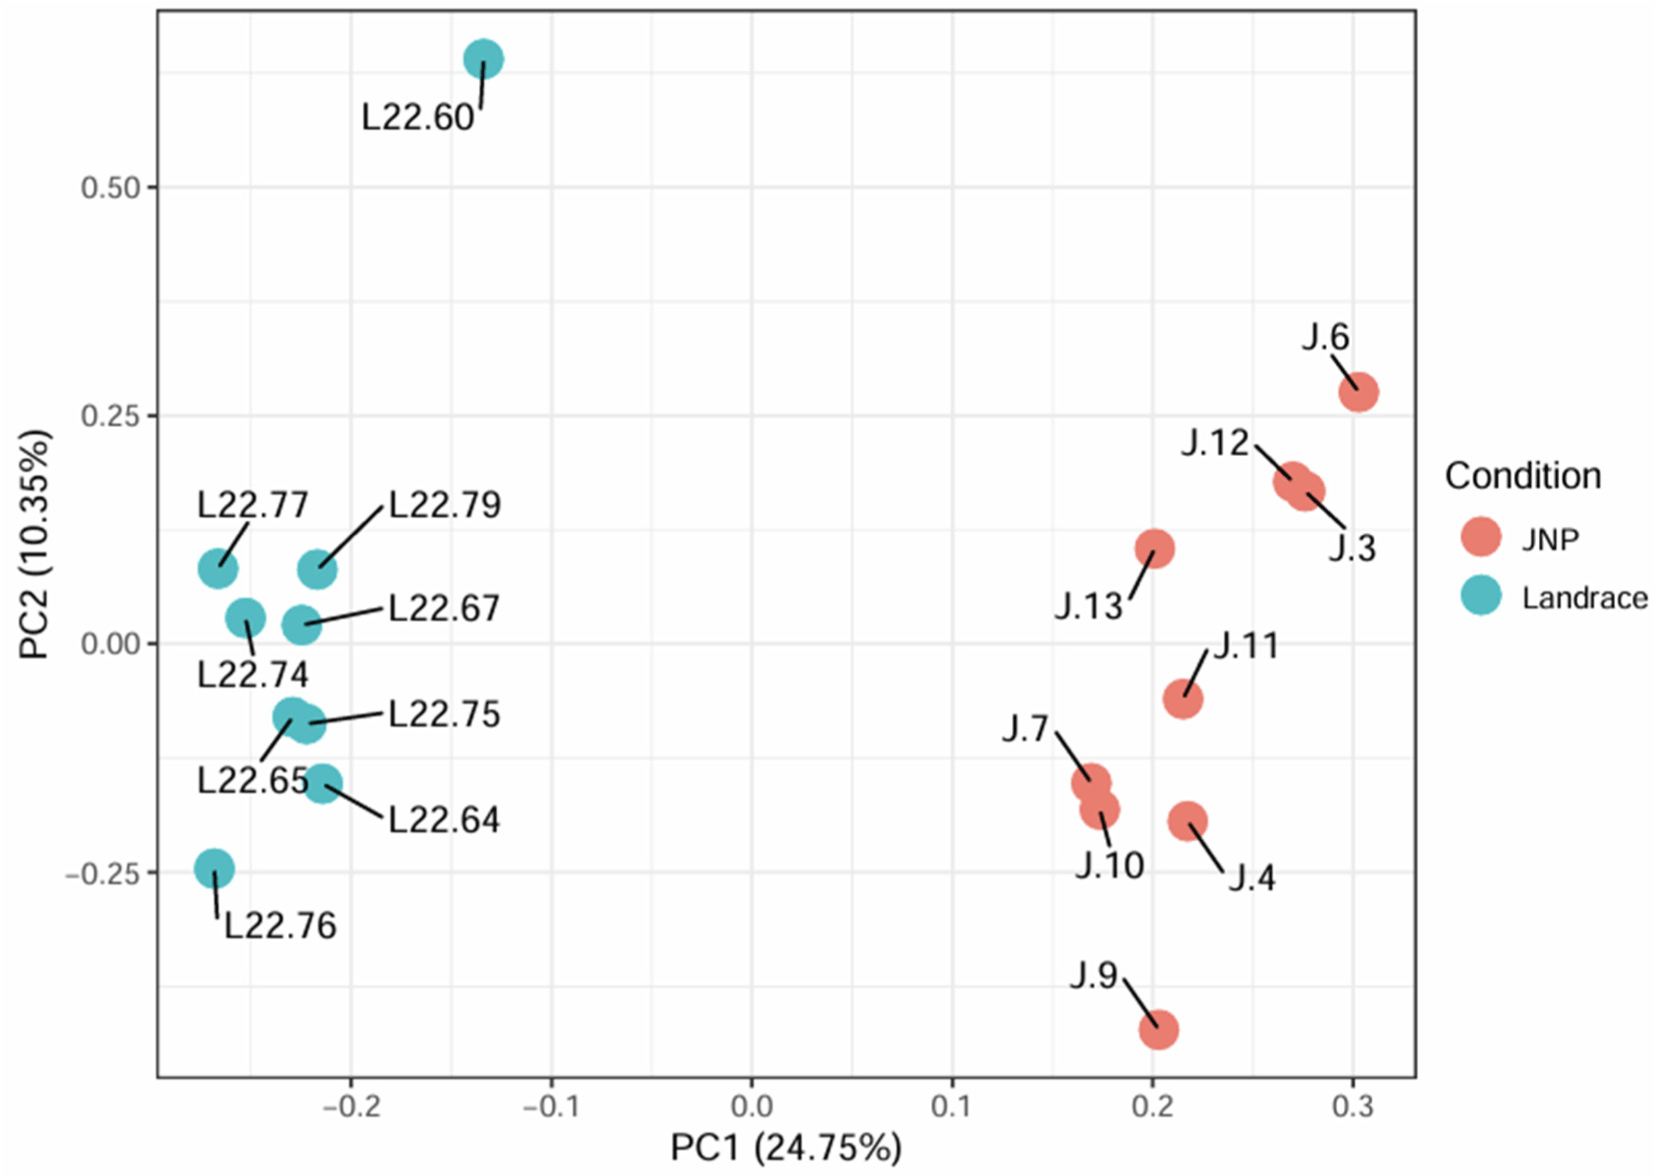
Principal component analysis (PCA) confirmed the distinct differences between Landrace and JNP muscle tissue samples (Fig. 1). Each sample consisted of two principal components (PC1 and PC2) that accounted for 35.10% of the total variability.
The DEGs between the Landrace and the JNP were identified, and 427 and 821 up and down-regulation genes were identified based on log2 FC≥2 and FDR<0.01 (Fig. 2). Among the DEG, there are 837 protein-coding genes, 352 IncRNAs, 6 miRNAs, 8 C_regions, 3 misc_RNAs, 8 rRNAs, 8 transcribed pseudogenes, 6 tRNAs, 24 V_segments, and 1 other.
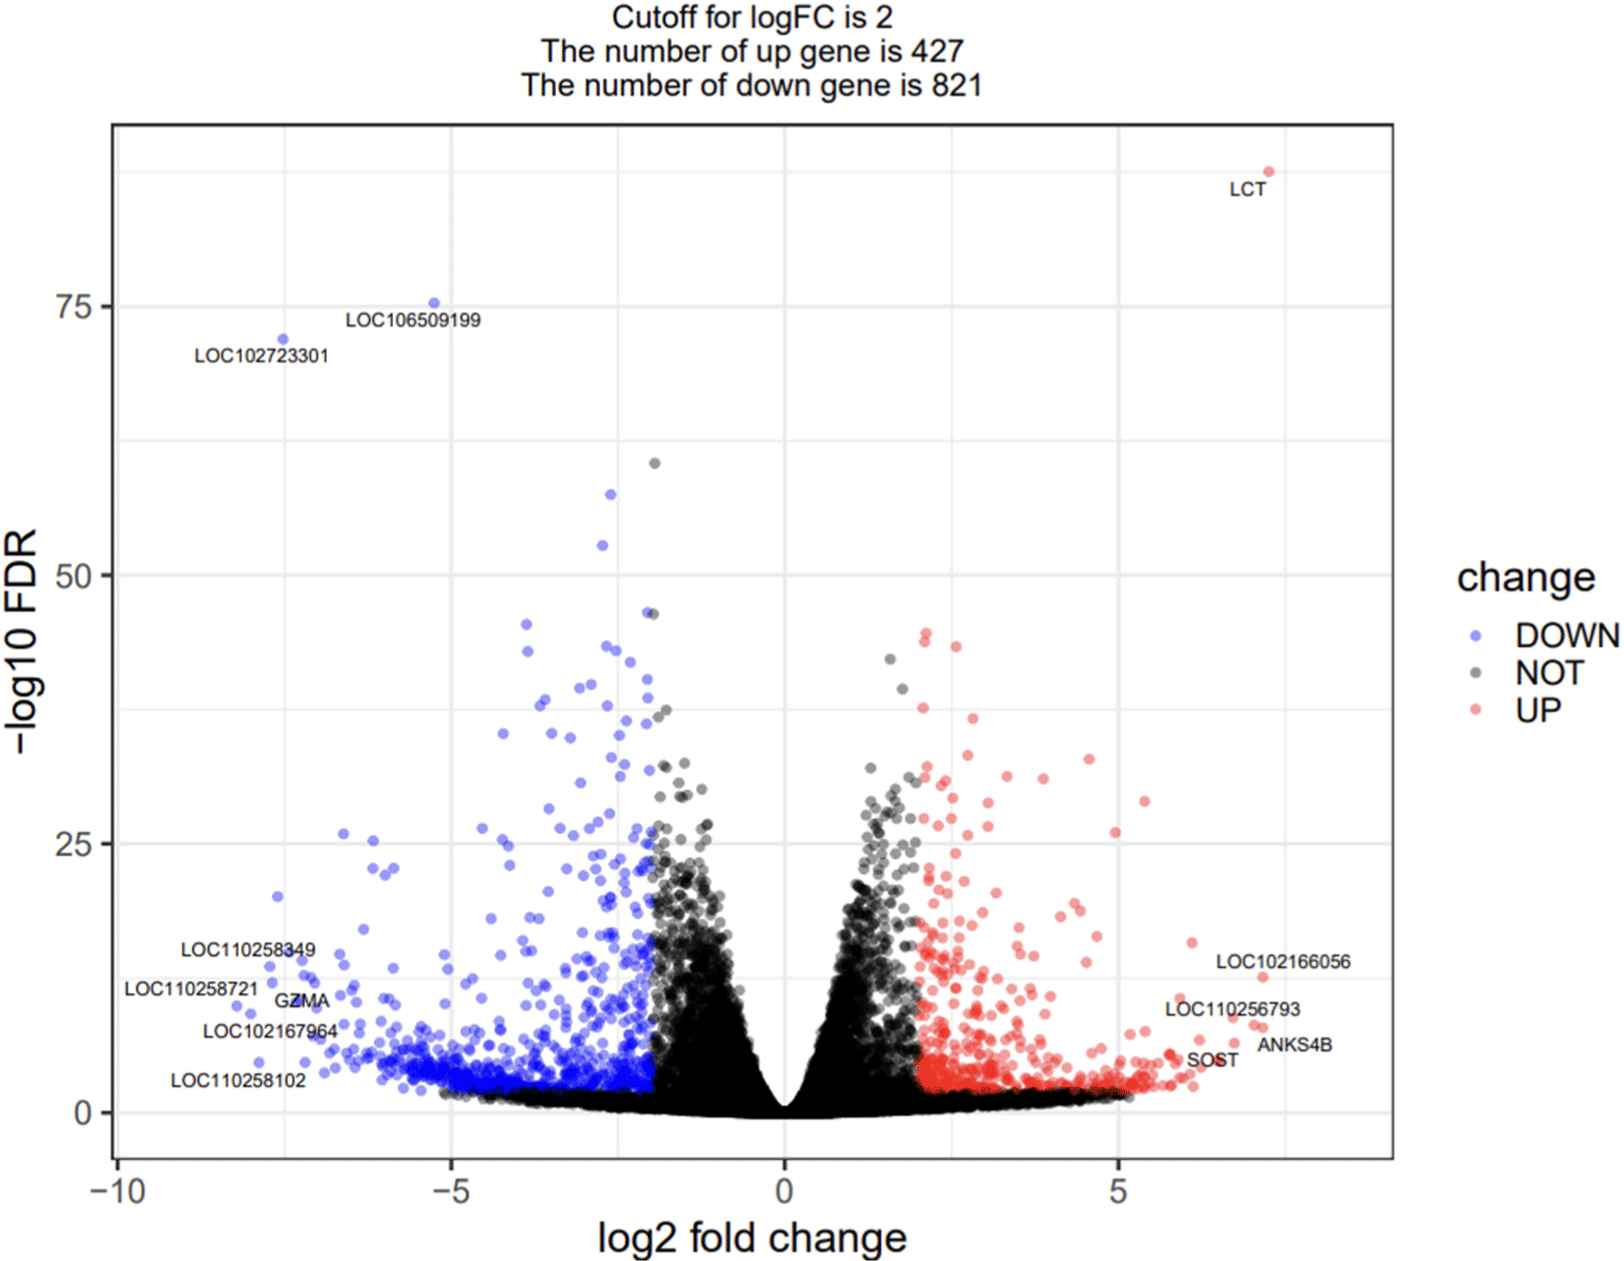
Among all DEGs, the top five upregulated genes are lactase (LCT), LOC102166056, ankyrin repeat and sterile alpha motorized domain containing 4B (ANKS4B), LOC110256793, and sclerostin (SOST), and the top five downregulated genes are R3H and coiled-coil domain-containing protein 1-like (LOC110258721), immunoglobulin lambda variable 8-61-like (LOC102167964), LOC110258102, Ig gamma-3 chain region-like (LOC110258349), and granzyme A (GZMA).
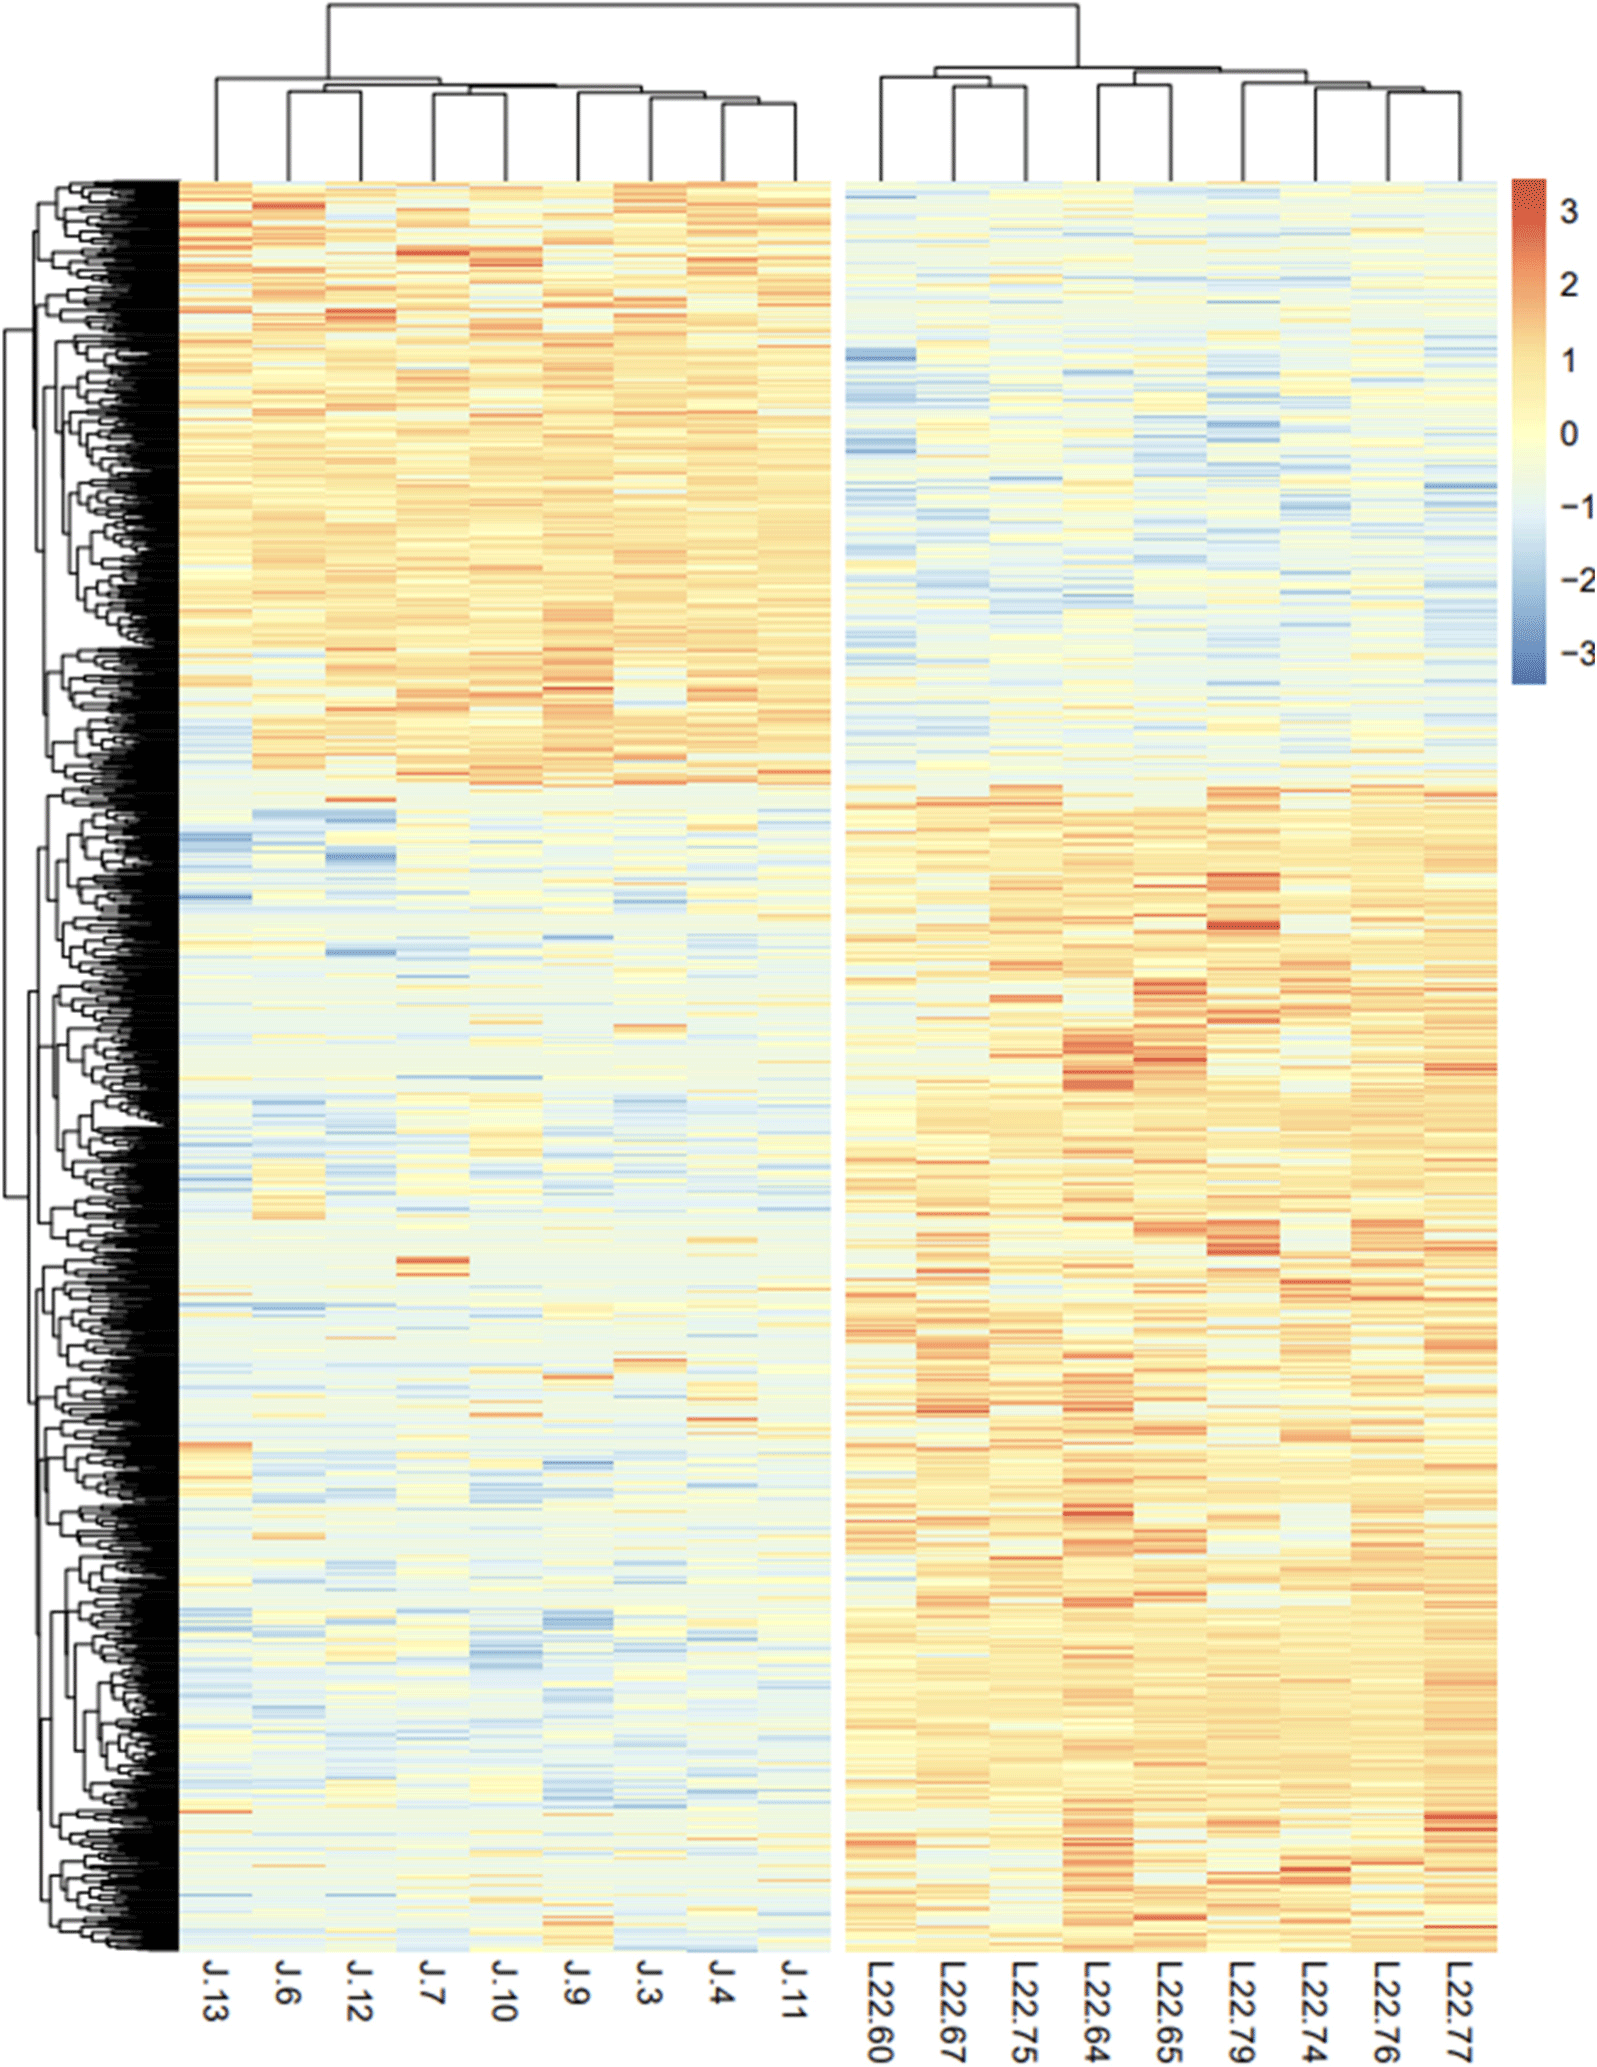
A heatmap of the expression patterns of the Landraces and JNP was generated, and the clustering of samples and genes was derived (Fig. 3). Differential expression of genes in the Landrace and JNP breeds was significant. Several DEGs were upregulated in Landrace pigs compared with JNP pigs. Clustering revealed that samples within the same breed showed similar expression patterns and tended to form close clusters.
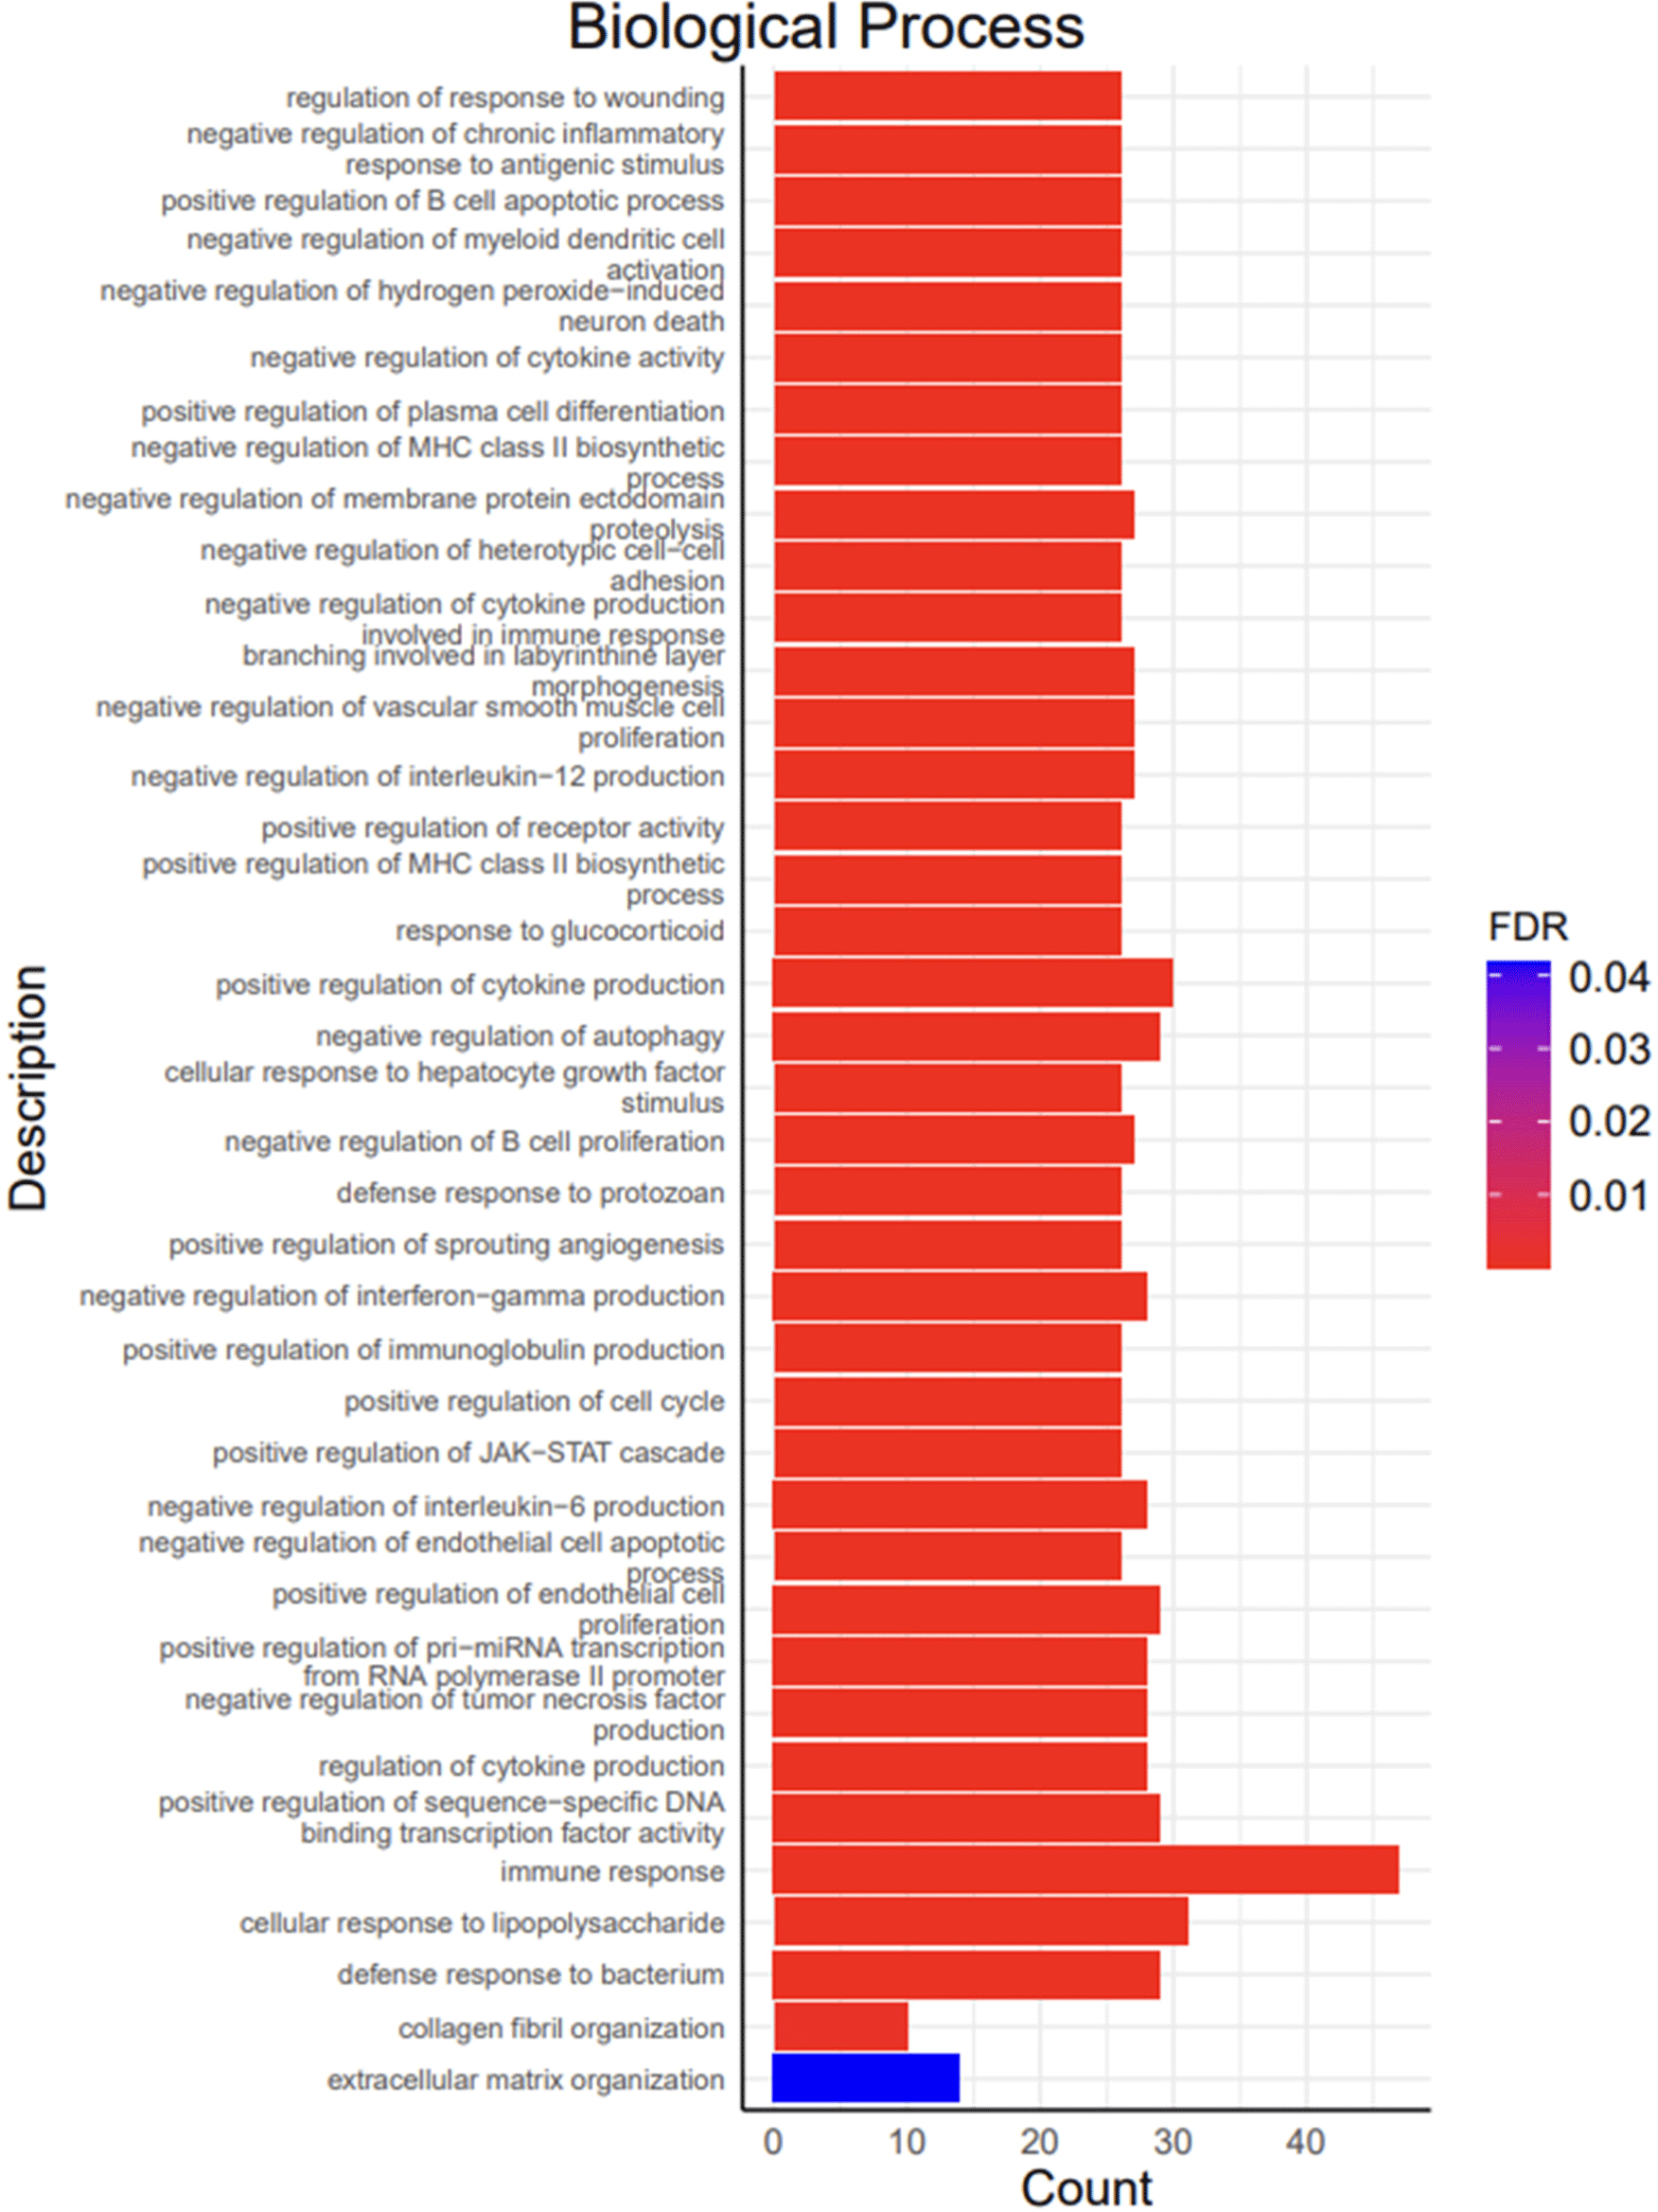
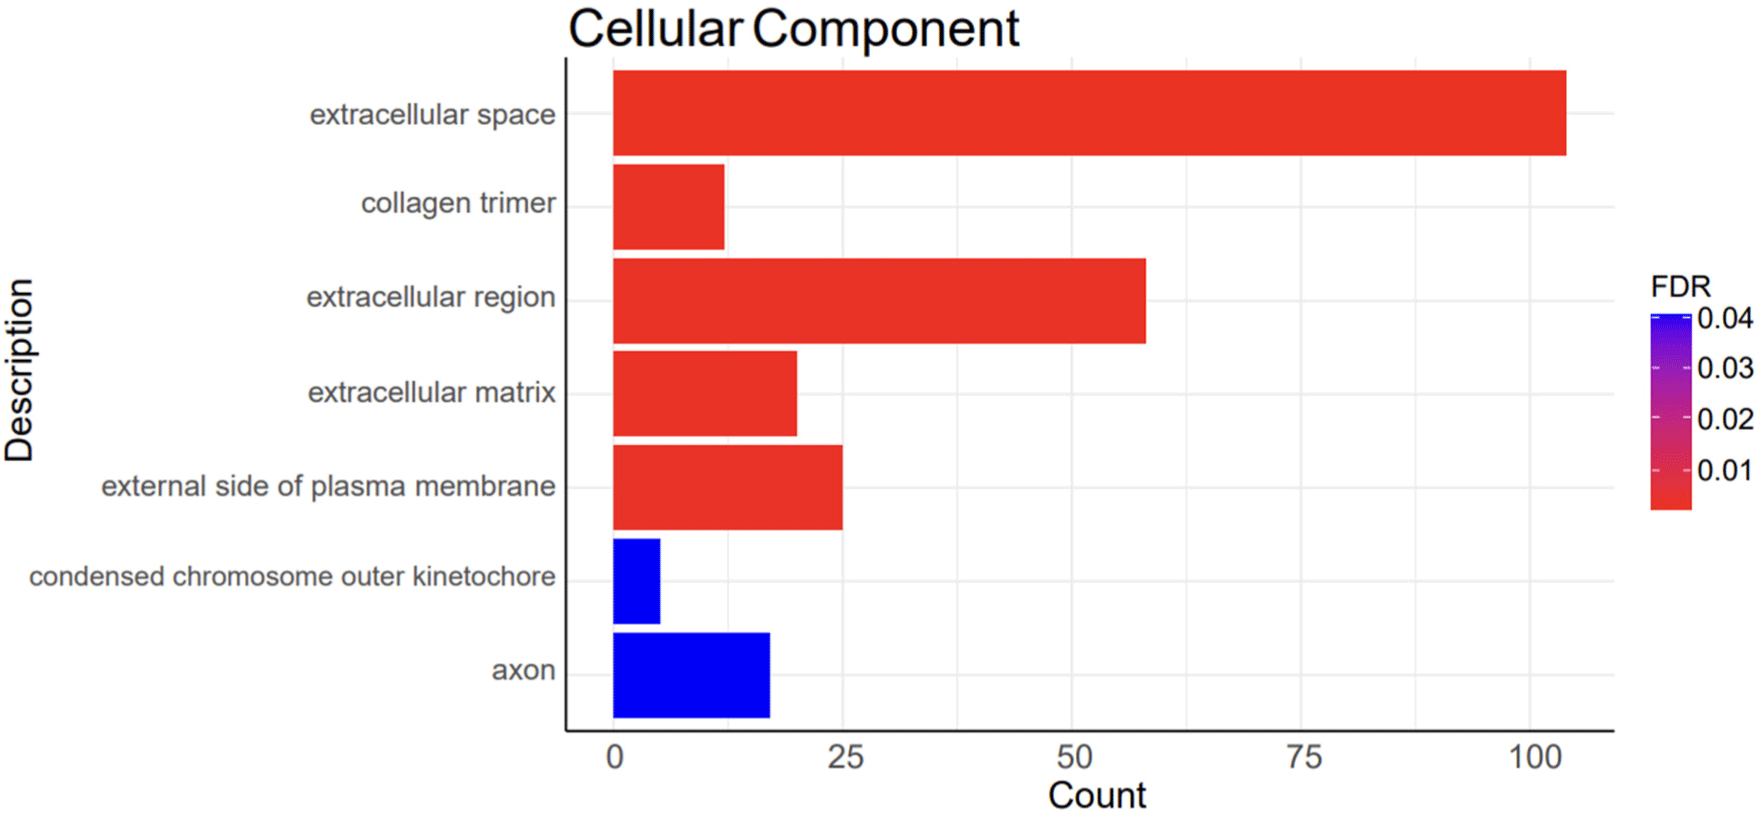
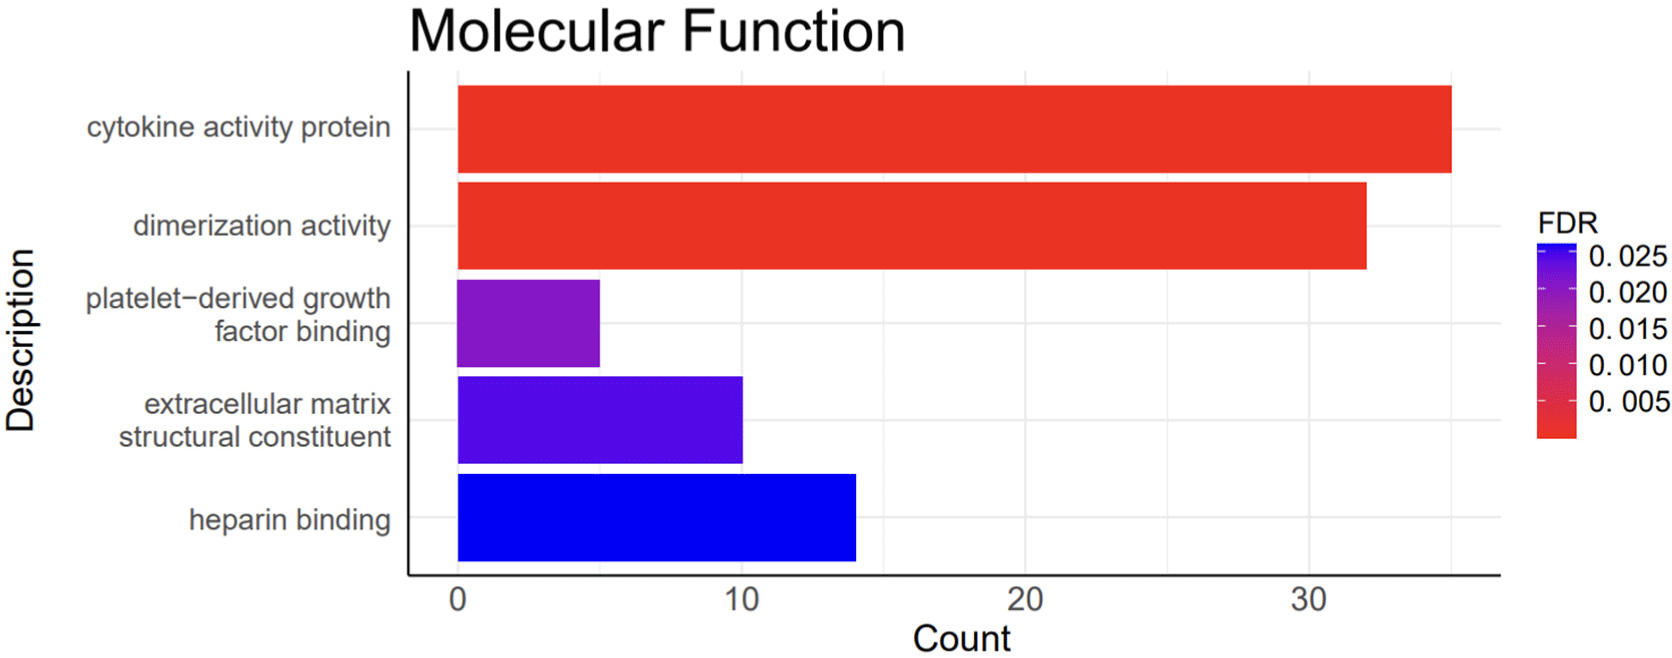
A total of 1,248 DEGs were functionally categorized into three main groups: biological processes (BP), cellular components (CC), and molecular functions (MF). The DEGs were associated with 39 BP terms, 7 CC terms, and 5 MF terms. The detailed functional analysis results are presented in Figs. 3, 4, 5, and 6 and Supplementary Table S1.
Functional annotations discovered for BP included the positive regulation of the cell cycle (GO:0045787), collagen fibril organization (GO:0030199), and extracellular matrix organization (GO:0030198; Fig. 4). Functional annotations of CC included the extracellular space (GO:0005615), collagen trimer (GO:0005581), extracellular matrix (GO:0031012), and extracellular matrix (GO:0031012; Fig. 5). Functional annotations for MF included platelet-derived growth factor binding (GO:0048407) and extracellular matrix structural constituents (GO:0005201; Fig. 6).
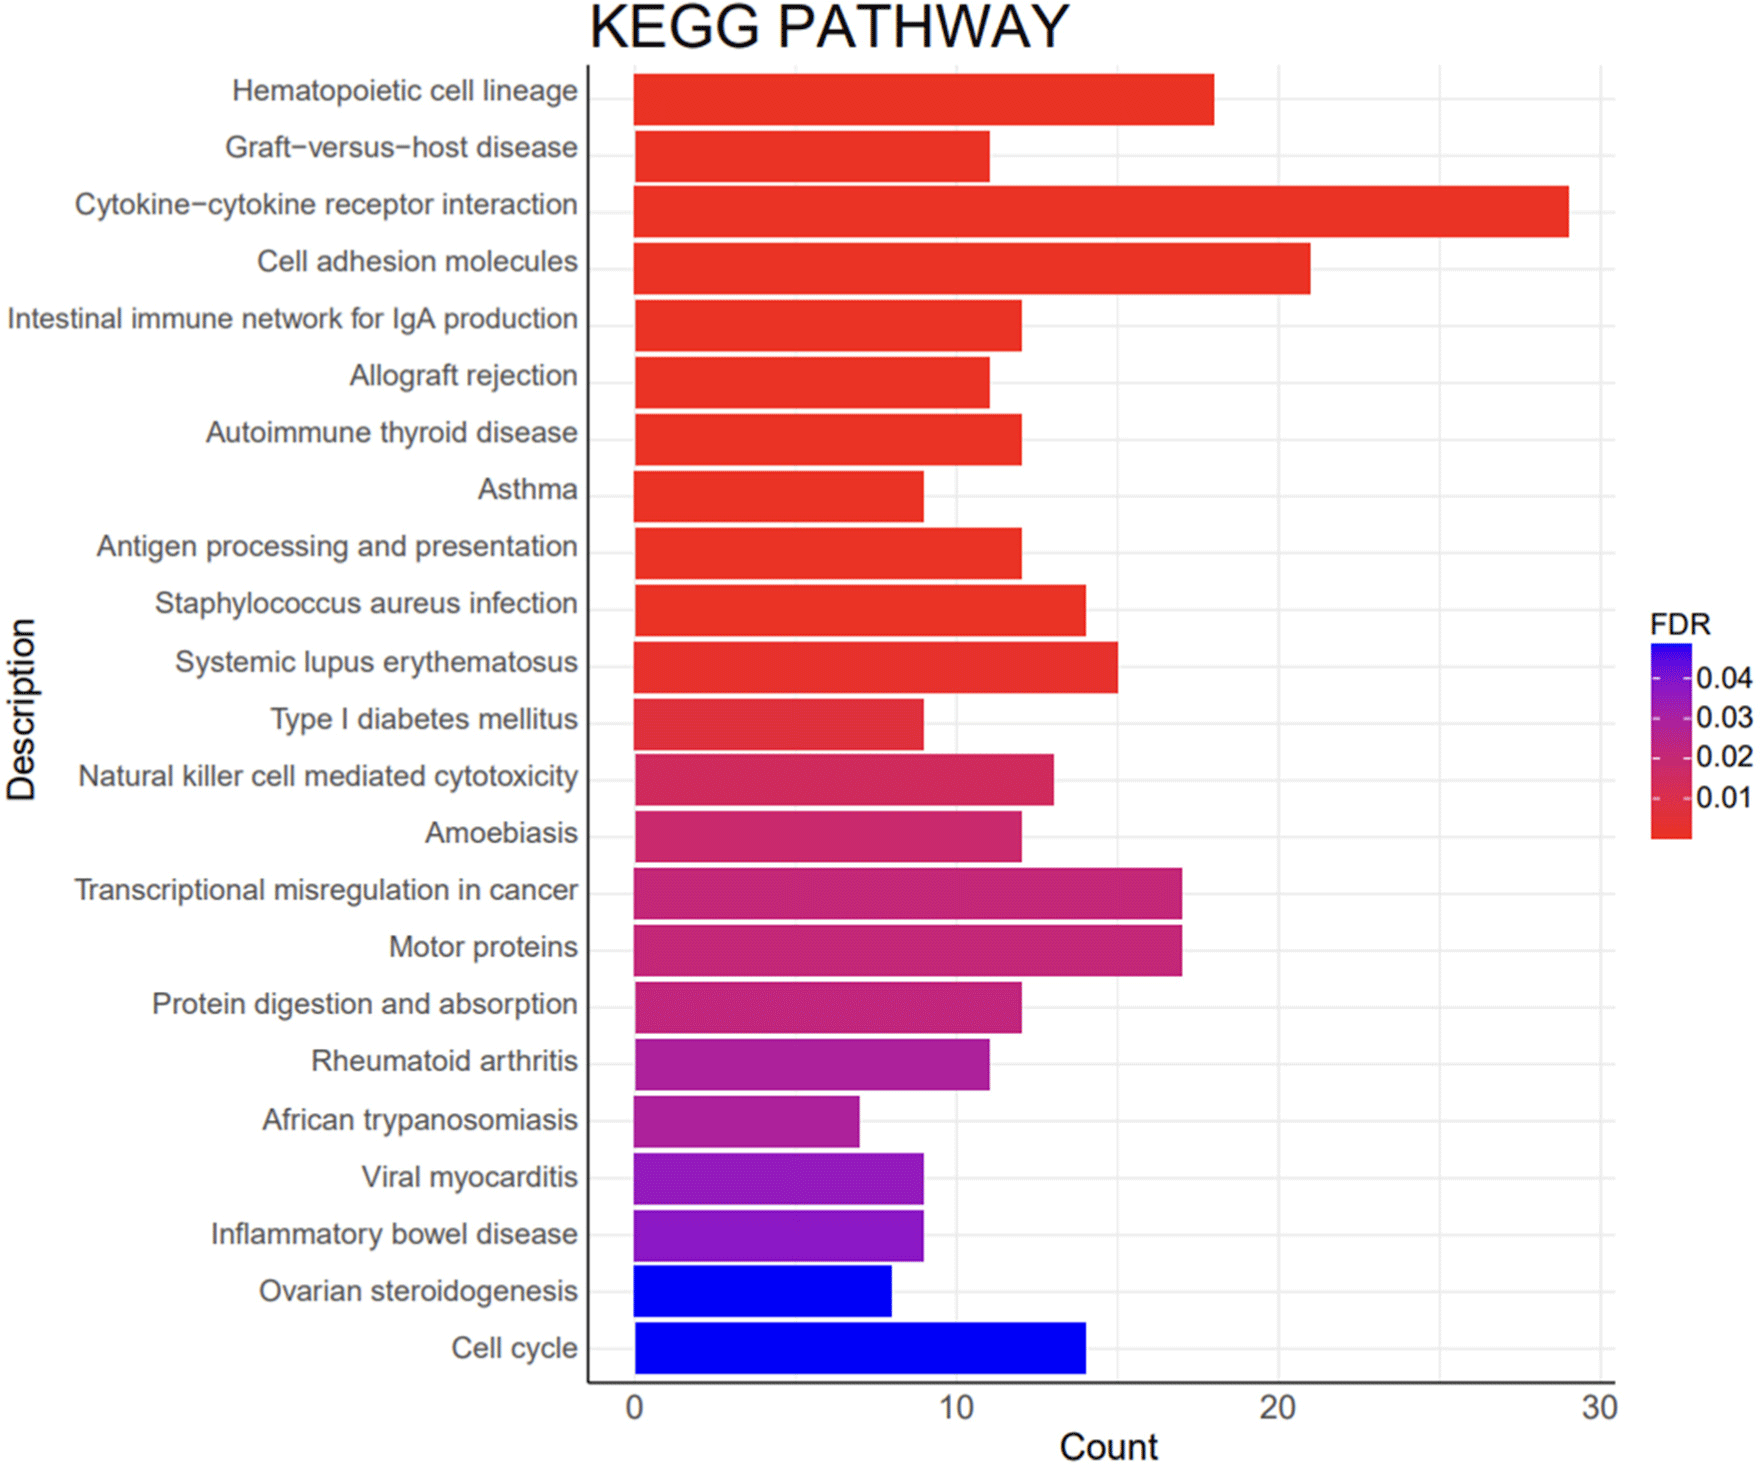
A KEGG pathway analysis was conducted to analyze the interactions of DEGs with biological systems, which indicated that the DEGs were associated with 23 KEGG pathways (Fig. 7). The identified KEGG pathways included cell adhesion molecules (CAM; ssc04514), motor proteins (ssc04814), and cell cycle (ssc04110).
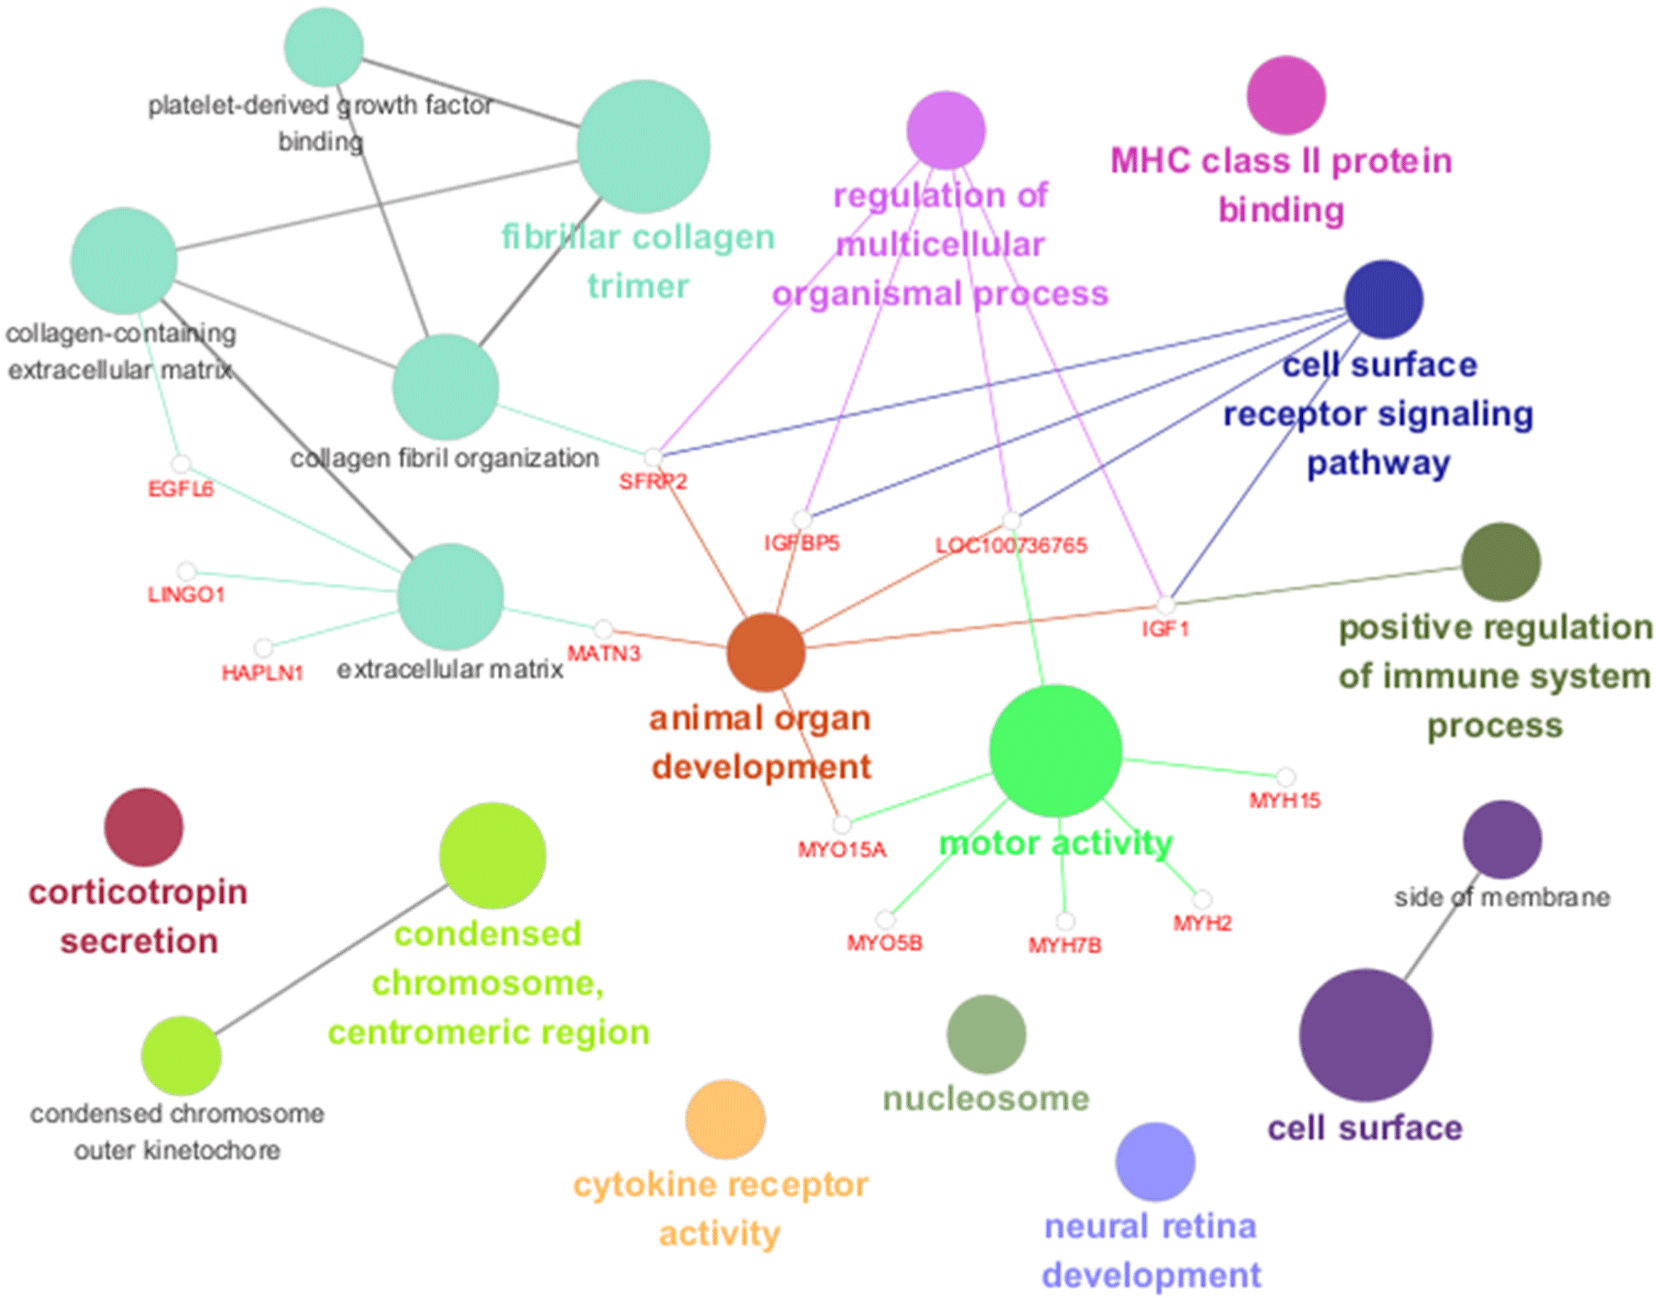
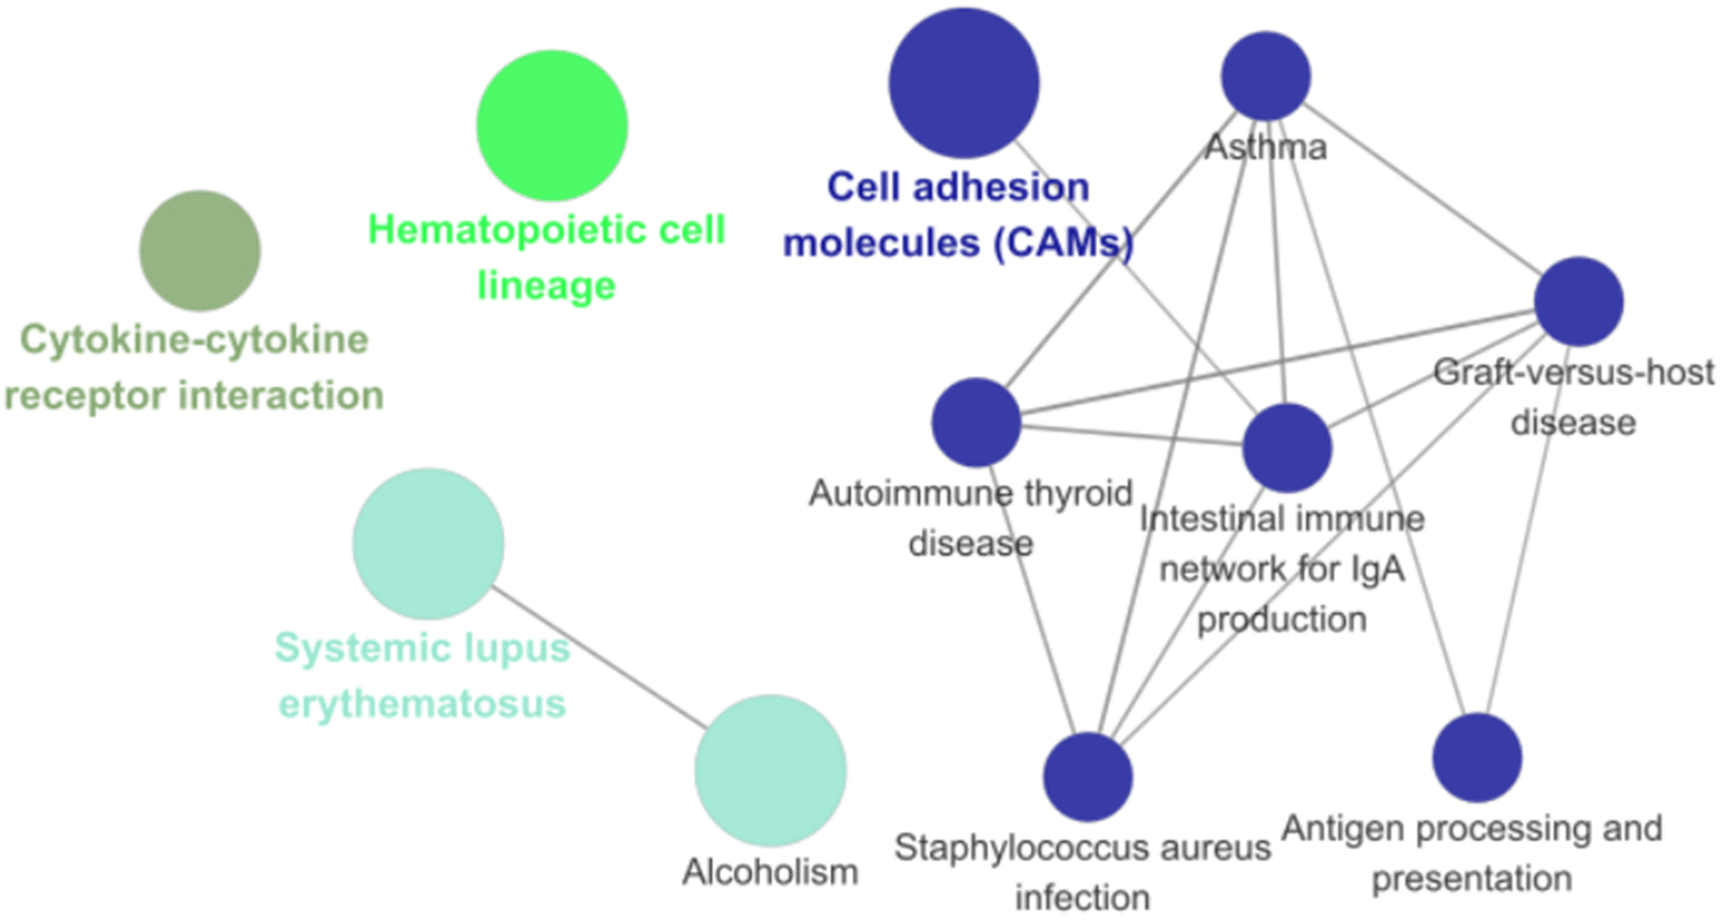
Network analysis indicated significant differences in the interactions of GO and KEGG pathways between breeds. GO network analysis results showed significant differences in fibrillar collagen trimers, animal organ development, motor activity, and cell surface (Fig. 8), whereas the KEGG pathway network analysis results showed significant differences in cytokine-cytokine receptor interactions and CAMs (Fig. 9). Network analysis confirmed the interrelationships between each term and pathway.
Discussion
Genes expressed in the cells of a specific tissue provide fundamental information for understanding the function and physiology of that tissue. This study listed genes expressed through RNA-seq of muscle tissues of Landrace and JNP breeds and showed significant differences between the two breeds. DEGs were identified, and their functions and related biological pathways were understood through GO and KEGG pathway analyses. Furthermore, the correlation between the biological pathways was confirmed through network analysis.
This study analyzed differences in meat quality between Landrace and JNP. The results revealed the following significant differences in meat quality characteristics.
Generally, cooking loss, from a sensory point of view, implies less meat shrinkage and less meat juice loss after cooking (Martens et al., 1982). In this study, cooking loss was lower in JNP. Previously, Cho et al. (2011) reported that JNP produces more meat juice than other commercial breeds, which is consistent with the results of the present study (Cho et al., 2011).
Furthermore, an increase in intramuscular fat content is considered to have a positive effect on the eating quality of pork (Fernandez et al., 1999). The intramuscular fat content was higher in the JNP, suggesting that JNP may provide a flavorful taste.
In the context of meat color, the CIE a* is generally regarded as a crucial indicator of freshness and quality for consumers (Faustman and Cassens, 1990). JNP demonstrated a higher CIE a* compared to Landrace, indicating that JNP possesses a more intense reddish hue. The analysis of intramuscular fat content and meat color showed a trend consistent with previous findings, indicating that slower-growing breeds exhibit higher intramuscular fat content and increased CIE a* (Latorre et al., 2008). This heightened CIE a* in JNP, relative to other commercial breeds, may enhance its appeal to consumers (Cho et al., 2019; Kim et al., 2009). Consequently, the meat color of JNP, especially CIE a*, may positively influence on consumer preferences for pork, with this distinction potentially playing a significant role in purchasing decisions.
JNP exhibited a lower moisture content than Landrace, which aligns with the negative correlation between moisture and fat in meat (Jankowiak et al., 2019; Savell et al., 1986; Watanabe et al., 2018). Given JNP’s higher fat content this lower moisture content is consistent with this established relationship. Shear force, an indicator of meat tenderness, suggests that higher values correspond to tougher meat. In addition, it is reported that TPA parameters, which include hardness, gumminess and chewiness, show a significant positive correlation with both direct and indirect sensory evaluation variables of tenderness (Choe et al., 2016). Our study demonstrated that JNP showed a lower shear force value, hardness, gumminess and chewiness, suggesting it is likely to offer a more tender texture compared to Landrace. While the pH value significantly differed between the JNP and Landrace, both maintained normal pH level, indicating no adverse effects on meat storage or freshness (van der Wal et al., 1988).
Genetic factors influence the quality of meat (Cameron, 1990; Sellier and Monin, 1994). Therefore, the distinct genetic backgrounds of the two varieties are likely responsible for these observed differences. The unique genetic traits of JNP, cultivated over a prolonged period of isolation on Jeju Island, suggest that it significantly enhances its meat quality. This study elucidates the exceptional meat quality attributes of JNP by detailing the variations in meat characteristics, thereby offering valuable insights for advancing future breeding programs and varietal improvements.
RNA-seq analysis was performed to identify the genetic background of the differences in meat quality between Landrace and JNP breeds. RNA-seq analysis showed that 427 and 821 DEGs were significantly upregulated and downregulated, respectively, in the longissimus dorsi muscles of the Landrace and JNP breeds. GO and KEGG pathway analyses of the molecular interactions and biological functions of the DEGs identified 89 GO terms and 33 KEGG pathways.
GO enrichment analysis of DEGs in longissimus dorsi muscle revealed terms primarily associated with the extracellular matrix, collagen, and the regulation of cell division. This indicates that these DEGs play a crucial role in the composition of extracellular matrix and contribute significantly to individual growth process. DEGs related to growth [insulin like growth factor 1 (IGF1), insulin like growth factor binding protein 5 (IGFBP5), secreted frizzled related protein 2 (SFRP2), EGF like domain multiple 6 (EGFL6), matrilin 3 (MATN3), hyaluronan and proteoglycan link protein 1 (HAPLN1), fibulin 7 (FBLN7), leucine rich repeat and Ig domain containing 1 (LINGO1)] were identified in this abundant biological process. Genes related to growth were highly expressed in the Landraces. The IGF1, IGFBP5, SFRP2, EGFL6, MATN3, HAPLN1, FBLN7, and LINGO1 genes upregulated in Landrace pigs were all genes related to growth characteristics known to regulate cell growth and differentiation.
IGF1 mediates the growth-promoting effect of growth hormones (Stewart and Rotwein, 1996), and a positive correlation has been reported between plasma IGF1 levels and growth performance in pigs (Owens et al., 1991). Additionally, IGFBP5 affects the IGF signaling pathway by regulating binding to insulin-like growth factor (IGF) receptors (Conover et al., 1993). Especially, the IGF system, mainly encompassing IGF and insulin-like growth factor binding protein (IGFBP), has been documented to enhance protein synthesis while concurrently suppressing protein degradation rates, thereby facilitating myofiber hypertrophy (Oksbjerg et al., 2004). Moreover, a robust positive correlation exists between myofiber hypertrophy and shear force within the scope of this study (Silva et al., 2015), the observed upregulation of IGF1 and IGFBP5 expression in Landrace, despite the absence of direct investigation into myofiber characteristics and composition in this study, implies that Landrace may possess hypertrophied and more robust myofiber attributes. This expression profile could elucidate Landrace’s observed tougher meat quality compared to JNP as determined through DEG analysis. SFRP2 regulates cell growth and differentiation associated with muscle formation and has been reported to influence skeletal muscle development in pigs (Ma et al., 2016). EGFL6 promotes angiogenesis, cell cycle regulation, and cell proliferation (Chim et al., 2011). Similarly, MATN3 has been reported as a matrilin (MATN) family gene involved in muscle growth and differentiation (Dominique and Gérard, 2006; Elkina et al., 2011; Kong et al., 2017), while HAPLN1 has been reported to play an essential role in cartilage and tissue formation (Spicer et al., 2003). Moreover, FBLN7 has been reported to be expressed in various tissues such as cartilage, bone, and blood vessels and to be involved in various developmental processes (Chakraborty et al., 2020). In addition, LINGO1 is involved in the proliferation and differentiation of muscle satellite cells and the regulation of fat accumulation (Velleman et al., 2022). The upregulated expression of growth-related genes in Landrace appears to indicate the difference in growth performance between Landrace and JNP, which is likely associated with a previous study that reported that Landrace has a higher growth rate than JNP (Hwang et al., 2004; Kim et al., 2008; Kim et al., 2010). Moreover, differences in muscle fiber characteristics, such as fiber number and type, occur depending on growth rate (Ruusunen and Puolanne, 2004), and these characteristics influence meat quality (Herault et al., 2014; Kim et al., 2013b). Therefore, the differences observed in the meat quality analysis between Landrace and JNP are likely attributed to the expression of growth-related genes in Landrace.
KEGG pathway analysis identified a pathway closely related to exercise-related proteins and the cell cycle. DEGs related to this pathway [myosin heavy chain 2 (MYH2), myosin heavy chain 6 (MYH6, LOC100736765), myosin heavy chain 7B (MYH7B), myosin heavy chain 15 (MYH15), myosin VB (MYO5B)] are muscle-related genes known to affect muscle development and function. Among them, MYH2, MYH6, MYH7B, and MYO5B were upregulated in JNP, and MYH15 were upregulated in the Landraces. These genes are the myosin heavy chain (MYH) family associated with myosin, playing a crucial role in muscle development and muscle growth and effect muscle fiber composition and affect muscle fiber characteristics (Cheng et al., 2019; Kong et al., 2017; Mu et al., 2017). The MYH2 gene encodes MyHC IIA, a myosin heavy-chain isoform expressed in type IIA muscle fibers (Tajsharghi et al., 2014). Type IIA muscle fibers are oxidative muscle fibers, and the expression level of oxidative muscle fibers has been reported to be positively correlated with pH, red meat color (Hämäläinen and Pette, 1993), and intramuscular fat content (Eggert et al., 2002; Hausman et al., 2009; Hou, 2015; Joo et al., 2013). This trend is consistent with the results of meat quality analysis, which showed that JNP had significantly higher pH, red meat color, and intramuscular fat content (p<0.05), This also aligns with studies reporting a negative correlation between the area percentage of type IIA fibers and carcass weight (Karlsson et al., 1993; Kim et al., 2013a). MYH7B gene encodes slow-tonic MyHC, which is expressed in slow-tonic muscle fibers (Rossi et al., 2010). Although research on slow-tonic MyHC remains limited, further investigation into the relationship between MYH7B and pork quality is necessary, given that muscle fiver type significantly influences meat quality.
The MYO5B gene encodes a protein belonging to the V-type myosin family and has been reported to be involved in cell motility and intracellular transport of various substances (van Ijzendoorn et al., 2020). Furthermore, MYO5B encodes an actin filament-based protein (Overeem et al., 2020). Actin filaments are a central structural feature of all muscle tissues and play an essential role in the structure and function of muscle fibers (Geeves and Holmes, 1999). These results indicate that skeletal muscle tissue and structure are key factors that characterize differences in gene expression between breeds. The diversity of myofibrillar protein isoforms is related to the characteristics of muscle fibers, which affects meat quality (Choi and Kim, 2009). Genes related to these muscle fiber characteristics are believed to be responsible for the superior meat quality of JNP.
Network analysis confirmed the interactions of biological pathways between the pig breeds. Differences in fibrillar collagen trimers are expected to reflect variations in skin and connective tissue characteristics between breeds, as collagen, a major component of the connective tissue, is known to affect the shear force and tenderness of meat (Lepetit, 2008).
Animal organ development influences productivity traits, including growth rate. Muscle development is closely associated with overall growth (Oksbjerg et al., 2004), and muscle growth rate and obesity have been linked to changes in the muscle transcriptome (Zhao et al., 2011). Therefore, differences in gene expression among breeds may contribute to variations in organ or tissue growth patterns. Discrepancies in motor activity are anticipated to account for the observed differences in motor abilities and behavioral traits across breeds. Differences in pig behavioral characteristics among breeds have been reported (Yoder et al., 2011). Nevertheless, the impact of pig activity on the rate of muscle protein degradation remains ambiguous. While some studies indicate that physical activity does not influence the growth performance or carcass characteristics of pigs (Gentry et al., 2002; Lopez-Bote et al., 2008), other studies suggest that it affects meat color and juiciness (Enfalt et al., 1993; Geverink et al., 1998). Therefore, further research is essential to elucidate the relationship between exercise activity, growth characteristics, and pork quality.
In summary, the primary objective of this study was to identify differences in meat quality traits and genetic variations between Landrace and JNP breeds and to compare the expression of genes related to meat quality and growth characteristics in pigs. Meat quality trait analysis revealed that JNP meat was juicier and tender, possessed better intramuscular fat, and exhibited a redder meat color than Landrace meat, suggesting a higher preference for JNP meat. Transcriptome expression analysis of the longissimus dorsi muscle of the two breeds revealed that GO term analysis showed significant differences in cell cycle regulation, collagen complexes, and extracellular matrix organization, while KEGG pathway analysis identified differences in motor proteins and cell cycle-related pathways. Several candidate genes related to growth and muscle characteristics were identified. In Landrace pigs, genes known to be mainly related to growth (IGF1, IGFBP5, SFRP2, EGFL6, MATN3, HAPLN1, FBLN7, LINGO1) were highly expressed, whereas in JNP pigs, genes known to be related to muscle fiber characteristics (MYH2, MYH6, MYH7B, MYO5B) showed higher expression.
Conclusion
In conclusion, transcriptome analysis demonstrated significant differences between Landrace and JNP breeds, which likely relate closely to the variations in growth ability, muscle characteristics, and meat quality traits observed between the two breeds. The disparities in gene expression between Landrace and JNP suggest differences in growth and muscle fiber composition, and we hypothesize that JNP’s unique gene expression pattern positively influences its meat quality characteristics. These findings provide essential foundational data for understanding the differences in meat quality characteristics between the two breeds and the relationship between gene expression and metabolic pathways, offering valuable insights for future breeding programs.