


Introduction
Meat is a valuable part of the human diet because it contains various nutrients, including proteins with essential amino acids, fats, and micronutrients (Ahmad et al., 2018; Jeon et al., 2024; Kim et al., 2023). However, the high nutritional value of meat makes it susceptible to spoilage. Therefore, various industrial technologies have been employed to prolong the shelf life (Inguglia et al., 2017; Jo et al., 2025; Lee et al., 2023a). However, technologies that change meat content and incorporate non-meat ingredients or additives can only be used in processed meat (Jeong et al., 2025; Kim et al., 2024; Lee et al., 2023b; Mishra et al., 2017). Therefore, low-temperature storage methods, such as cooling and freezing, have been used to maintain the characteristics of fresh meat.
Freezing can effectively lead to the extension of shelf life in meat by controlling moisture and temperature, which are important factors for the growth of microorganisms (Lee et al., 2024b; Vidal et al., 2023). However, during frozen storage, the muscle structure is physically destroyed by the formation of ice crystals, and lipid oxidation increases, which affects the quality of the frozen-thawed meat. The quality deterioration of the frozen-thawed meat depends on storage conditions including temperature, storage duration, and repeated freeze-thaw cycles (Lee et al., 2024c).
Although meat quality deteriorates with frozen storage, it is difficult to visually distinguish between frozen-thawed meat and fresh meat. However, various methods have been used; for example, Domínguez et al. (2019) used a thiobarbituric acid reactive substance (TBARS) assay to estimate lipid oxidation in meat. Carbonyl and total sulfhydryl contents have been used to monitor protein oxidation (Estévez, 2011). In addition, a reduced moisture content of frozen-thawed meat was measured by the drying oven method and compared to that of fresh meat (Cheng et al., 2022a). However, these conventional methods for estimating meat properties are destructive, slow, and laborious. Therefore, non-destructive and rapid methods have been developed to monitor the quality of frozen-thawed meat (Cheng et al., 2022b; Jo et al., 2023; Jo et al., 2024; Silva et al., 2020). Several studies have reported that various non-destructive and rapid methods can be used to monitor the physicochemical properties of frozen-thawed meat. In recent years, measurement variables from non-destructive technology have been set as independent variables. The measurement variables from destructive analysis methods, such as the TBARS assay, water-holding capacity (WHC), and carbonyl content, were set as dependent variables to establish a model for regression or classification to monitor the quality variation in frozen-thawed meat caused by freezing processes (Cheng et al., 2023a; Gudjónsdóttir et al., 2019; Ropodi et al., 2018).
Therefore, in this review, we summarized the physicochemical modifications in the frozen-thawed meat caused by various freezing conditions, specifically temperature and storage duration. In addition, we compiled studies that monitored the characteristics of frozen-thawed meat using various non-destructive methods.
The Freezing Process of Meat
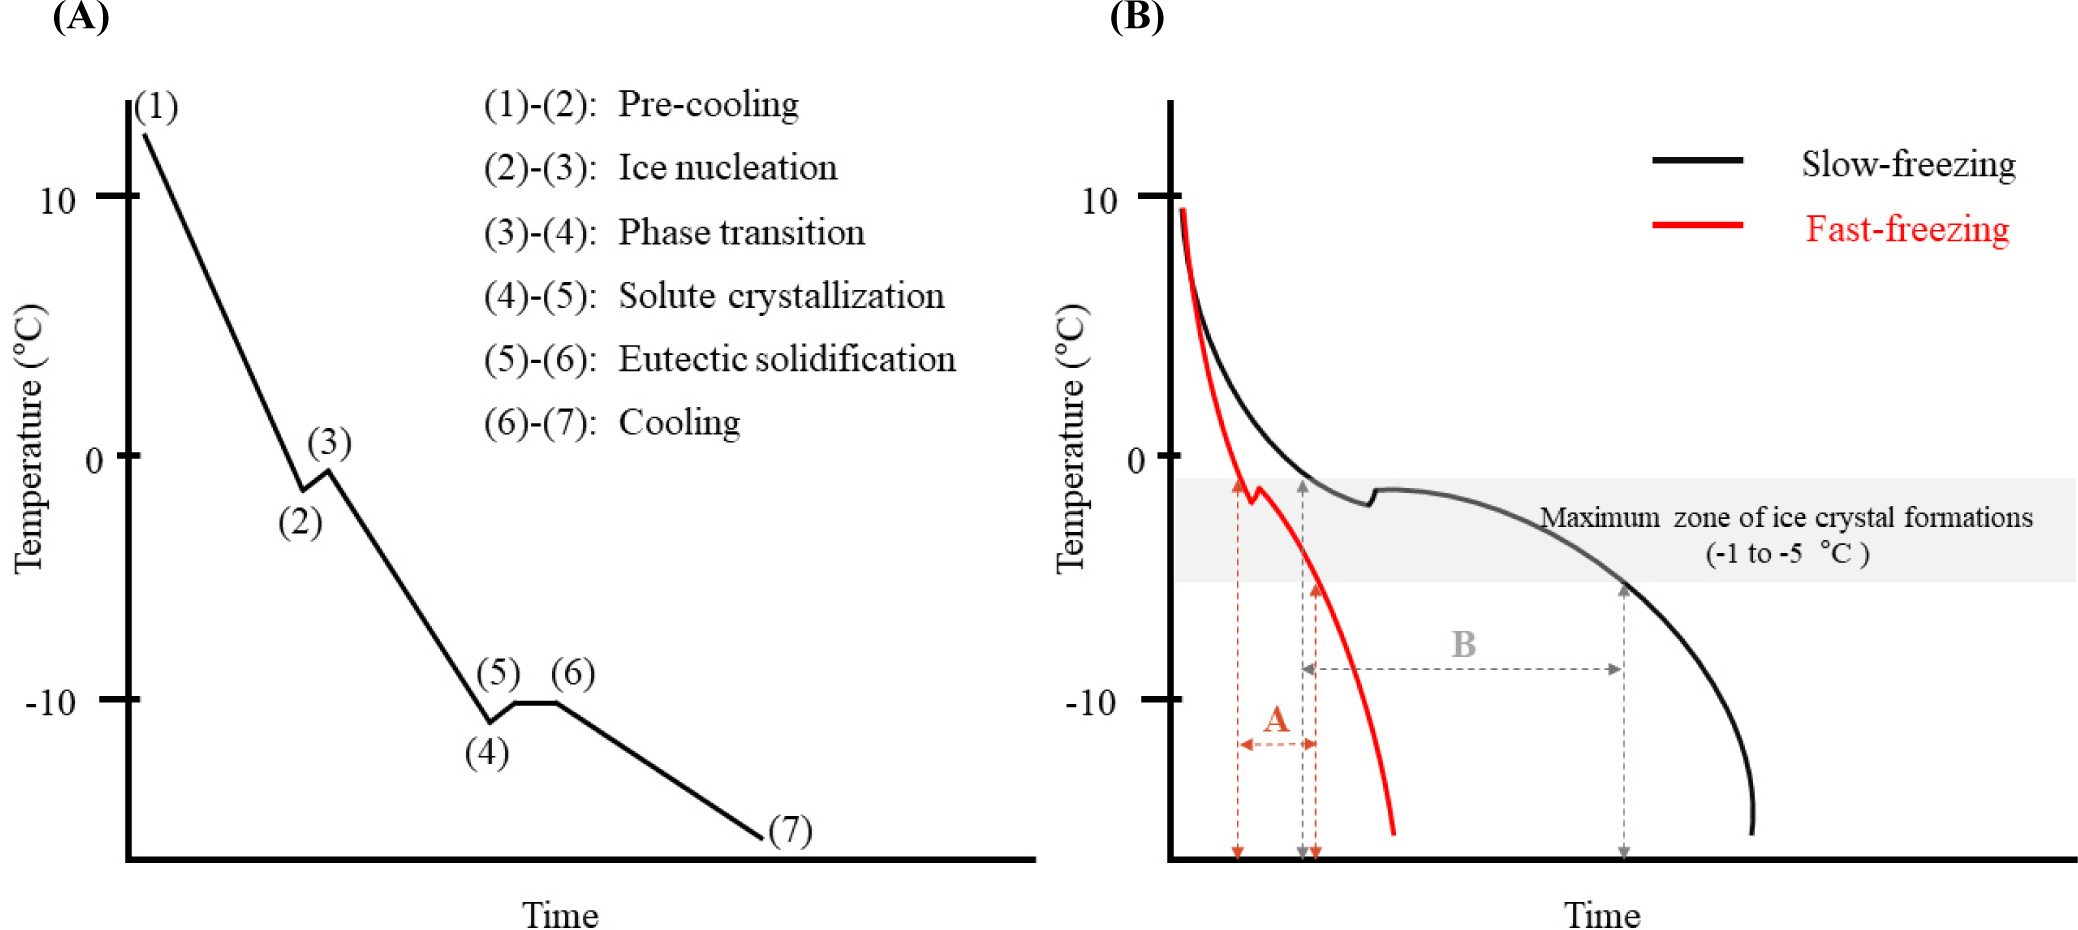
Meat contains numerous nutrients and solutes, which represent the different freezing attributes of meat and pure water. Kumar et al. (2020) described five steps of frozen food storage. Fig. 1A shows the food freezing curve explaining these steps. The authors explained that the freezing point of the water in the meat is not 0°C, and the freezing point of the meat is approximately –2°C. When meat is subjected to freezing, the first step [(1)–(2); Fig. 1A] is pre-cooling, where sensible heat is eliminated without the formation of ice crystals (Kumar et al., 2020). At the state of supercooling, the ice nuclei are formed with latent heat release [(2)–(3); Fig. 1A]. The second step [(3)–(4); Fig. 1A] is the phase transition, where the ice crystals are formed gradually with the decrease in the temperature because the freezing point of the meat is decreased due to the solute concentration in the non-frozen water fractions. Approximately 80% of the water in the meat has ice crystallization in the maximum zone of ice crystal formation (–1°C to –5°C) during this step (Lee et al., 2024b). Therefore, the number, size, and distribution of ice crystals are mostly determined in this zone. Solute crystallization is the third step [(4)–(5); Fig. 1A]. It has been shown that the increased temperatures are due to the latent heat released by solute crystallization (Kumar et al., 2020). The fourth step [(5)–(6); Fig. 1A] is known as eutectic solidification, in which all elements in meat are solidified. The last step [(6)–(7); Fig. 1A] is cooling (Lee et al., 2024b) without any phase transition. Recrystallization occurs continuously because of instability during frozen storage, which modifies the size, shape, and number of ice crystals in meat kept in frozen storage (Cheng et al., 2024). This causes the physicochemical changes in meat during the freezing process.
The Physicochemical Changes in Meat during Frozen Storage
Table 1 shows the results of previous studies on the effects of frozen storage on the physicochemical properties in meat. The changes in meat properties under frozen storage have been ascribed to physical destruction by ice crystals and chemical modifications such as oxidation and cold denaturation (Tan et al., 2021).
| References | Materials | Freezing conditions | Analysis content | Measurements | Results |
|---|---|---|---|---|---|
| Zhu et al. (2022) | Pork | –18°C, –40°C, –80°C, and liquid nitrogen cryogen freezing | Protein oxidation | Carbonyl content | The highest carbonyl content was observed under freezing at –18°C during the entire storage period |
| Lipid oxidation | Thiobarbituric acid reactive substance (TBARS) | The highest TBARS was observed under freezing at –18°C during the entire storage period | |||
| Zhang et al. (2023) | Beef | –20°C (30, 60, 120, or 180 d) | Tertiary structure | Surface hydrophobicity | The surface hydrophobicity decreased after 120 d |
| Qian et al. (2022) | Beef | –20°C, –40°C, and –80°C (12, 24, and 48 h) | Protein functionality | Protein solubility | The protein solubility during frozen storage at –20°C was the lowest among all storage durations |
| Tertiary structure | Myofibrillar proteins (MPs) surface hydrophobicity | Frozen storage at –20°C increases the surface hydrophobicity at freezing temperatures | |||
| Secondary structure | Fourier trans-formation infrared spectrum (FTIR) | Higher freezing rates and shorter freezing times decrease α-helix and increase β-turn and random coil of MP samples. | |||
| Microstructure | Light microscope | The highest destruction of muscle cells was observed under frozen storage at –20°C. | |||
| Soyer et al. (2010) | Chicken | –7°C, –12°C, and –18°C (1, 2, 3, 4, 5, and 6 mon) | Lipid oxidation | TBARS | The lowest TBARS level was observed under frozen storage at –18°C |
| Protein oxidation | Carbonyl contents | The lowest carbonyl content was observed under frozen storage at –18°C | |||
| Medić et al. (2018) | Pork | –18°C (fresh, 3, 6, 12, 15, and 18 mon) | Lipid oxidation | TBARS | The highest TBARS value of ham and loins was observed after 12 mon, whereas the belly rib showed the highest TBARS value after 15 mon. |
| Li et al. (2021) | Pork | –18°C (fresh, 30, 60, 90, and 180 d) | Protein oxidation | Carbonyl contents | Freezing at –18°C causes increased carbonyl contents during extended storage periods. |
| Tertiary structure | Tryptophan fluorescence intensity | Freezing at –18°C causes increased exposure of the buried tryptophan residues during extended storage periods | |||
| Zequan et al. (2019) | Pork | –18°C (fresh, 3, 6, 9, 12, 15, and 18 weeks) | Muscle structure | Light microscope | The muscle tissues shrink after 9 weeks |
| Muela et al. (2015) | Lamb | –18°C (fresh, 1, 9, 15, and 21 mon) | Water-holding capacity | Thawing loss | The thawing loss is gradually increased |
| pH | pH | The pH is gradually decreased |
Because the solute concentration in the intracellular fluid is higher than that in the extracellular fluid, ice crystals are first formed in the extracellular space (Lee et al., 2024b). The size of ice crystals in the extracellular space is gradually increased by water migration from the intracellular to extracellular spaces because of the osmotic pressure and higher water vapor pressure of water compared to that of ice (Jiang et al., 2019). In addition, the size and number of ice crystals increase and decrease, respectively, during frozen storage because the water vapor pressure of small ice crystals is higher than that of large ice crystals (Lee et al., 2024b). Ice crystals destroy the muscle cell membrane, causing shrinkage of muscle cells by dehydration (Zhang and Ertbjerg, 2019). The extended extracellular space, with the formation of large ice crystals, can be utilized as a drip channel in the frozen-thawed meat (Zhang et al., 2017). Therefore, the physical destruction of the muscle structure by ice crystals decreases the WHC due to thawing loss.
The forming of ice crystals in meat increases the solute concentration within the unfrozen water fractions. These concentrated solutes containing heme pigments and metal ions can induce the oxidation and denaturation of various molecules such as lipids, proteins, and vitamins in meat (Lee et al., 2024a). Oxidation is induced by the release of pro-oxidants (heme pigments and metal ions) and mitochondrial enzymes owing to muscle cell destruction by ice crystallization (Estévez, 2011; Utrera et al., 2014a). Bao et al. (2021) explained that the concentration of the solution surrounding ice crystal surfaces increase during the growth of ice crystals, accelerating the oxidation reactions. Lipid oxidation induces the production of toxic substances such as ketones and aldehydes, which lead to off-flavors and negatively affect human health (Estévez, 2011). Lipid peroxidation also induces protein oxidation, mainly via protein carbonylation. Carbonylation results in changes in the protein structure (Estévez, 2011). This could lead to increased hydrophobicity of myofibrillar proteins (MPs) and protein degradation or aggregation, thereby affecting meat quality (Leygonie et al., 2012). Therefore, protein and lipid oxidation must be considered during frozen storage.
Because meat contains large amounts of water and proteins, native proteins are stabilized by the water shell, mainly forming hydrogen bonds. In addition, the repulsive force between non-polar residues and water maintains the stabilization of the native protein structure (Lee et al., 2024b). However, when meat is frozen, its conformational stability decreases. The repulsive force between the hydrophobic residues of protein and water molecules decrease, causing partial unfolding, which is known as cold denaturation (Lee et al., 2024b). Cold denaturation could decrease the solubility and WHC, which are functional properties of meat proteins; thus, decreasing the quality of frozen-thawed meat.
However, some studies have reported the advantages of frozen storage for improving tenderness (Leygonie et al., 2012). The improved tenderness of frozen-thawed meat can be explained by the degradation of the muscle structure by ice crystals and proteolytic enzymes such as cathepsin B and lysosomal proteases (Gaarder et al., 2012; Han et al., 2024; Lee et al., 2021). Lu et al. (2020) reported that frozen storage damages MPs, particularly desmin and troponin T. The protease released by ice crystallization increases the protein degradation activity and improves tenderness (Yang et al., 2019). Calcium ions can be released from the sarcoplasmic reticulum after it is damaged by ice crystal formation during the freeze-thaw process, which induces proteolysis (Warner et al., 2022). However, protein breakdown due to freezing does not always lead to beneficial effects such as meat tenderization (Lee et al., 2024b), but this depends on the freezing conditions.
Complex physicochemical changes in frozen-thawed meat have been previously reported. Several approaches have been investigated to minimize the decrease in meat quality during frozen storage.
The Effect of Freezing Rates on the Properties of Frozen-Thawed Meat
The rate of decrease in meat temperature, especially the time it takes to pass the maximum zone of ice crystal formation, is important for determining the physicochemical changes in frozen-thawed meat. Fig. 1B shows the slow- and fast-freezing curves during frozen storage. Fast freezing of food occurs when the core temperature of the food passes through the maximum ice crystal formation zone within 35 min (Ban and Choi, 2012). The initial freezing point of meat is approximately –2°C. However, the freezing points of the unfrozen meat fractions gradually decrease because of the increase in solute concentration during the freezing process (Lee et al., 2024b). The rapid decline in meat temperature due to fast freezing exposes the unfrozen fractions to freezing points, and ice nuclei can form in both extracellular and intracellular spaces. This induces the formation of numerous small ice crystals with high uniformity and minimizes the physical destruction of muscle cell membranes (Qian et al., 2022). Otherwise, slow freezing of meat results in the formation of larger ice crystals in the extracellular space, resulting in a higher degree of physical destruction of muscle cell membranes (Zhang and Ertbjerg, 2019).
The freezing rate can change the distribution of the unfrozen solute concentration. The rapid formation of many small ice crystals results in the dispersion of the unfrozen solute concentration, reducing the reaction of lipids and proteins with oxidants such as metal ions in the unfrozen solute solution (Ban and Choi, 2012; Lee et al., 2024b). Therefore, a higher degree of oxidation in frozen-thawed meat was observed under slow freezing than under the fast freezing (Qian et al., 2022). Zhu et al. (2022) also reported that storage at –18°C showed the highest protein and lipid oxidations among temperatures of –18°C, –40°C, and –80°C, and liquid nitrogen cryogen freezing. Similarly, Soyer et al. (2010) observed that the chicken meat in frozen storage at –18°C shows lower oxidation than chicken meat in frozen storage at –7°C and –12°C.
After the complete formation of ice crystals, the solute can crystallize with a decrease in temperature and change to a glass state (Kumar et al., 2020). The molecular mobility of the solute is restricted to the glass state; therefore, chemical reactions between molecules such as lipids, proteins, and solutes, are inhibited (Lee et al., 2024b). Therefore, rapid arrival to the glass transition temperature of frozen meat via fast freezing can suppress the deterioration of meat quality induced by chemical reactions. In addition, storage below the glass transition temperature improves the quality of frozen-thawed meat (Kasapis, 2006; Kumar et al., 2020; Lee et al., 2024b).
The Effects of Storage Periods on the Properties of Frozen-Thawed Meat
The frozen-storage period influences meat quality. The size and number of ice crystals generally increase and decrease, respectively, during prolonged frozen storage, resulting in greater physical destruction of meat structures (Qian et al., 2022). Recrystallization is the main mechanism for the growth of ice crystals during continuous frozen storage. Small, slightly melted ice crystals continue to grow during frozen storage, which is known as Ostwald ripening (van Westen and Groot, 2008). Ice crystal growth forms large ice crystals, which are more likely to destroy the muscle cell structure, expand the drip channel, and migrate more water from the intracellular space to the extracellular space. Expanded drip channels were attributed to decreased WHC (Zhang and Ertbjerg, 2018). Increased thawing loss has been observed with an increase in frozen storage duration (Zequan et al., 2019). This increases the number of drips containing large amounts of nutrients. Thus, extending the frozen storage time reduces the nutritional value of meat. Hussein et al. (2020) reported that the protein content in frozen-thawed meat decreased with increasing storage duration.
The oxidation of lipids and proteins in frozen meat increases with prolonged frozen storage. Because of the unstable conditions during storage, recrystallization occurs, which allows the solute to keep moving (Kumar et al., 2020). Therefore, continuous contact between metal ions and lipids in solute solution causes higher oxidation, which decreases meat quality (Muela et al., 2015). During frozen storage, ice crystals continue to grow until they stabilize, which disrupts muscle cells and increases the pro-oxidant concentration in the non-water fraction (Utrera et al., 2014b). Reactive oxygen species (ROS) form continuously during extended frozen storage, leading to ongoing lipid and protein oxidation, ultimately decreasing meat quality. Similarly, lipid and protein oxidation of chicken meat has been shown to gradually increase regardless of storage temperature (Soyer et al., 2010). In addition, the loosened protein structure due to decreased repulsive forces causes proteins to aggregate, decreasing meat quality in terms of WHC and protein solubility (Berrill et al., 2011). Qian et al. (2022) also reported that protein solubility and WHC gradually decrease the increasing surface hydrophobicity, regardless of the freezing temperature. Also, the aggregation of MPs extracted from pork loin was reported with prolonged periods under the frozen storage at –20°C and –50°C (Jeong et al., 2025). Therefore, it is important to decrease the storage duration to minimize the decrease in meat quality. In addition, frozen meat must be stored below the glass transition temperature because storage above the glass transition temperature leads to chemical reactions between molecules.
Measurement of Frozen-Thawed Meat Quality Using Non-Destructive Methods
Non-destructive analysis techniques for predicting meat quality can be classified into two categories: spectroscopy and imaging. Table 2 presents the results of previous studies that monitored the properties of frozen-thawed meat using non-destructive analyses.
| References | Sample | Techniques | Determination | Measurements | Calibration set (training set) | Prediction set (validation or test set) |
|---|---|---|---|---|---|---|
| Imaging-based techniques | ||||||
| Pu et al. (2015) | Pork | Hyperspectral imaging (HSI) (400–1,000 nm) | Classification of fresh and repeated frozen-thawed meat | Classification | CC%=93.14% | CC%=90.91% |
| Xie et al. (2015) | Pork | HSI (400–1,000 nm) | Prediction of color and water-holding capacity | CIE L* | - | r2=0.907 |
| Cooking loss | - | r2=0.845 | ||||
| CIE b* | - | r2=0.814 | ||||
| Drip loss | - | r2=0.762 | ||||
| CIE a* | - | r2=0.716 | ||||
| Cheng et al. (2018) | Pork | HSI (1,000–2,200 nm) | Prediction of tertiary protein structure and enzyme activity | Surface hydrophobicity | r2C=0.893 RMSEC=1.576 | r2P=0.896 RMSEP=1.549 |
| Ca2+-ATPase activity | r2C=0.896 RMSEC=0.014 | r2P=0.879 RMSEP=0.015 | ||||
| Cheng et al. (2019) | Pork | HSI (1,000–2,200 nm) | Prediction of secondary protein structure | α-Helix fraction in actomyosin | r2C=0.789 RMSEC=2.170% | r2P=0.836 RMSEP=1.737% |
| Cheng et al. (2022b) | Pork | Fluorescence-HSI | Prediction of protein oxidation | Carbonyl content | r2C=0.9305 RMSEC=0.1011 | r2P=0.9275 RMSEP=0.0812 |
| Total sulfhydryl content | r2C=0.9550 RMSEC=1.6096 | r2P=0.9512 RMSEP=1.2979 | ||||
| Cheng et al. (2023b) | Pork | HSI (400–1,002 nm) | Prediction of lipid and protein oxidation | TBARS | r2C=0.9889 RMSEC=0.0182 | r2P=0.9724 RMSEP=0.0227 |
| Carbonyl content | r2C=0.9824 RMSEC=0.0530 | r2P=0.9602 RMSEP=0.0702 | ||||
| Cheng et al. (2023a) | Pork | HSI (400–1,002 nm) | Prediction of lipid oxidation | TBARS | r2C =0.9830 RMSEC=0.0153 | r2P =0.9697 RMSEP=0.0184 |
| Fluorescence-HSI | r2C=0.9833 RMSEC=0.0140 | r2P =0.9726 RMSEP=0.0182 | ||||
| Wei et al. (2024) | Beef | HSI (328–1,115 nm) | Prediction of freezing point and water mobility | Freezing point | r2C=0.82 RMSEC=0.12 | r2P=0.76 RMSEP=0.11 |
| P21 | r2C=0.95 RMSEC=0.38 | r2P=0.80 RMSEP=0.67 | ||||
| P22 | r2C=0.96 RMSEC=0.39 | r2P=0.84 RMSEP=0.71 | ||||
| Jeong et al. (2025) | Pork | HSI (402–1,002 nm) | Classification of frozen storage conditions and thawing loss | Frozen storage conditions | CC%=83.20% | CC%=81.82% |
| Thawing loss | CC%=93.36% | CC%=91.92% | ||||
| Spectroscopy-based techniques | ||||||
| Gudjónsdóttir et al. (2019) | Atlantic mackerel | Low-field nuclear magnetic resonance (LF-NMR) | Prediction of water content, total lipids, water-holding capacity | Water content | - | r2=0.799 |
| Total lipids | - | r2=0.760 | ||||
| Water-holding capacity | - | r2=0.691 | ||||
| Chen et al. (2020) | Beef | Raman spectroscopy | Prediction of texture properties | Hardness (g) | r2C=0.82 RMSEC=11.9 | r2P=0.82 RMSEP=12.8 |
| Tenderness (N) | r2C=0.83 RMSEC=2.78 | r2P=0.81 RMSEP=2.57 | ||||
| Chewiness (g.s) | r2C=0.91 RMSEC=625 | r2P=0.80 RMSEP=942 | ||||
| Firmness (g) | r2C=0.91 RMSEC=8.70 | r2P=0.81 RMSEP=11.5 | ||||
| Springiness (%) | r2C=0.71 RMSEC=2.75 | r2P=0.53 RMSEP=2.26 | ||||
| Chen et al. (2023) | Beef | Raman spectroscopy | Prediction of water content and water-holding capacity | Thawing loss | r2C=0.994 RMSEC=0.640 | r2P=0.971 RMSEP=1.436 |
| Water content | r2C=0.966 RMSEC=0.450 | r2P=0.928 RMSEP=0.582 | ||||
| Ropodi et al. (2018) | Beef | Fourier-transform infrared (FTIR) | Classification of fresh and frozen beef at –20°C (7 and 32 d) | Classification | CC%=100% | CC%=93.33% |
| Cáceres-Nevado et al. (2021) | Pork | Near-infrared (NIR) | Classification of fresh and frozen pork at –20°C | Classification | CC%=99.35% | CC%=100% |
Fig. 2A represents the simple principles and types of spectroscopy-based technologies. Spectroscopy is used to determine the chemical composition of meat, which allows us to predict meat quality (Prieto et al., 2009). Diverse types of spectroscopic analyses, including near-infrared (NIR), Fourier-transform infrared (FTIR), nuclear magnetic resonance (NMR), and Raman, are used to monitor meat quality (Barbin et al., 2013; Kumar and Karne, 2017; Ropodi et al., 2018).
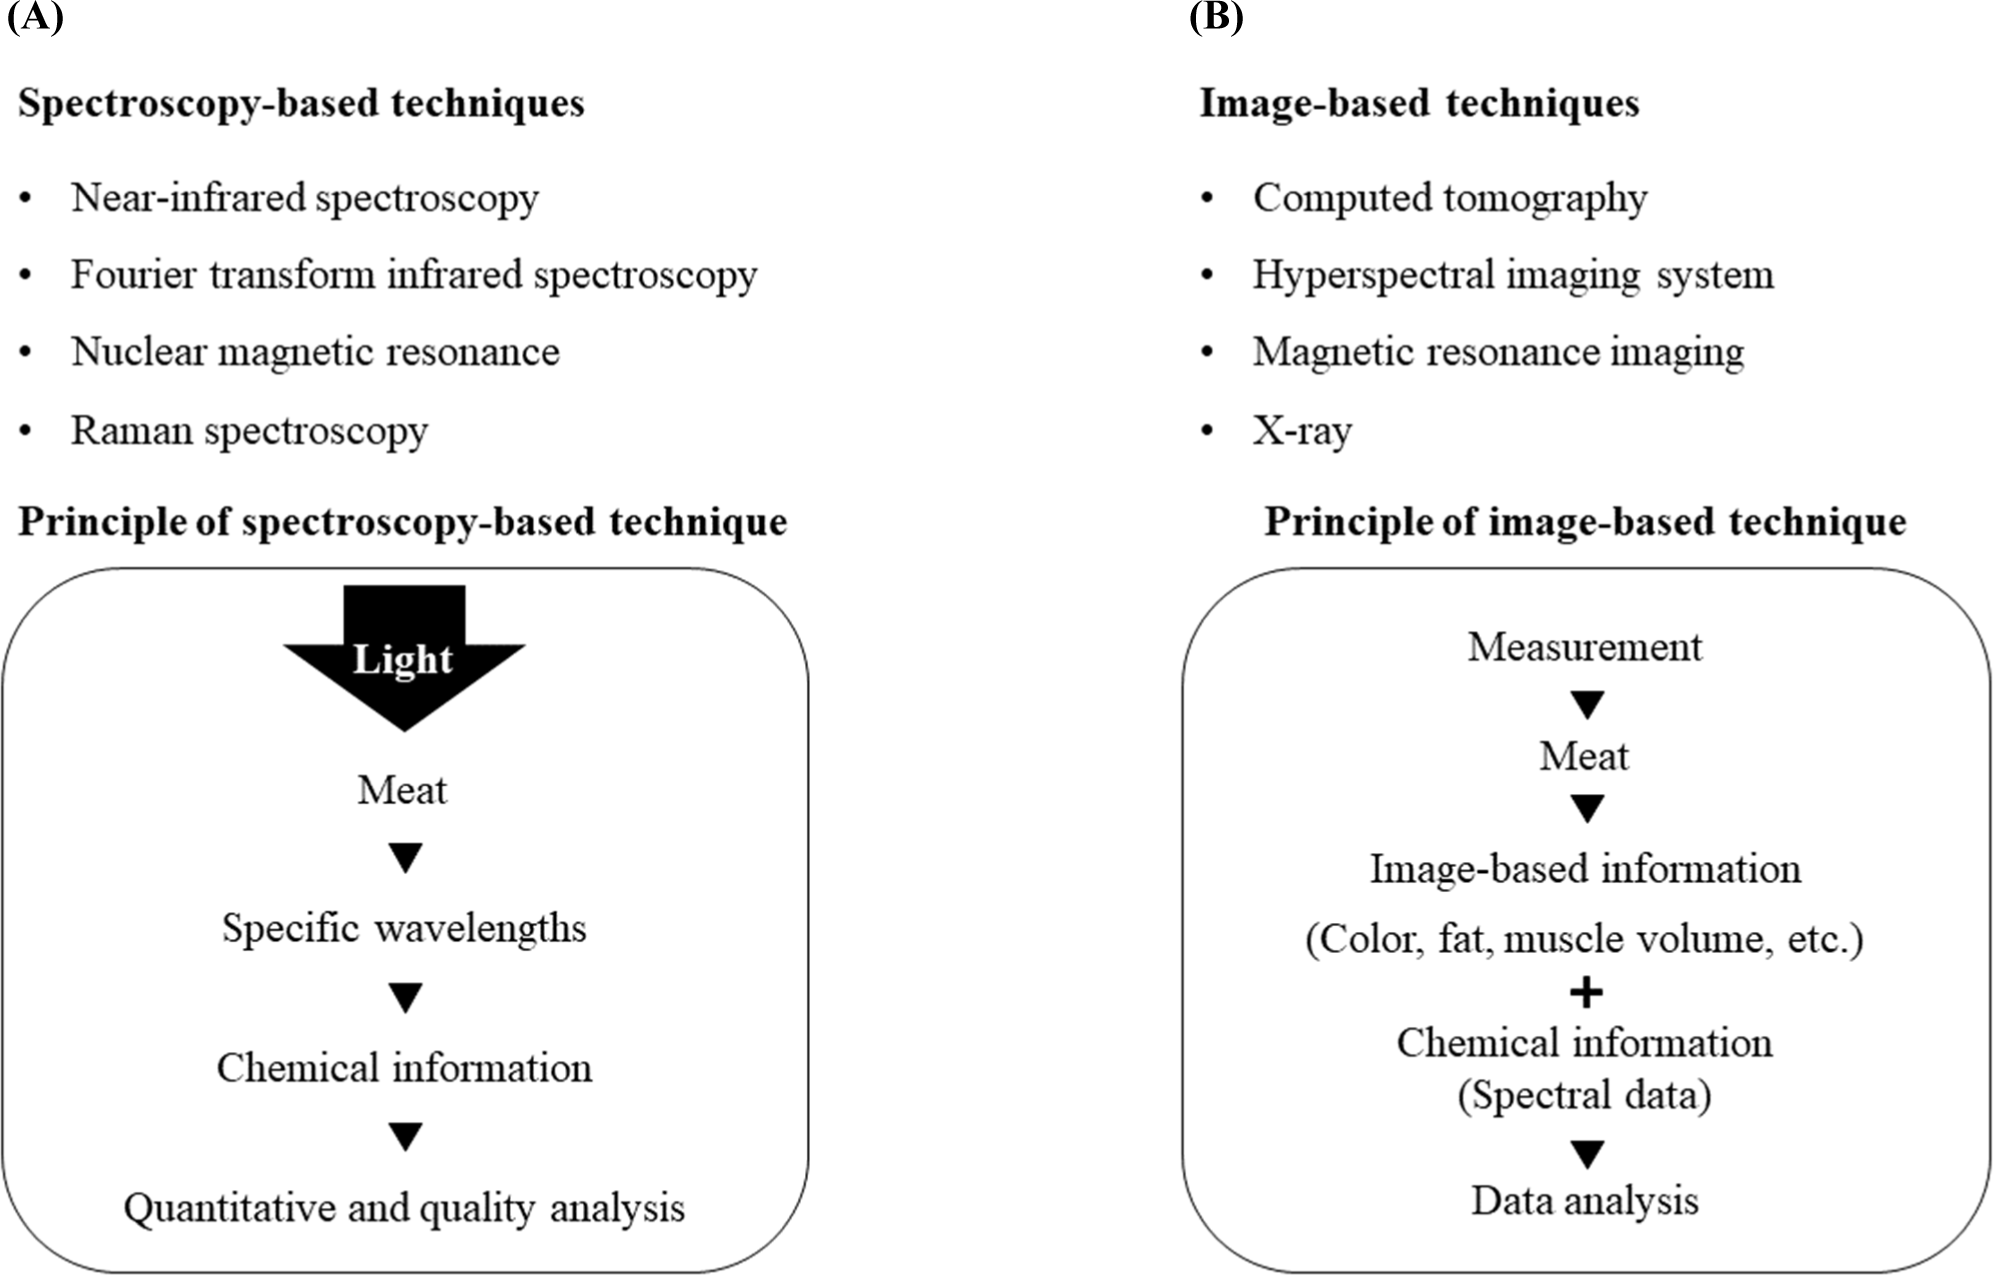
Fig. 2B shows the simple principles and types of imaging-based technologies. Imaging-based techniques include hyperspectral imaging (HSI), magnetic resonance imaging (MRI), computed tomography (CT), and X-ray imaging. These imaging technologies provide different information, which may or may not contain chemical information based on different principles for each technology. HSI is involved in the chemical information by providing the spectral data, which changes by the reflectance, absorbance, and transmittance. Therefore, studies monitoring the properties of frozen-thawed meat have been reported (Pu et al., 2015; Xie et al., 2015). However, studies that used MRI, CT, and X-ray imaging to measure or predict the quality of frozen meat are scarce.
Spectroscopy-Based Techniques
NIR spectroscopy uses the wavelength spectrum from 780–2,500 nm, providing the vibration and absorption bands of molecules (C, O, N, and H) that compose meat substances, such as proteins, lipids, and water (Prieto et al., 2009). Specific bands are related to specific components in meat. For example, fat and fatty acids can be detected at 920, 1,200, 1,716, 1,758, 2,136, 2,298, and 2,346 nm because these bands reflect the movement of C-H molecules (Cozzolino et al., 2002; ElMasry et al., 2011; Morsy and Sun, 2013). Cáceres-Nevado et al. (2021) observed high discriminant ability between fresh and frozen Iberian pork using NIR spectroscopy with partial least square-discriminant analysis.
In a previous study, FTIR spectroscopy was used to determine the chemical composition of a specific target. When infrared light irradiated the target sample, molecules absorbed light at particular frequencies that are relevant to the vibrations of chemical bonds (such as C-H in proteins and lipids; Berthomieu and Hienerwadel, 2009). In this method, the non-processed data from the time or spatial domains, are converted to the frequency domain by a mathematical process known as the Fourier transform. After the data is processed, the peak wavelength absorbance represents specific vibrations of functional groups in the meat (Candoğan et al., 2021). This could be used to observe the chemical modification caused by freezing meat. Therefore, this technology was used to discriminate between different freezing conditions; for example, Ropodi et al. (2018) showed classification rates (CC%) of 100% and 93.33% in training and test sets, respectively, when distinguishing between fresh-minced and frozen beef under storage at –20°C for 7 and 32 d.
NMR is based on the electromagnetic signals of certain nuclei aligned in an external magnetic field (Khan et al., 2022). When the nuclei are exposed to the magnetic field, they align in the direction of the magnetic field and are disturbed by the application of radiofrequency pulses (Hatzakis, 2019). After this process, the disturbed nuclei return to the equilibrium state by emitting energy that corresponds to the characteristic resonance frequency based on their unique atomic environment, providing information on the specific molecular structures and target composition (Antequera et al., 2021). For example, a previous study combined NMR and multiple linear regression to predict the properties of the meat of Atlantic mackerel (Gudjónsdóttir et al., 2019). However, a combination of multivariate statistical methods and NMR has not yet been used to predict variations in meat quality after frozen storage.
Raman spectroscopy can provide information on chemical components that can be used to predict the quality of frozen-thawed meat. This analysis is based on the inelastic scattering of light, where laser photons interact with meat molecules, allowing for the analysis of sensitive modifications (lipid oxidation, water content, and conformational changes in proteins) during frozen storage (Chen et al., 2023; Qu et al., 2022). Chen et al. (2020) found that hardness continuously increased with repeated freeze-thaw cycles due to the change in hydrophobicity and structural composition of the protein in meat. They used a model with partial least squares regression (PLSR) to predict the texture of frozen beef under various conditions, and showed that it performed well, but could not predict springiness. In addition, Chen et al. (2023) showed that repeated freeze-thaw cycles gradually reduced water content in the beef and continuously increased thawing loss. They also demonstrated that Raman spectroscopy can predict thawing loss and water content in repeatedly frozen-thawed beef.
Imaging-Based Techniques
Imaging technologies such as HSI, MRI, CT, and X-ray imaging are effective tools for measuring meat quality, and have been used in previous studies (Gao et al., 2024; Lambe et al., 2017; Perez-Palacios et al., 2023). However, HSI is the most commonly used technique for predicting the characteristics of frozen-thawed meat.
HSI combines imaging and spectroscopy. It provides a hypercube combined with the spatial information (X and Y) and spectral information (λ). Therefore, the physicochemical properties of the target samples could be monitored. Unlike specific parts of meat obtained by spectroscopy, HSI uses wavelengths from the entire target meat; the learned model corresponds to pixel values, providing information on the quality of meat by the value of each pixel, and evaluating the quality of meat in terms of appearance, which is an essential factor for consumers. Recently, HSI has been used to monitor frozen-thawed meat properties using multivariate statistical analyses and deep learning methods (Pu et al., 2015; Xie et al., 2015).
Cheng et al. (2022b) discovered that protein oxidation in pork meat increased with repeated freeze-thaw cycles. They also reported that the model (HSI with a deep learning algorithm) performance was excellent in predicting carbonyl and sulfhydryl contents (r2P=0.9275 and r2P=0.9512, respectively) using fluorescence HSI with PLSR. In addition, their model predicted increased carbonyl content and TBARS in pork meat during repeated freeze-thaw cycles (Cheng et al., 2023b). The α-helix fraction in actomyosin of pork into β-sheet and random coils by frozen storage were predicted to be r2C=0.789 and r2P=0.836 in the calibration and prediction sets using HSI and PLSR, respectively (Cheng et al., 2019). The mean reflectance spectrum data acquired from HSI showed differences between frozen-thawed pork samples at different temperatures (Cheng et al., 2018; Xie et al., 2015). Therefore, physicochemical modification by various frozen storage conditions may be reflected by the different HSI spectra.
Repeated freeze-thaw cycles release a higher thawing loss with increased freeze-thaw cycles. Therefore, 780 and 980 nm spectral bands were used to assess differences between pork meat that was repeatedly frozen-thawed, specifically related to the third and second overtones of O–H stretching in water molecules (Cheng et al., 2023a). In addition, different frozen storage conditions affect myoglobin, such as myoglobin oxidation, which can be determined by specific bands (Jeong et al., 2025). The 434 and 470 nm bands are used to determine deoxymyoglobin and metmyoglobin levels, respectively (Droghetti et al., 2013; Kamruzzaman et al., 2016). A model using the full wavelength spectrum requires considerable time and computer performance for implementation. Therefore, methods such as regression coefficients or variable importance in projections are used to select wavelengths, which can reduce the cost of establishing a model. Pu et al. (2015) used six wavelengths (400, 446, 477, 516, 592, and 686 nm) associated with myoglobin, de-oxymyoglobin, and total pigments to discriminate between fresh and repeatedly frozen-thawed meat. In another study, water content was measured at 970 nm to determine the differences between fresh and repeatedly frozen-thawed meat (Barbin et al., 2013).
Limitations and Future Trends
This review summarizes the complex changes that occur in the properties of frozen-thawed meat under different temperature and storage conditions. Thus, measurement of the changes in meat quality under different conditions is required. However, conventional methods are destructive and time-consuming. Non-destructive methods can compensate for the limitations of conventional methods. These techniques have been successful in monitoring frozen-thawed meat quality under different storage conditions, such as temperature, storage duration, and repeated freeze-thaw cycles. However, studies have shown how different frozen storage conditions at extended durations affect complex physicochemical properties, and that it is possible to monitor changes in the properties of frozen-thawed meat under different storage conditions.
There are limitations in the application of non-destructive technologies at the industrial scale, such as high initial start-up costs (non-destructive devices and production line modification; Khaled et al., 2021; Silva et al., 2020). To overcome these limitations, portable devices have been developed. However, the use of non-destructive analysis requires considerable time and economic resources to create a model for measuring the properties of frozen-thawed meat. The numerous variables in non-destructive analyses is among the main factors contributing to the extended learning process. Therefore, studies have been conducted to reduce the number of variables by employing principal component analysis, variable importance plots, and coefficient regression analysis (Dixit et al., 2021; Jia et al., 2024; Yang et al., 2017). However, non-selected variables may have relevant targets for measuring changes in meat properties. Therefore, deep learning methods that do not require variable selection have been proposed. However, these methods require suitable computer specifications. Therefore, the time and cost of applying non-destructive techniques at the industrial scale must be considered.