


Introduction
Poultry is the world’s most consumed livestock per capita. In 2022, global poultry consumption is anticipated to be 14.85 kg per capita (OECD-FAO, 2021). In addition, the global consumption of poultry meat is expected to account for 41% of all protein consumed from meat sources in 2030 (OECD-FAO, 2021). In line with this global trend, chicken consumption has increased in Korea (Park et al., 2020). According to the Korean Rural Development Administration, chicken consumption per capita reached 15.76 kg in 2020 (Rural Development Administration, 2021).
Korean native chickens (KNC), however, have experienced different demand patterns than overall chicken consumption. KNC has shown a slower growth rate than commercial broiler (CB), resulting in higher market price for KNC (Cha et al., 2014; Jin et al., 2017). CB is the most commonly bred chicken on Korean farms (Cha et al., 2014). On the other hand, the market share of KNC was only 2.8% in June 2021 (Korea Animal and Plant Quarantine Agency, 2021) and showed low consumer interest (Cha et al., 2014). Despite the increasing trend in chicken consumption, few consumers are interested in comparing chicken varieties, which is an additional reason for the decline in the market share of KNC (Nam, 2019).
In addition to improving market share, consumption of local chicken breeds, such as KNC, is critical to Korea’s sustainable development. KNC contributes to the diversification of chicken varieties (Cha et al., 2014; Jin et al., 2017), and breed diversity increases adaptability to environmental change and resilience to disease, enhances economic usefulness (Jin et al., 2017; Seo and Lee, 2016), and plays an essential role in social and food security issues (Altieri, 1999). Breed variety is related to sustainable development in the environmental, economic, and social sectors (Hoffmann, 2011). Despite the importance of maintaining genetic biodiversity, unification of species phenomena persist in global companies (Kang et al., 2011). Thus, consumption of KNC could be helpful to conserve the diversity of species in Korea’s homogenous chicken breed environment.
KNC has different characteristics than CB, having less fat and more protein than CB. Moreover, KNC has a higher content of inosine 5’-monophosphate (IMP), which is a nucleotide in the muscle that imparts flavor to the meat (Ahn and Park, 2002; Choe et al., 2010). Several prior studies have discussed the physicochemical traits of and sensory experiments with KNC and CB chicken meat to improve KNC breed characteristics (Cha et al., 2017; Jung et al., 2013; Lee et al., 2018). Even though consumer sensory expectations of chicken could differ due to inherent meat properties, there is a lack of research on consumer perceptions.
According to a study by Nam (2017), consumers have differing opinions of KNC. Five hundred consumers were surveyed about their perceptions of KNC. The results were ironic in that consumers simultaneously preferred the chewiness and disliked the toughness of KNC. Not only consumer opinions, but also sensory evaluations can be helpful to understand consumer preferences. Sensory evaluations can be influenced by experiences and presented information (Deliza and MacFie, 1996). Thus, consumer behaviors regarding KNC are needed to expand the limited KNC academic knowledge base.
According to the food-related behaviors schematic model (Cardello, 1994), sensory attributes such as taste, smell, texture, appearance, and temperature affect food acceptance and purchase behaviors. Additional information can also affect consumer perception, such as its production method, country of origin, composition, or nutritional quality (Cerjak et al., 2011; Deliza and MacFie, 1996). Prior studies have conducted similar sensory experiments on the relationship between food information and purchase behaviors. According to Choi and Moon (2021), consumer sensory evaluations of identical citrus wines showed different results depending on the information provided regarding their origins and product processing sites. Hwang et al. (2021) performed consumer sensory evaluations of the same salami but with varying information about antibiotics, grazing, and animal welfare. When information was given to consumers, they rated sensory attributes differently and showed higher purchase intention and willingness to pay (WTP). Previous studies have identified that product information cues affect consumer sensory evaluation and purchase behaviors. Despite the information effect on consumer choices, few studies have focused on the effects of breed information on consumer sensory evaluations and purchasing behaviors for chicken.
As mentioned above, prior studies have not evaluated consumer behavior on KNC. Therefore, this study aimed to determine the effect of KNC breed information cues on consumer sensory evaluations and purchase behaviors. We intended to derive marketing strategies that could improve the low market share of KNC and increase its sustainability.
Materials and Methods
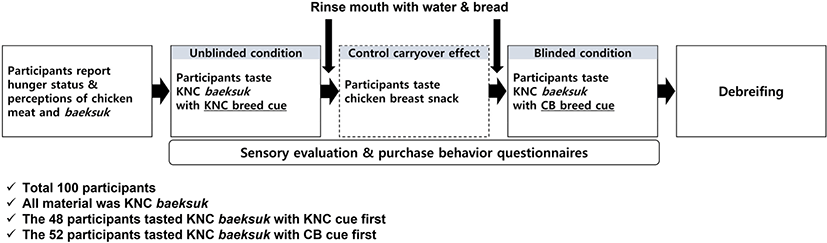
A total of 100 healthy adult consumers was recruited using an online platform and was paid for participation. The participant recruitment information was posted, including clear guidelines of the requirements. In particular, eligible participants should not be experts in the food industry and should not have chicken allergies. The purpose and procedures of the study were explained clearly. In this study, general untrained consumers participated in the sensory analysis. Training was prohibited because the purpose was sensory analysis and not correct classification of a specific taste. The aim was to investigate the difference in taste perceived by general consumers according to chicken breed cue. When using untrained consumers in a sensory analysis, more than 100 samples are required (Nestrud and Lawless, 2011; Oliver et al., 2018; Perrin et al., 2008; Risvik et al., 1994). Therefore, this study recruited 100 untrained, general consumers to conduct sensory analysis. All participants provided informed consent before the start of the experiments, which were approved by the Seoul National University Institutional Review Board (IRB No. 2108/003-003).
This study used a typical Korean chicken dish, baeksuk, to analyze consumer perceptions of the sensory attributes of KNC. Samgyetang is a traditional Korean food in which glutinous rice, garlic, jujube, and ginseng are placed in a chicken stomach and boiled (Yoo et al., 1998). Baeksuk (Korean boiled chicken soup) is a seasonal summer health food made by boiling unseasoned chicken in water (Jang and Lee, 1988). Baeksuk is a common experimental material in chicken sensory testing (Han et al., 1996; Han, 2018; Jang and Lee, 1988; Jayasena et al., 2013; Jung et al., 2019; Kim et al., 2012). In summary, this study conducted sensory evaluations and consumer behavior surveys using KNC cooked in baeksuk.
Frozen KNC meats were used for the experiments. The chickens weighed approximately 600 grams each after slaughter. The chickens were halved manually using poultry scissors and boiled in premade stock to ensure the consistency of the flavor. A total of 100 mL of concentrated liquid chicken stock was diluted in 10 L of water. Then, the following flavors were infused into the base stock: 500 g of white radish, 100 g of garlic, 50 g of ginger, and 200 g of chopped onion. Additionally, 70 g of sea salt was added. The stock was refreshed every three experimental sessions. The 20 halved chicken pieces were boiled in the premade stock for 20 min; 10 of these pieces were removed for the second sensory evaluation. The remaining boiled chicken halves were served on rice with broth.
The consumers participated in two experimental conditions (KNC and CB cues) and evaluated sensory attributes immediately after tasting. The CB is the most commonly consumed chicken in Korean (Lee et al., 2012) and so was compared with the KNC. The samples were labeled with random three-digit numbers in a monadic sequence to avoid first-order carryover effects (Macfie et al., 1989). The KNC experimental condition provided KNC breed information with a KNC meat sample (unblinded condition). The CB experimental condition provided CB breed information with a KNC meat sample (blinded condition). The carryover effects are sensory biases due to residual sensations from previously tested (tasted) samples (Ferris et al., 2003; Lawless and Heymann, 2010; Meilgaard et al., 1999). Therefore, a sample of unrelated chicken breast was provided to the participants between the KNC and CB experimental conditions to control the carryover effects. The participants were seated behind dividers to obscure the responses of the other participants.
The experiment was conducted using a within-subject design, and the participants were randomly assigned to minimize the ordering effect. Forty-eight participants were assigned to the KNC condition first, while 52 were assigned to the CB condition first. Participants were asked to taste each sample and evaluate the same sensory attributes of each. Each participant received water and a piece of bread to clean the palate between evaluations. The duration of the experiment was 7 min. Table 1 and Fig. 1 show a summary of the experimental design.
| Number | Material | First information | Second information | Number of participants |
|---|---|---|---|---|
| 664 | KNC | CB | KNC | 52 |
| 953 | KNC | KNC | CB | 48 |
The sensory evaluation survey was conducted using sensory analysis and purchase behavior questionnaires (Tables 2 and 3). For sensory analysis, taste (sweet, salty, bitter, umami), odor (oily, intense, metallic), and texture (tender, juicy, chewy) were measured using a 7-point scale (1, very weak; 7, very strong). The sensory attributes were chosen based on past studies on chicken sensory analysis attributes. Purchase behavior, satisfaction, and purchase intention were measured using a 7-point scale (1, strongly disagree; 7, strongly agree). The purchase behavior items were modified to fit chicken meat sensory evaluations. To measure participant WTP, we reported whether they would purchase the chicken at the presented market price.
| Attributes | Definition | Reference | |
|---|---|---|---|
| Taste | Salty | The taste on the tongue associated with sodium ions1). | (Liu et al., 2004) |
| Sweet | The taste on the tongue associated with sugars1). | (Sow and Grongnet, 2010) | |
| Bitter | The taste on the tongue associated with bitter agents such as caffeine1). | ||
| Umami | The taste on the tongue associated with monosodium glutamate (MSG)2). | (Escobedo del Bosque et al., 2020) | |
| Odor | Oily | The intensity of the fatty odor of the meat. | (Sow and Grongnet, 2010) |
| Intense | The intensity of the chicken odor. | ||
| Metallic | The intensity of the smell of metal/blood. | (Kruk et al., 2011) | |
| Texture | Tender | The intensity of the tenderness of the meat after the first bite. | (Sow and Grongnet, 2010) |
| Juicy | The intensity of the juiciness of the meat in the mouth. | ||
| Chewy | The intensity of the meat’s chewiness. | ||
1) Adapted from Johnson and Civille (1986).
2) Adapted from Leong et al. (2016).
| Constructs | Items | Reference |
|---|---|---|
| Satisfaction | In general, I am satisfied with this product. | (Juhl et al., 2002) |
| The product I ate fulfilled my expectations. | ||
| When I imagine perfect chicken meat in baeksuk, this product is close. | ||
| Purchase intention | I am highly likely to purchase this product. | (Dodds et al., 1991) |
| In the near future, I would consider purchasing this product. | ||
| I am very willing to buy this product. |
The statistical analysis was conducted using principal component analysis (PCA) and a multiple linear regression model. The PCA was performed in four groups (KNC breast, KNC leg, CB breast, and CB leg) to investigate the differences of sensory attributes according to chicken breed cues (KNC and CB) and part of chicken (breast and leg). The PCA was performed using the sensometrics software program SENSOTOOL (Sensometrics, Seoul, Korea). This study conducted multiple linear regression analyses to investigate the statistical difference between sensory attributes and purchase behavior based on chicken breed cues. A multiple linear regression model was performed using the open-source R software program (R Core Team, Vienna, Austria).
Results and Discussion
A descriptive analysis of the participants is shown in Table 4. The study sample consisted of 50 males and 50 females, with a total of 100 participants. Table 4 also indicates the participants’ hunger status and usual perceptions of chicken meat and baeksuk (1, not at all; 7: very much). Participants were generally not very hungry when participating in the experiments and typically liked chicken meat and baeksuk.
The sensory data were standardized and analyzed using PCA. The PCA results show that Dim1 and Dim2 significantly discriminated between KNC and CB (p<0.05), explaining 65.95% and 31.22% of the sensory data variation, respectively. Dim1 describes the dimensions of sweet, bitter, umami, oily odor, juicy, and chewy texture attributes. Dim2 describes the dimensions of intense, metallic odor, and salty taste attributes.
The PCA results also reveal representative sensory attributes of KNC breast, KNC leg, CB breast, and CB leg (Fig. 2). In other words, the PCA map shows that the sensory attributes are clearly distinguished by chicken breed cues (KNC and CB) and chicken part (breast and legs). The PCA map also explains how taste, odor, and texture were evaluated differently based on chicken breed cues and part of the chicken.
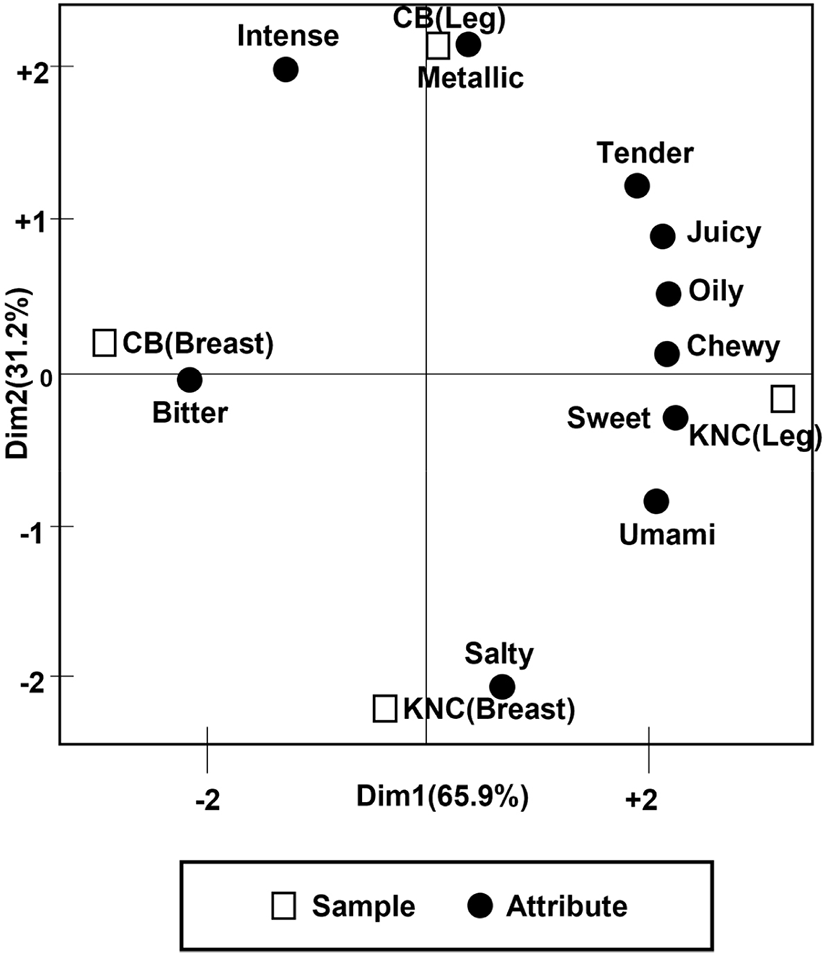
Chicken breast with a KNC cue was characterized by high levels of salty taste. Chicken breast with a CB cue was strongly associated with bitter taste attributes. The results show that the participants considered the chicken breast to taste saltier when they knew that the breed was KNC. In addition, the results indicate that participants evaluated the taste of chicken breast to be more bitter when they knew that it was CB.
Chicken legs with a KNC cue were characterized by high expression of the sensory attributes of chewy, sweet, oily, juicy, tender, and umami. Chicken legs with a CB cue were characterized by high expression of the sensory attributes of metallic and intense. The results show that the participants considered the chicken leg chewier, sweeter, juicier, oilier, more tender, and with greater umami when they knew that the breed was KNC. Participants also evaluated chicken legs to be more metallic and intense when they were informed that the breed of chicken was CB.
Demographic factors have a variable impact on sensory evaluation of meats (O’Reilly et al., 2020). Hunger status has a significant effect on sensory evaluation, especially flavor (Christensen, 1983). Consumer perception of meat affects the sensory evaluation. In general, people who enjoy red meat and consider it an important part of their lives tend to give it higher sensory scores (Thompson et al., 2005). The sensory scores of a participant assigned to a sample can be affected by the number of previous samples tasted, illustrating an ordering effect (Ball, 1997). In this regard, demographic factors (age and gender), hunger, perception of chicken meat, and material order were used as control variables to eliminate biases in extraneous variables other than the independent variables.
The results show (Table 5) that, with KNC meat, the umami (β=0.145, p<0.05) and chewy texture (β=0.237, p<0.001) were significantly higher. The juicy texture and metallic odor were not significant but showed meaningful increasing and decreasing tendencies when the chicken breed was KNC compared to CB, respectively. In other words, the participants considered the chicken breast to have a higher umami taste and chewier texture when they knew that the breed of chicken was KNC. Moreover, the participants tended to think that the chicken breast had higher juiciness and lower metallic odor when they were informed that the breed was KNC. These results agree with a similar tendency in prior research of KNC. Even though participants tasted the same chicken materials, they assigned different attribute scores depending on breed cue information. According to Jayasena et al. (2014) and Lee et al. (2018), KNC breasts and legs have more umami-related compounds such as arachidonic acid than do CBs. KNC breast and leg texture had higher chewiness and juiciness in prior sensory evaluations (Cha et al., 2014; Kim et al., 2018), which included a descriptive sensory analysis with trained assessors. KNC breast has more flavorful volatile compounds than CB (Lee et al., 2012). Therefore, the negative metallic odor could be lower in KNC. In this respect, this study supports the results of previous studies that KNC is more umami, chewier, juicier, and less metallic than CB. In addition, the scope of the study was expanded by interpreting these results from the perspective of providing information on chicken breed.
The results also show that demographic factors, hunger, perception of chicken meat, and material order had a significant effect on the sensory evaluation of the chicken breast. Participants rated the umami taste as higher when they had a greater preference for chicken meat. Participants rated the texture as chewier when they (1) were female, (2) preferred chicken meat, (3) did not prefer chicken breast, and (4) preferred baeksuk. Therefore, demographic factors, hunger, perception of chicken meat, and material order were statistically controlled in the regression model for chicken breast attributes.
The results show (Table 6) that, when the chicken breed was KNC, the salty taste (β=0.147, p<0.05), umami taste (β=0.166, p<0.01), juicy texture (β=0.163, p<0.05), and chewy texture (β=0.157, p<0.05) of the chicken leg were higher than when the chicken breed was CB. Therefore, the participants considered the chicken leg to be saltier and to have greater umami taste, juiciness, and a chewier texture when they knew that the breed was KNC.
The sensory attributes of the KNC leg showed similar results. Participants rated the KNC leg as more umami, chewier, and juicier, consistent with the results of previous studies (Cha et al., 2014; Jayasena et al., 2014; Kim et al., 2018; Lee et al., 2018). However, in the case of KNC legs, salty taste significantly increased when KNC breed information was given. These results should be interpreted considering the correlation between salty and umami tastes. Umami has been widely accepted as the fifth taste, alongside the other basic tastes of sweet, salty, bitter, and sour (Zhang et al., 2017). Umami means “good taste” or “delicious” in Japanese and is often used to describe a savory or meaty flavor (Han et al., 2018). Umami is less familiar than other tastes and is commonly confused with saltiness (Overberg et al., 2012). Since the peaks of the areas activated by umami and salty tastes are located in the mid-insula of the brain, they are closely related (Nakamura et al., 2011). In this regard, participants might concurrently rate chicken as saltier with more of an umami taste.
Participants indicated a higher salty taste when they (1) felt hungrier and (2) preferred baeksuk. Participants indicated a higher umami taste when they (1) were female, (2) did not prefer chicken breast, (3) preferred chicken leg, and (4) preferred baeksuk. Participants rated the texture as juicier when they (1) were female, (2) younger, (3) preferred chicken leg, and (4) preferred baeksuk. Participants indicated chewier texture when they (1) were female, (2) preferred chicken meat, and (3) preferred chicken leg. Thus, demographic factors, hunger, perception of chicken meat, and material order were statistically controlled in the regression model for chicken leg attributes.
The results show (Table 7) that the satisfaction (β=0.216, p<0.001), purchase intention (β=0.184, p<0.01), and WTP (β=0.230, p<0.001) of chicken baeksuk products were higher when the chicken breed was KNC than when it was CB. In other words, participants were more satisfied, had higher purchase intention, and were more willing to pay a higher price for chicken baeksuk products when the chicken breed was KNC than when it was CB.
The results show that the higher was the participants’ preference for chicken legs, the higher were their satisfaction, purchase intention, and WTP. It was also found that the higher was the participant’s hunger, the lower were their satisfaction and purchase intention. In addition, the WTP of chicken baeksuk products was higher in females and when participants tasted the second experimental sample. Therefore, demographic factors, hunger, perception of chicken meat, and material order were statistically controlled in the regression model for purchase behaviors.
These results imply that KNC breed information is a sensory cue that affects consumer perceptions and purchase behaviors, similar to Cardello’s (1994) food-related behavior model. These results are also consistent with previous studies that perceived sustainable information of food to affect purchase behaviors (de-Magistris and Gracia, 2016; Hwang et al., 2021; Seo and Lee, 2016). Consumption of KNC is related to sustainable development, which can be increased by promoting diverse chicken breeds (Cha et al., 2014; Hoffmann, 2011). Therefore, the results of this study contribute to the expansion of sustainable consumption by providing implications that KNC chicken breed information has a positive effect on purchase behavior.
Demand for food products depends on consumer expectations based on quality cues and quality attributes (Steenkamp, 1990). Quality cues are sensed before product consumption, and quality attributes are sensed after/during product consumption (Torquati et al., 2018). Quality cues are divided into intrinsic (size, color, other physical characteristics; Ophuis and Van Trijp, 1995) and extrinsic cues (price, brand, breed origin; Luning et al., 2002; Zanoli et al., 2013). Quality attributes are classified into experience and credence attributes (Nelson, 1970; Wilde, 1980). According to the results, KNC value could be highly based on extrinsic cues and consumer experiences. Therefore, emphasizing the unique characteristics and breed information would be helpful to construct consumer perceptions of KNC. As mentioned above, demand for KNC was fulfilled without credence in this study. Branding could be a solution to build consumer credence. Since brands are identified as significant extrinsic signals (Deliza and MacFie, 1996), they are built on consumer trust and relationships (Fernqvist and Ekelund, 2014). Branding KNC could have practical implications.
Branding consists of developing and maintaining sets of product attributes and values that are coherent, appropriate, distinctive, protectable, and appealing to consumers (Murphy, 1992). Moreover, branding allows assignment of the responsibility for controlling and delivering quality characteristics of meat (Bernués et al., 2003). KNC brand would be helpful to stakeholders who are related to KNC, such as producers, retailers, marketers, and consumers. Farmers could be encouraged to raise KNC breeds, the retailer could be interested in adopting new brands, it could be easier for marketers to promote KNC brand in contrast to no brand, and consumers could aid the credence and reliability of KNC products. In the Korean beef and pork industries, corporations have established brands as Korean beef (Hanwoo) and Korean pork (Handon) (Hanwoo Association, 2021; Handon Association, 2021). Each brand actively promotes products on TV and in retail marketplaces. Hence, to improve the market share of KNC, associations should make efforts to promote a brand.
This study conducted the first sensory evaluation of KNC breed information cue effects on general consumer sensory perceptions and purchase behaviors. This study utilized PCA to map the sensory attributes of KNC and CB, partly to understand how consumers react to sensory evaluations by breed information cues. Experiments were conducted with the same KNC materials and different cues, blinded samples of baeksuk (CB) and unblinded samples of baeksuk (KNC). In other words, even with the same KNC materials, the participant’s sensory evaluation and purchase behaviors differed according to the information provided on the chicken breed (KNC vs. CB). Even though the purpose of the study was not to correctly distinguish sensory characteristics, consumers well described the characteristics of KNC. In addition, the results showed a similar tendency to prior research on KNC. Previous studies have focused on improving KNC breed characteristics using trained sensory panel subjects (Cha et al., 2014; Kim et al., 2018; Lee et al., 2018; Park et al., 2010). Therefore, this study constructively conducted consumer research, which is limited in the KNC academic area.
While the results of this study provide academic and practical insights for KNC researchers and marketers, there are also several limitations. First, the majority of recruited participants was in their 20s and 30s. Participants should be recruited evenly across age categories for future studies to obtain more reliable and generalizable results. Second, umami and salty tastes can be confused by ordinary consumers. Therefore, future studies should control the consumer experience of the umami taste. Third, for future research, collecting actual purchase patterns with perceptions could generate more insightful practical implications.
Conclusion
This study examined the effects of KNC breed information cues on consumer sensory perceptions and purchase behaviors. Consumers were served the same KNC materials with two different conditions. The blind condition was served with the CB breed cue, and the unblinded condition was the KNC breed cue. Although evaluating the same materials, consumers reported different perceptions under the absence and presence of breed information. Sensory attributes and purchase behaviors were influenced by information cues. When consumers received the KNC breed information cue, they perceived significantly different sensory characteristics of KNC and demonstrated higher purchase behaviors. Therefore, the findings of this study offer marketing insights that could increase the demand and market share of KNC.