


Introduction
In South Korea, pork meat consumption was reported to have risen by the largest extent among all commercial meat products, with an increase of 27.92% during a period of five years – from 18.84 kg per person in 2011 to 24.10 kg per person in 2016 (MAFRA, 2018). Livestock products play a crucial role with regard to maintaining and managing physical stamina, as they are enriched with animal nutrients such as amino acids, fatty acids, and minerals, that cannot be replaced by common grains. Pork meat products are commercially available in seven different forms, that include loin and tenderloin, in addition to chuck roll, front legs, hind legs, belly, and ribs. For pork meat, the water holding capacity (WHC) is an important criterion, as it measures the level of drip loss during quality assessment. This is because the loss of moisture accounts for the largest contribution to the weight loss of meat during storage and processing. Additionally, the meat quality is known to depend on several factors including color, tenderness, juiciness, and pH (Park et al., 2007). Pork loin exhibits high marbling and is known to be a low-fat and high-protein food. Nonetheless, it is categorized as an unpopular cut, along with hind legs, and is often sold at lower prices. Consumer preferences are shown to tend towards pork belly and chuck roll, both with relatively higher fat content (Moon, 2002).
For processed meat products, the addition of phosphate enhances WHC, binding capacity, antioxidation ability, and the overall meat quality. The enhancement in WHC is due to an increase in the pH and ionic strength by the addition of phosphate, which either inhibits or ruptures the bonding between the myofibrillar proteins myosin and actin (Offer and Trinick, 1983; Moon, 2002). Phosphate addition also improves consumer acceptability by increasing the tenderness and juiciness of meat as a result of an enhanced WHC (Offer, 1991). The porcine gender and marketing date have a substantial influence on the characteristics of the dressed carcass and meat quality (Choi et al., 2000); we also know that the carcass weight and back-fat thickness also influence the carcass grade and quality (Park et al., 2005). The carcass grade has been reported to be determined by the weight, marbling score, tenderness, and meat color (Boggs and Merkel, 1984; Park et al., 2007). The meat color is known to affect the consumers’ desire to purchase, influencing their perception of its freshness (Zhu and Brewer, 1998). Meat color has been reported to have a close correlation to texture and WHC. It has been shown that WHC, in turn, can be predicted using the meat color (Joo et al., 1995; Norman et al., 2003). Therefore, this study suggests that unpopular cuts of pork meat from standard pigs and sows should be subjected to practical investigations for improving their usefulness, more specifically, by producing loin and tenderloin hams and analyzing their physicochemical quality properties so as to develop meat products with high acceptability.
For the carcass loin, studies have reported a considerable increase in carcass weight and length as well as significantly higher tenderness with increasing porcine age. The carcass length and loin surface area were 73.49 cm and 27.31 cm2, respectively, at the age of 120 days, which increased to 92.71 cm and 44.52 cm2, respectively, at the age of 170 days (Rhim et al., 1995). Moon et al. (2003) reported that a higher carcass weight resulted in lower cooking loss, whereas the shear force did not differ significantly. The porcine muscle has been reported to show differences in the texture and structural characteristics of muscle fibers with a large number of other changes brought about by weight gain (Harris and Shorthose, 1988; Wiklund et al., 1998). Furthermore, pork curing has been reported to improve the WHC via a tumbling process, which results in an increase in tenderness as well (Dzudie and Okubanjo, 1999).
This study, therefore, used meat from standard pigs and sows to produce hams using the unpopular cuts – loin and tenderloin. We then comparatively analyzed the physicochemical and sensory properties, with an aim to develop a meat product (ham) using low-cost sow meat, thereby increasing the usefulness of the processed meat products in order to enhance the productivity of hog farms.
Materials and Methods
In this study, curing formulation of curing solution was NaCl 1.5%, ice water 20%, and phosphate 0.3%, then keep in refrigeration at 4°C. Loin (M. Longissimus dorsi) and tenderloin (Psoas major) were selected from three carcass of standard and sow pigs and each samples were cut into three section (in total: 9 samples), its used for the test (standard pig: 1+ grade; sow pig: non-grade). Both types of samples were prepared in the same manufacturing as follow: injection of curing solution for loin and tenderloin were using a injector (injection rate: 20% of meat weight; IDEAL VA, Vakona, Lienen, Germany), and tumbling at tumbler (VTS-41, Biro, Marblehead, OH, USA) for 2 h. After tumbling, thermally processed in an 85°C chamber (OES 6.06, Onvotherm, Talstrasse, Germany) for 40 min.
Homogenates were prepared using 4 g meat samples and distilled water (16 mL). The pH of each homogenate was measured with a pH meter (Model S220, Mettler-Toledo, Greifensee, Switzerland). All measurements were performed in triplicate.
The color of uncooked and cooked meat samples were determined using a colorimeter (CR-10, Minolta, Tokyo, Japan; illuminate C, calibrated with a white plate, CIE L*=+97.83, CIE a*=−0.43, CIE b*=+1.98). Lightness (CIE L*), redness (CIE a*), and yellowness (CIE b*) values were recorded.
The WHC was measured by modification of the procedure of Grau and Hamm (1953). Briefly, a 300 mg meat samples of each treatment was placed in a filter-press device and compressed for 3 min. The WHC was calculated from duplicate samples as a ratio of the sample film area to the total area; hence, a larger value suggests a higher WHC:
Curing yield (%) and cooking loss (%) were determined by calculating the weight difference for ham before and after curing and cooking as follows:
The shear-force of each sample was prepared by cutting samples into 1.1×3.0×1.1 cm3 blocks and analyzed using a V-blade attached to a Texture Analyzer (test speed, 4.0 mm/s; distance, 13.0 mm; force, 5 g; TA 1, Ametek, Berwyn, PA, USA). Nine blocks per each sample were analyzed for shear force. Measured values are expressed in kg.
Fifteen panelists were using basic taste identification test and trained with commercial pork loin and tenderloin products for 2 wk (three 30 min sessions per week) to the product characteristics planned to be evaluated. Each pre-cooked sample was warmed, sliced 12 mm thick and served to panelists. The color (1=extremely undesirable, 10=extremely desirable), flavor (1=extremely undesirable, 10=extremely desirable), tenderness (1=extremely tough, 10=extremely tender), juiciness (1=extremely dry, 10=extremely juicy), and overall acceptability (1=extremely undesirable, 10=extremely desirable) of the cooked sausage samples were evaluated using a ten-point descriptive scale.
The results obtained from at least three replicate experiments were selected to calculate the mean and standard deviation using SAS 3.0 software. The sensory evaluation was performed using a Likert scale ranging from 1 point (poor) to 10 points (excellent), and an arithmetic average was calculated. The differences between the mean values of the experimental groups were analyzed using Duncan's multiple range tests and t-tests to determine the statistical significance at the p<0.05, p<0.01, and p<0.001.
Results and Discussion
The pH and color of loin ham and tenderloin ham produced using the meat from standard pigs and sows are presented in Table 1. The pH levels of loin ham before cooking were found to be 5.79 and 6.18 for those from standard pigs and sows, respectively, with the higher pH found in the latter (p<0.001). The pH levels of tenderloin ham before cooking were 6.02 and 6.21 for the products from standard pigs and sows, respectively, with the higher pH found again in the latter (p<0.001). After cooking, the pH levels of loin ham were 5.83 and 6.10 for the products from standard pigs and sows, respectively, with the higher pH in the latter (p<0.01), and the pH levels of tenderloin ham were 6.07 and 6.23 for the products from standard pigs and sows, respectively, with the higher pH in the latter (p<0.01). Such results were consistent with the report of Dzudie and Okubanjo (1999), which showed that higher the pH of the source meat, the higher is the pH of the final ham product, as well as with the reports of Morin et al. (2002) and Kim et al. (2010).
CIE L* values of loin ham before cooking were found to be 43.87 and 38.05 for the products from standard pigs and sows, respectively, showing a significant difference (p<0.001). For tenderloin ham, the CIE L* values were 40.58 and 38.00 in standard pigs and sows, respectively, being higher for the former (p<0.01). CIE L* values of loin ham after cooking were found to be 71.54 and 64.05, respectively, with a higher level in standard pigs (p<0.01), while for tenderloin ham, they were 68.47 and 59.69, respectively, being higher for the former (p<0.001).
CIE a* values of loin ham before cooking were found to be 4.26 and 5.19 for the products from standard pigs and sows, respectively, showing a significant difference (p<0.01). For tenderloin ham, they were 6.36 and 8.78, respectively, with a significantly higher value for the ones from sows (p<0.001). CIE a* values of loin ham after cooking were determined to be 5.47 and 7.68 for those from standard pigs and sows, respectively, with the loin ham from sows displaying a more intense red color (p<0.01). For tenderloin ham, they were 6.01 and 8.03, with the redness being higher for the sow product (p<0.001).
CIE b*values of loin ham before cooking were found to be 12.19 and 8.00 for the products from standard pigs and sows, respectively, with a more intense yellow color in the loin ham from standard pigs (p<0.001). In the case of tenderloin ham, they were 8.98 and 7.15, respectively, with the yellowness being higher for the products from standard pigs (p<0.001). CIE b* values of loin ham after cooking were 12.47 and 10.60 for the products from standard pigs and sows, respectively, with that from the former showing a higher value (p<0.01). For tenderloin ham, no difference CIE b* values was found between the samples from standard pigs and sows, which both displayed similar value.
The results partly agreed with the report of Choi et al. (2000) where the lightness (L*), redness (a*), and yellowness (b*) did not show significant differences with respect to the slaughter date; the agreement was with the pattern shown by b* whereas the results disagreed with respect to L* and a*. This results of this study are also in agreement to those of Martin et al. (1980) that found a significant difference in carcass weight and to those of Jin et al. (2006) where a significant difference in redness (a*) was observed in regard to carcass grade.
The WHC of loin ham and tenderloin ham produced using the meat from standard pigs and sows is as shown in Fig. 1. The WHC of loin ham was 59.35% in sows and 48.92% in standard pigs, with the sow loin exhibiting higher WHC than standard pigs (p<0.01). The WHC of tenderloin ham were 64.97% and 53.05% in sows and standard pigs, respectively, showing a significantly large difference between the two groups (p<0.001).
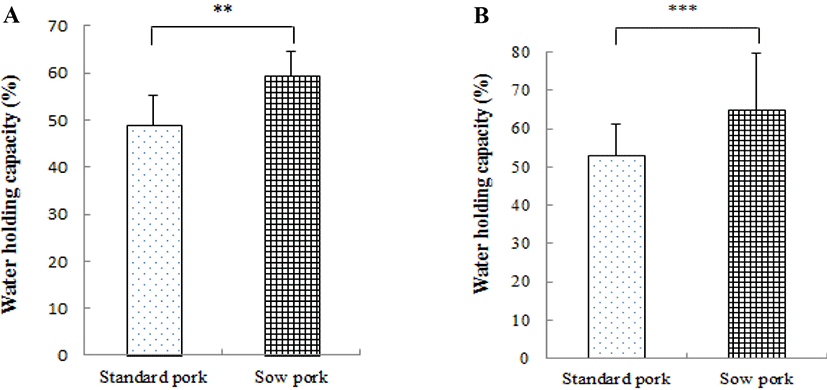
The results agreed with the report of Seo (1982) where the WHC of meat increased with increasing porcine age. In addition, Huff-Lonergan and Lonergan (2005) reported that WHC could be an important determinant of pork meat quality, indicating that poor-quality meat with substantial moisture excretion would incur economic loss, while Kauffman et al. (1992) and Stetzer and Mckcith (2003) reported that pork meat with a high level of drip loss would generally cause ≥5% moisture loss. The usefulness of sow tenderloin is likely to be improved through the manufacture of a low-cost ham product where the muscle shape is preserved.
The curing yield of loin ham and tenderloin ham produced using the meat from standard pigs and sows is shown in Fig. 2. The curing yields of loin ham were 106.74% and 114.28% in standard pigs and sows, respectively, with the loin ham from sows exhibiting a higher curing yield than that from standard pigs with a significant difference (p<0.01). For tenderloin ham, the curing yield was 117.59% in sows, which was significantly higher than the 109.33% obtained in case of tenderloin ham from standard pigs (p<0.05).
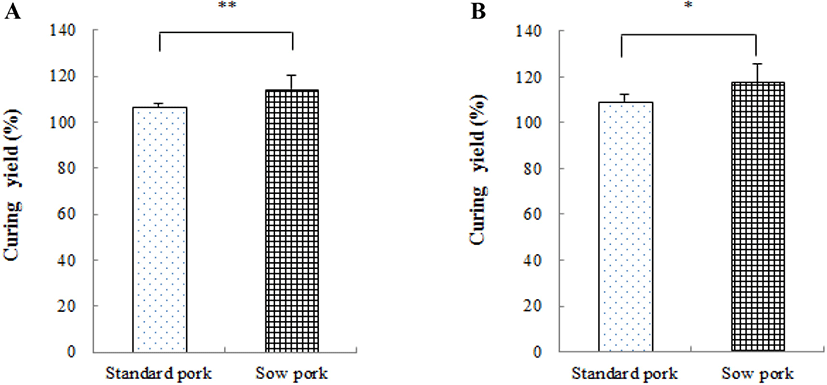
The results had a similar trend to those of Virgili et al. (2003) where the higher the porcine age, the lesser the drip and cooking loss. The processing yield of cured ham production was also reported to have improved with an increase in WHC according to tumbling time (Gillet et al., 1981; Dzudie and Okubanjo, 1999). Thus, the higher WHC and curing yield in sows, as shown in the previous sections, is supposed to lead to outstanding process suitability for meat products such as hams.
The cooking loss of loin ham and tenderloin ham produced using the meat from standard pigs and sows is as shown in Fig. 3. The cooking losses of loin ham were 22.76% and 20.36% for the loin ham from standard pigs and sows, respectively, with that of the latter being significantly lower (p<0.01). The cooking loss of tenderloin ham was 26.06% in sows, a significantly lower value than the 28.31% obtained for those from standard pigs (p<0.01).
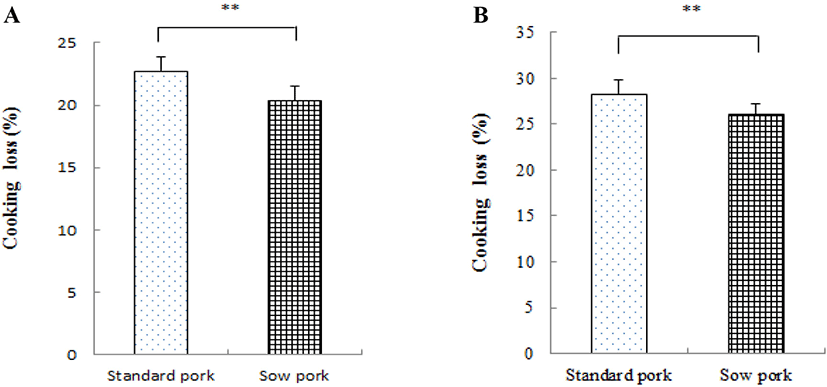
The results may be attributed to the more outstanding WHC in sows than in standard pigs, and they agreed with the reports of Candek-Potokar et al. (1998) and Virgili et al. (2003), where the cooking loss decreased with an increase in porcine age. Thus, it was concluded that the sow loin and tenderloin, with a lower level of cooking loss, would lead to the production of higher quality ham than those obtained from standard pigs.
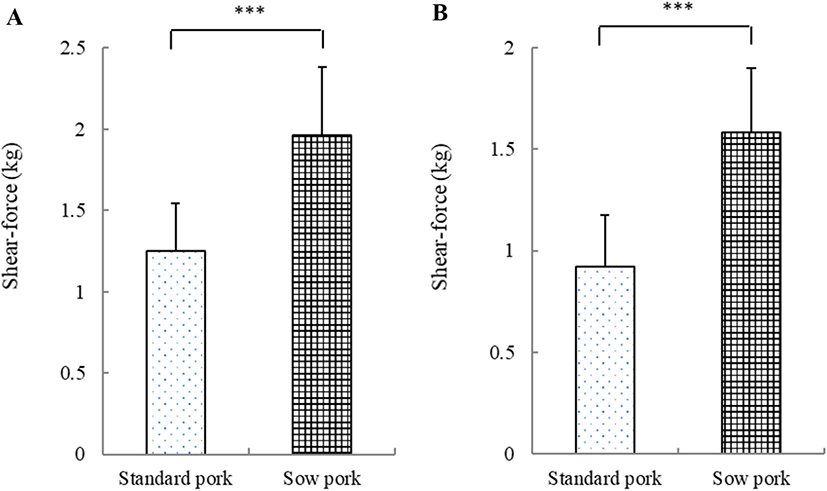
The shear-force of the loin and tenderloin ham from standard and sow pigs is shown in Fig. 4. Shear-force of loin ham and tenderloin ham of sow was significantly higher than those of standard pig (p<0.001). These results were consistent with the report of Fang et al. (1999) and Kauffman et al. (1964). The reason for this increase in shear-force can be attributed to the thickening of the intramuscular connective tissue, that is related to an increase in the toughness of pork during the growth of pigs (Fang et al., 1999; Cross et al., 1973).
The result of the sensory evaluation for the loin ham and tenderloin ham produced using the meat from standard pigs and sows is presented in Table 2. The color values were 7.6 in sows and 8.2 in standard pigs, with sow loin ham showing a lower trend but without statistical significance. The color of tenderloin ham was significantly lower in sows (7.1) than in standard pigs (8.2) (p<0.01). The flavor of loin ham and tenderloin ham showed a similar trend without a significant difference between standard pigs and sows. The tenderness values of loin ham were 7.6 and 8.8 in sows and standard pigs, respectively, with sow loin ham being less tender (p<0.01), while the tenderness values of tenderloin ham were 6.9 and 8.0, respectively, with a significantly lower tenderness in the case of sow tenderloin ham (p<0.01). Loin and tenderloin of sow pork gave lower values in tenderness evaluation. This was due to the high value of shear-force. In this regard, a way to reduce the shear-force should be found, like using a meat tenderizer, when making ham product from sow pork. For juiciness and off-flavor, both loin and tenderloin hams showed similar trends for sows and standard pigs, without any statistical significance. Additionally, the overall acceptability did not differ significantly between sows and standard pigs for both loin and tenderloin hams, although it was higher for both products derived from standard pigs than for those derived from sows.
Such results were in line with the report of Seong et al. (2008) that found no significant difference in color and flavor between loin ham and other meat area hams. Furthermore, Brady (1954) reported that savoriness, juiciness, and tenderness are the essential indicators of sensory quality evaluation for meat products. Thus, based on the findings of this study where the savoriness and juiciness of loin ham and tenderloin ham were similar between the products of standard pigs and sows without a significant difference, the consumer preference is likely to improve towards sow loin or tenderloin cuts when ham products made from them are commercialized.
Conclusion
The present study compared and analyzed the physicochemical properties of loin and tenderloin obtained from standard pig and sow. Important factors as a ham product, pH, WHC, curing yield and cooking loss were excellent of using sow pigs loin and tenderloin were more than standard pigs loin and tenderloin. Therefore, sow pigs loin and tenderloin is suitable for ham product.