


Introduction
Meat is a crucial source of human nutrition, but it can easily deteriorate via degradation and denaturation of proteins, activation of enzymes, oxidation, and microbial spoilage (Benjakul et al., 2003; Joo et al., 1999; Ngapo et al., 1999; Rahman, 2007).
Freezing is an effective process to prolong the shelf life of meat (Choi et al., 2016; Kim et al., 2015). Conventional freezing technologies, including air blast freezing, have typically low freezing rates, which is closely related to the quality deterioration of meat products (Choi et al., 2016; Sun and Li, 2003). A low freezing rate induces the formation of large and irregular ice crystals, thereby leading to damage of cell membrane and muscle tissue (Kaale et al., 2013). This may lead to increases in thawing loss, protein denaturation, and reduction of space within the myofibrils (Huff-Lonergan and Lonergan, 2005; Zhan et al., 2017).
Therefore, several novel freezing techniques, such as deep freezing, individual quick freezing, and high-pressure freezing, have been applied to accelerate the freezing rate (Boonsumrej et al., 2007; Szymońska et al., 2000; Zhan et al., 2017). Deep freezing shortens the freezing time, particularly the phase transition time of water to ice. It induces the formation of smaller ice crystals and minimizes the damage to tissue compared with conventional freezing techniques (Soyer et al., 2010). Notably, a shorter phase transition time of water to ice is crucial to inhibit freezing-induced denaturation of proteins (Kim et al., 2013; Li and Sun, 2002).
The final temperature in the freezing process and storage temperature also play critical roles in determining the amount of water in the meat (Leygonie et al., 2012b). Biochemical reactions can occur in frozen meat at temperatures higher than −20°C owing to the remaining free water (Petrović, 1982). Such reactions can initiate the primary lipid oxidation process in the frozen meat, leading to radical secondary lipid oxidation and causing unfavorable changes in color, odor, and flavors (Owen and Lawrie, 1975). The optimal freezing storage temperature of meat products has been estimated to be at −40°C (Estévez, 2011). Zhou et al. (2010) suggested that foods should be stored below −55°C for freezing storage. Recently developed home-scale deep freezers enable for customers to store foods at such lower temperatures.
Regardless of the tremendous advantage of deep-frozen foods, there have been only few studies on freezing at deep freezing temperatures. Moreover, researches about long-term storage at such deep-freezing temperature have rarely been conducted (Alghazeer et al., 2008; Choi et al., 2018; Utera et al., 2014). Sakata et al. (1995) analyzed the physicochemical properties of porcine M. longissimus dorci frozen at −80°C after 1 month of storage. Mørkøre and Lilleholt (2007) froze and stored Atlantic cod at −55°C and −70°C for only 11 days. Although the foods were frozen at this deep-freezing temperature, the freezing facilities were either industrial or laboratory scale (Indergård et al., 2014; Kim et al., 2013; Utera et al., 2014), or described only freezing temperatures (Alghazeer et al., 2008; Sakata et al., 1995). In this way, consumers have been excluded from the advantage of deep freezing storage due to its economical and feasibility factors (Elansari and Bekhit, 2017; Lisitsyn et al., 2019). Therefore, comprehensive studies on the effects of deep-freezing and long-term storage on meats are needed. In addition, domestic deep freezers were adopted considering customer’s environment.
In this study, pork neck and chicken leg meats were chosen as representative meats because of their considerable public appeal and economic importance. By freezing and storing pork neck and chicken leg meat at conventional freezing (−18°C) and deep-freezing (−50°C and −60°C) temperatures, the effects of deep freezing on meat quality were investigated. The physicochemical properties of these meats affected by these temperatures were analyzed after storage for up to 6 months.
Materials and Methods
Pork necks at 48 h post-mortem were purchased from a local butcher shop. Chicken leg meats (FRESH-UP chicken leg meat, Harim, Iksan, Korea) were purchased at 48 h post-mortem.
Pork necks were prepared to 48 pieces which had thickness of 3 cm (9×9×3 cm, 150 g), and packed in air-containing packages. Chicken leg meats were prepared (10 cm long, 70 g) to 96 pieces and packed in the same manner. After packaging, the samples were placed in deep freezers (A255WD, LG Electronics, Seoul, Korea) that were set at freezing temperatures (−18°C, −50°C, and −60°C), and frozen until the temperature of the center of each sample reached −18°C, −50°C, and −60°C, respectively. After that, frozen samples were stored at such freezing temperatures. For measuring the temperature change during freezing, T-type thermocouples were placed in the center of each sample and the temperatures were recorded by a connected data logger (Data Acquisition-MX 100, Yokogawa, Tokyo, Japan). Thereafter, the samples were stored for 6 months in the deep freezers (A255WD) at each freezing temperature and thawed at 2°C (A255WD) until the core temperature of each sample reached 0°C. The physicochemical properties of the thawed samples were evaluated. The skin of chicken leg meats was stripped after visual appearance was observed.
Fresh samples were weighed before packaging, and thawed samples were weighed after removing exudates using dry tissues. Thawing loss was calculated as the difference in the weights of the fresh sample and thawed sample, and expressed using the following formula:
WHC was measured according to Choi et al. (2018). Thawed samples (1 g each) were wrapped in absorbent cotton and placed in a centrifugal tube (SpinwinTM, Tarsons, Kolkata, India). The tubes with samples were centrifuged in a centrifuge separator (1736R, Labogene, Seoul, Korea) at 3,000×g for 10 min at 4°C, following which the samples were weighed. The WHC of the sample is expressed as the ratio of the sample weight after centrifugation to the initial sample weight, using the following formula:
Cooking loss was measured according to Bai et al. (2017). Samples were vacuum-sealed in plastic bags and heated in a water bath (BF-30SB, BioFree, Seoul, Korea) at 70°C for 30 min. Next, the heated samples were cooled at an ambient temperature for 30 min to remove excess moisture. The weight of the samples was weighed before and after the heat treatment. Cooking loss is expressed as the ratio of weight loss over the initial weight, using the follow formula:
Color parameters of each sample were determined using a colorimeter (CR-400 Chroma Meter, Konica Minolta Sensing Inc., Osaka, Japan). The CIE (Commission Internationale de l’Eclairag) L*, CIE a*, and CIE b* values of the samples were measured after calibrations with a white standard plate (CIE L*=96.79, CIE a*=+0.30, CIE b*=+1.67). Total color difference (ΔE) was calculated using the following equation, based on the differences between fresh and thawed samples (Jo et al., 2000).
TBARS content of each sample was measured using the procedure reported by Witte et al. (1970), with some modification. Five grams of the sample was homogenized with 45 mL distilled water for 60 s using a slap-type homogenizer (WS-400). The homogenate was filtered using Whatman No. 1 filter paper (GE Healthcare Life Science). The filtrate (0.5 mL) was transferred to a test tube, and 4.5 mL of TBA solution (0.25 N HCl, 15% trichloroacetic acid, and 0.375% TBA reagent) was added to this tube. The tube was heated (95°C for 15 min) in a water bath (BF-30SB), cooled at room temperature, and centrifuged at 3,000×g at 4°C for 10 min. Next, 200 μL of supernatant was added into the wells of the 96-well plate (SPL Life Science, Pocheon, Korea), and the absorbance was measured at 535 nm using a spectrophotometer (MultiskanTM GO UV/VIS, Thermo Fisher, Waltham, MA, USA). The TBARS values of the samples are represented as mg malondialdehyde/kg (mg MDA/kg). The TBARS value was calculated using the standard curve and the following formula:
Where a is the optical density for the sample, b is the optical density for the blank.
VBN contents of pork neck and chicken leg meat were determined by Conway’s micro-diffusion method (Conway, 1947). Five grams of sample was homogenized with 45 mL distilled water for 180 s using a slap-type homogenizer (WS-400, Shanghai Zhisun Equipment, Shanghai, China). The homogenate was filtered using Whatman No. 2 filter paper (GE Healthcare Life Science, Sheffield, UK). After filtering, 1 mL of the filtrate was placed into the outer side of the Conway dish, and a mixture of 1 mL of 0.01 N H3BO3 and 100 μL of Conway solution (mixture of 0.066% methyl red in ethanol and 0.066% bromocresol green in ethanol) was placed into the inner side of the Conway dish. Next, 1 mL of 50% K2CO3 was added to the outer side of the Conway dish. After that, the Conway dish was closed and incubated at 37°C for 2 h, and the solution was titrated using 0.02 N H2SO4 solution till the Conway reagent changed to a red color. The VBN contents were determined following the addition of 0.02 N H2SO4 to the inner side of the Conway dish. The VBN value was calculated using the following formula:
Where a is the titration volume for the sample (mL), b is the titration volume for the blank (mL), f is the factor of H2SO4, S is the weight of the sample, and c is the dilution amount.
All statistical analyses were performed with two-way and one-way analyses of variance (ANOVA) using PASW Statistics Ver. 18.0. To assess the interaction effects of the component content change, two-way ANOVA data were analyzed. In cases in which one-way ANOVA revealed significant differences (p<0.05), a post-hoc test was conducted using Duncan’s multiple-range test. All statistical analysis was performed using SPSS software 22.0 (SPSS Inc., Chicago, IL, USA).
Results and Discussion
Fig. 1 shows the freezing temperature-time profiles of pork neck and chicken leg meat during freezing and thawing. The phase transition time was defined as the time required to cross the range from −1°C to −6°C, which is known as the maximal ice crystal-forming zone (Sakata et al., 1995). In the freezing procedure (Fig. 1A, 1C), the phase transition time of pork neck frozen at −60°C and −50°C was about 60 min, whereas that of pork neck frozen at −18°C was longer than 190 min. The phase transition time of chicken leg meat frozen at −60°C and −50°C was about 60 min, whereas that of chicken leg meat frozen at −18°C was about 162 min. Overall, the phase transition time of the pork neck was shorter than that of the chicken leg meat, since the distance to center point of the chicken leg meat was greater than that of pork neck regardless of the freezing rate. The thickness of pork necks was 3 cm, whereas the diameter of flesh parts of chicken leg meat was about 5 cm. The phase transition time during the freezing process is critical to the quality of frozen food because a longer phase transition time results in the generation of larger ice crystals that destroy muscle fibers and deteriorate meat quality (Kaale et al., 2013). Yang et al. (2014) generally defined quick freezing as a phase transition time was shorter than 30 min. Our results showed that the phase transition time of all sample was longer than 30 min, even at different freezing temperatures.
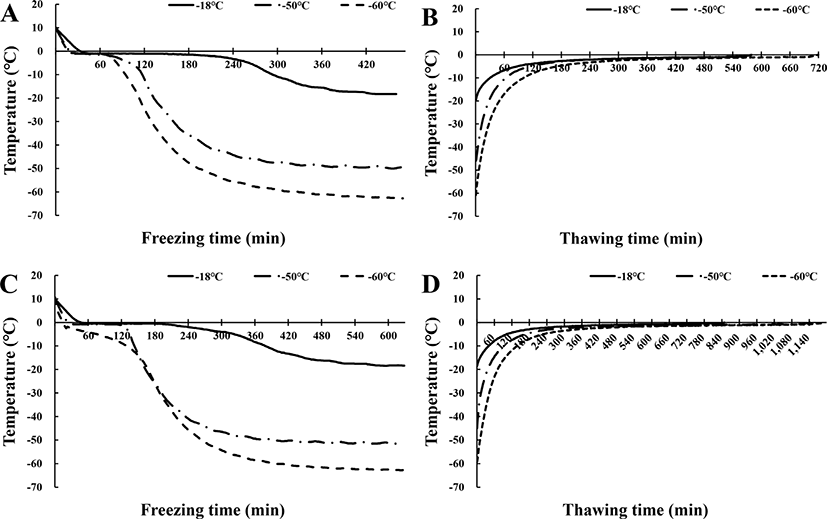
For the thawing procedure (Fig. 1B, 1D), the phase transition time of pork neck frozen at −18°C was 330 min. Furthermore, there was no difference in the phase transition time of pork neck frozen at −50°C and −60°C, which ranged from 300 to 350 min. The phase transition time of chicken leg meat frozen at −18°C was about 700 min, and that of chicken leg meat frozen at −50°C and −60°C was around 900 min. Kim et al. (2015) reported that the freezing method affected thawing time; however, no difference in thawing time with respect to freezing temperature was observed in this study. Choi et al. (2018) found no significant difference in the phase transition time of lamb stored at different temperatures, during thawing, which was consistent with our results.
Table 1 shows the thawing loss of pork neck and chicken leg meat with various freezing temperatures and storage periods. Thawing loss had an increasing trend with storage periods and temperatures. The pork neck frozen at −60°C had the lowest thawing loss, showing no more than 3% after 6 months of storage. In contrast, the thawing loss of pork neck frozen at −18°C increased up to 6.69% during storage. In the same manner with pork neck and chicken leg meat frozen at −60°C had the lowest thawing loss after 6 months of storage. Freezing temperatures of −50°C and −60°C did not result in any differences within all storage periods (p>0.05). The thawing loss of chicken leg meat frozen at −18°C increased up to 12.61% during storage, meaning that deep freezing conferred an advantage on pork neck and chicken leg meat to maintain its thawing loss.
Thawing loss of meat is known to be associated to freezing rate (Anese et al., 2012; Añón and Calvelo, 1980; Hong et al., 2005; Leygonie et al., 2012a). It has been mentioned that high thawing loss could be attributed to the large ice crystals formed during phase transition, thereby causing the rupture of fiber membrane and destruction of muscle tissues (Lambert et al., 2001). Furthermore, the shrinkage of myofibrils during the thawing process may be another reason for thawing loss (Yu et al., 2005). Sakata et al. (1995) also reported that smaller ice crystals were found in M. longissimus dorsi frozen at −80°C compared to those of samples frozen at −20°C. Moreover, Rathod et al. (2017) informed that the damaged cell membranes induced by the destruction of muscle tissues could be attributed to high thawing loss. This damage on the cell membranes can be relieved by reducing the size of ice crystals through increasing freezing rates by deep freezing (Li and Sun, 2002). Kim et al. (2015) and Kim and Hong (2016) reported that the lower freezing and storing temperatures resulted in lower thawing loss in pork, which was consistent with the results of this study. Accordingly, deep-freezing on pork neck and chicken leg meat was recommended to form small ice crystals for protection from destruction of muscle tissues and inducing lower thawing loss.
Table 2 shows the WHC of pork neck and chicken leg meat with various freezing temperatures and storage periods. WHC of fresh pork neck was 88.3% and was correlated with storage periods and temperatures. The WHC of samples frozen at −18°C continually declined to 71.3% after 6 months of storage, whereas those of samples frozen at −50°C and −60°C were 74.0% and 75.9% after 6 months, respectively. In chicken leg meat, the WHC of fresh chicken leg meat was 82.5% and was negatively correlated with storage period. After 6 months, the WHC of chicken leg meat frozen at −18°C was 65.4%, while those of samples frozen at −50°C and −60°C were above 70%. The deep-freezing temperature maintained the WHC in two kinds of meat when compared to storage at −18°C.
a–f Means with different letters within the same storage temperature are significantly different (p<0.05).
Jo et al. (2014) and Kim et al. (2015) found that freezing and thawing procedure lowered the WHC of meat. Miller at al. (1980) reported that the WHC of pork and beef was reduced by damaged muscle tissues during the freezing and thawing procedure. Ngapo et al. (1999) also reported that thawing exudate was able to be easily released from the intracellular space due to the damaged cell membranes. The denatured/damaged muscle fibers lose its capillary forces, which allow for water to be captured (Huff-Lonergan et al., 2002; Savage et al., 1990). These damages on the cell membranes and muscle fibers could be relieved by deep freezing due to the fast freezing rate. In this study, the muscle cell fibers and membranes of pork neck and chicken leg meat were considered to be damaged, thereby resulting in the loss of capillary forces that held the water in muscle cells and thus leading to a decline in WHC. The largest difference was observed after 0.5 months, except for chicken leg meat frozen at −60°C. Overall, pork neck and chicken leg meat were recommended to frozen at −60°C for maintaining the WHC of fresh meat.
Cooking loss of the fresh pork neck was 42.38%, which was drastically decreased by freezing storage duration (Table 3). The cooking loss of samples frozen at −60°C for 6 months was 26.81%, which was the lowest among all samples. However, no trends were observed for storage temperatures with respect to cooking loss of pork neck. Cooking loss of the fresh chicken leg meat was 43.18%, and no significant difference with respect to storage temperatures was observed without those of 3 and 4 months. Meanwhile, cooking loss also decreased with respect to storage periods.
Several studies have reported that water loss while cooking meat was similar between unfrozen and frozen/thawed meat (Leygonie et al., 2012b; Vieira et al., 2009). Regardless of the freezing or thawing process, bound water in meat is chemically released by denatured protein through thermal processes (Vieira et al., 2009). In addition, Dawood (1995) stated that certain losses from its initial weight, such as thawing loss, might result in less cooking loss. Furthermore, Hong et al. (2005) and Mortensen et al. (2006) mentioned that there were incompatible results in cooking loss, and the effect on cooking loss of meat remain unclear. Hong et al. (2005) and Kim et al. (2015) observed that there was no significant difference in cooking loss between unfrozen and frozen/thawed meat. Also, Choi et al. (2018) found a negative correlation with cooking loss of lamb meat within 5 months of freezing storage. In this study, it was supposed that the positive correlation of thawing loss with storage periods might affect the negative correlation with cooking loss according to the research of Dawood (1995).
Tables 4 and 5 show the color and total color differences of thawed pork neck and chicken leg meat with various freezing temperatures and storage periods. The pork necks frozen at −18°C for 6 months had the highest CIE L*, CIE a*, and CIE b* values, indicating that the color was no longer cognate to that of fresh pork neck. Consequently, pork neck frozen at −18°C had the highest total color difference (ΔE) value after 6 months of storage (p<0.05). Deep freezing storage assisted in protecting the color change when compared to the pork neck stored at −18°C. No trend was observed for the color of chicken leg meat. The CIE L*, CIE a*, and CIE b* values fluctuated within certain ranges during the 6 months of storage, regardless of storage periods and temperatures. The ΔE value did not show any significant changes with freezing temperature. The color of frozen chicken leg meat was not significantly influenced by temperature.
a–e Means with different letters within the same storage temperature are significantly different (p<0.05).
Kim et al. (2015) reported that the color parameters of pork did not show any significant differences with respect to various freezing and thawing treatments. Lind et al. (1971) also reported that freezing rates had no significant effect on color. The increase in CIE b* value with freezing storage was observed in frozen pork for 30 months (Hansen et al., 2004), frozen beef for 90 days (Vieira et al., 2009), frozen ostrich for 1 month (Leygonie et al., 2012b), and frozen lamb for 21 months and 52 weeks each (Coombs et al., 2017; Muela et al., 2015). Muela et al. (2015) suggested that the increase in CIE b* is a consequence of denaturation of myoglobin, metmyoglobin amassment, and increase in lipid oxidation during the storage period. Meanwhile, in pork neck frozen at −18°C for 6 months, surface dehydration, or freeze burn was generated, which was induced by the sublimation of water at surface or exposure to dry ambient, resulting a darker or lighter color (Drummond and Sun, 2010). Thus, the CIE L* and CIE b* of pork neck frozen at −18°C for 6 months were significantly higher due to its light brown color caused by surface dehydration. With these results, the storage at deep-freezing temperatures such as −60°C might confer protection from color changes by preventing the oxidation of pigments and lipids in meat.
Fig. 2A and 2B show the visual appearance of the thawed pork neck and chicken leg meat at various freezing temperatures and storage periods. Fresh pork neck had a clear red color. After 6 months of storage, the pork neck frozen at −18°C had light brown color with a dried and shrunk surface due to surface dehydration. Meanwhile, samples frozen at −50°C and −60°C were considered to maintain its quality when compared to pork neck frozen at −18°C. In contrast to pork neck, there were no noticeable features on the appearance of chicken leg meat regardless of storage periods and temperatures. It was assumed that the skin on the flesh of chicken leg meat helped retain its color.
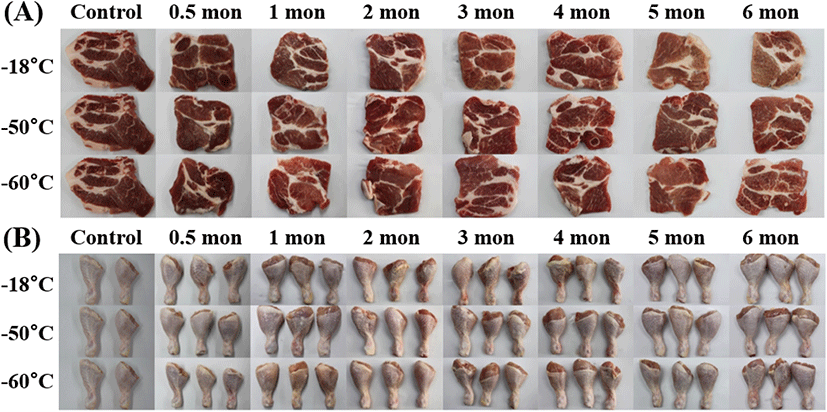
In this study, pigment oxidation and dehydration were generated in the pork neck frozen at −18°C with 6 months of storage, showing the highest ΔE value of about 12. It might be attributed to the denaturation of myoglobin and dehydration, though lipid oxidation might not have affected the color considering the TBARS value (Table 6). Thus, it was thought that the storage at deep freezing temperature of pork neck was indispensable for maintaining its fresh color and appearance.
a–c Means with different letters within the same storage temperature are significantly different (p<0.05).
The TBARS value of fresh pork neck was 0.289 mg MDA/kg, and those of all samples ranged of 0.216–0.298 mg MDA/kg (Table 6). Equally, the TBARS values of chicken leg meat were below 0.30 mg MDA/kg regardless of freezing temperature and storage periods.
It is recognized that lipid oxidation is generated in frozen meat (Ramsbottom, 1947). Miller et al. (1980) reported that the TBARS value of boneless pork shoulder was below 0.2 mg MDA/kg after 37 weeks of freezing storage. Medić et al. (2018) also found that the TBARS values of pork ham, loin, and belly rib stored at −18°C were maintained below 0.18 mg MDA/kg for 6 months. One possible explanation about steady low content of TBARS in both meats is the aldehyde reactions with other compounds that are present, producing products that do not react with thiobarbituric acid (De las Heras et al., 2003). Another possible explanation could be that the TBARS values had a typical “induction-propagation-termination” cycle, thereby resulting in an oscillating pattern (Barnett et al., 1991). In this study, the TBA values of all samples did not exceeded 1.0 mg MDA/kg, which is the threshold to indicate unfavorable rancid odor and flavor of meat products (Kolsarıcı et al., 2010).
In the case of chicken legs, the lower TBARS value tended to decrease as the freezing rate increased in 4 months of storage at −18°C, but the difference was not significant. Soyer et al. (2010) reported that TBARS values increased when stored at −7°C to −18°C for 6 months. In this study, oxidative stability of lipids in pork neck and chicken leg meat during freezing storage for 6 months was observed.
Table 7 shows the VBN of pork neck and chicken leg meat with various freezing temperatures and storage periods. The VBN of pork neck showed a similar trend as the thawing loss results, which gradationally increased with respect to storage periods and temperatures. After 6 months of storage, the VBN of sample frozen at −18°C was 9.00 mg/100 g, showing the highest amount of protein deterioration. Meanwhile, that of samples frozen at −60°C was 6.54 mg/100 g. The VBN of chicken leg meat increased after freezing. Unlike that of pork neck, the VBN of chicken leg meat fluctuated until 5 months of storage. After 6 months of storage, the VBN of chicken leg meat frozen at −18°C had the highest value of 8.10 mg/100 g (p<0.05), in contrast with that of samples frozen at −60°C, which showed a VBN of 6.10 mg/100 g.
a–e Means with different letters within the same storage temperature are significantly different (p<0.05).
Proteins in meat decomposed to NH3-related compounds such as ammonia, amines, and alkaline nitrogenous materials, which are assessed as the VBN content, by enzymatic reactions and bacteria proteolytic activity (He et al., 2013; Kim et al., 1998; Kim et al., 2004; Lee and Jang, 2013). Kim et al. (1998) stated that VBN generation in frozen pork was due to the disintegration of ATP by ATPase. For that reason, the VBN level is considered as a crucial criterion of meat freshness (He et al., 2013; Hoffman, 1988; Kim et al., 2014; Kuo et al., 2005; Tak et al., 2005). Furthermore, these reactions associated with raising VBN values could be suppressed by storage at deep freezing temperatures, which provide the right conditions for the chemical reactions to occur, due to the lack of water molecules (Estévez, 2011). Furthermore, Tolstorebrov et al. (2016) emphasized that proteins in fish were stabilized at such extremely low temperatures. Additionally, the absolute stabilization of protein could be observed below the glass transition temperature, which varies depending on the type of fish, generally below −70°C. In the same manner, it is indisputable that deep freezing is important to stabilize proteins of meats during freezing storage. Meanwhile, He et al. (2013) described the consistency between VBN value and the growth trend of microbes in thawed pork. Lee and Jang (2013) also observed that VBN values of pork at 5°C of storage during 19 days were positively correlated with the number of Pseudomonasspp. counts. Nevertheless, microbial spoilage in foods is known to be ceased during freezing and freezing storage due to the microbes turn to dormant phase at such lower temperatures (Leygonie et al., 2012a). In this way, microbial proteolytic activity might not be generated in this study. Jin et al. (2002) and Kim et al. (1998) reported that the VBN of pork increased with freeze-storage. These results show that the VBN value of meat in previous studies increased with increasing storage periods and temperatures. Therefore, storing pork neck and chicken leg meat at deep freezing temperatures, especially −60°C, is necessary to prevent protein deterioration.
Table 8 shows the F-values of pork neck and chicken leg meat for the methods of storage periods and storage temperatures. In the pork neck, all property except the L* value was significantly different (p<0.001). Thawing loss and WHC were mainly affected by storage periods. Storage temperature was also a critical factor that affected the pork neck quality. Water binding properties (thawing loss, WHC, and cooking loss), b*, ΔE, and VBN values were influenced by temperature. TBARS was not significantly different by temperature. In the chicken leg meat, all property was influenced by storage periods. Water binding properties, VBN, and TBARS had marked differences by storage periods (p<0.001). Meanwhile, cooking loss and the color of chicken leg meat were not influenced by storage temperature (p>0.05). However, temperature was an important factor for chicken leg meat when considering the effects on VBN and TBARS. Consequently, storage period was a primary factor that affected the properties of pork neck and chicken leg meat in case of freezing storage. In the same manner, storage temperature also influenced the quality of pork neck and chicken leg meat in this study. Therefore, deep freezing is indispensable in freezing storage to maintain the quality of meat.
Conclusions
In this study, the physicochemical properties of pork neck and chicken leg meat under various freezing temperatures and storage periods were evaluated. Overall, −60°C was effective to maintain the fresh meat quality for pork neck and chicken leg meat. Thawing loss of pork neck and chicken leg meat samples increased with storage periods; the thawing loss of samples frozen at −60°C was the lowest. Samples frozen at −18°C had the lowest WHC under all storage periods. Cooking loss was negatively correlated with storage period for the two types of meat. Samples frozen at −18°C had the highest color parameters and VBN content for 6 months of storage. The TBARS values of samples were maintained for 6 months of storage. Therefore, storing pork neck and chicken leg meat at deep freezing (−60°C) temperature could be a desirable method to retain the original quality of meat for 6 months.