ARTICLE

Differentiation between Normal and White Striped Turkey Breasts by Visible/Near Infrared Spectroscopy and Multivariate Data Analysis

Amal Zaid1https://orcid.org/0000-0003-1228-6491, Nawaf Abu-Khalaf1https://orcid.org/0000-0002-0007-710X, Samer Mudalal2,*https://orcid.org/0000-0002-6356-6891, Massimiliano Petracci3http://orcid.org/0000-0002-5671-5676
Author Information & Copyright
1College of Agricultural Sciences and Technology, Palestine Technical University-Kadoorie (PTUK), Tulkarm B.O.Box 7, Palestine
2Department of Nutrition and Food Technology, Faculty of Agriculture and Veterinary Medicine, An-Najah National University, P.O. Box 7, Nablus, Palestine
3Department of Agricultural and Food Sciences, Alma Mater Studiorum, University of Bologna, 47521 Cesena (FC), Italy
*Corresponding author : Samer Mudalal, Department of Nutrition and Food Technology, Faculty of Agriculture and Veterinary Medicine, An-Najah National University, P.O. Box 7, Nablus, Palestine, Tel: +970-9-2345113, Fax: +970-9-2345982, E-mail: samer.mudalal@najah.edu

© Korean Society for Food Science of Animal Resources. This is an Open-Access article distributed under the terms of the Creative Commons Attribution Non-Commercial License (http://creativecommons.org/licenses/by-nc/3.0) which permits unrestricted non-commercial use, distribution, and reproduction in any medium, provided the original work is properly cited.

Received: Aug 05, 2019 ; Revised: Nov 04, 2019 ; Accepted: Nov 18, 2019

Published Online: Jan 01, 2020

Abstract

The appearance of white striations over breast meat is an emerging and growing problem. The main purpose of this study was to employ the reflectance of visible-near infrared (VIS/NIR) spectroscopy to differentiate between normal and white striped turkey breasts. Accordingly, 34 turkey breast fillets were selected representing a different level of white striping (WS) defects (normal, moderate and severe). The findings of VIS/NIR were analyzed by principal component (PC1) analysis (PCA). It was found that the first PC1 for VIS, NIR and VIS/NIR region explained 98%, 97%, and 96% of the total variation, respectively. PCA showed high performance to differentiate normal meat from abnormal meat (moderate and severe WS). In conclusion, the results of this research showed that VIS/NIR spectroscopy was satisfactory to differentiate normal from severe WS turkey fillets by using several quality traits.

Keywords: VIS/NIR spectroscopy; white striping; quality; PCA

Introduction

In the last few decades, tremendous improvements have been achieved in growth rate and breast yield of poultry birds, to meet the growing demand for poultry meat (Mudalal et al., 2015). Globally, the productivity of poultry meat has been enhanced by intentional genetic selection using traditional quantitative techniques (Zuidhof et al., 2014). The genetic selection was companied by histological and biochemical modifications in the muscular tissues of growing birds (Petracci and Cavani, 2012). It was found that genetically selected birds had low blood capillary vessels’ density which led to some disorders metabolism (Soglia et al., 2018a). Accordingly, this was companied by emergence of several muscle abnormalities such as Pale Soft exudative (PSE) (Petracci et al., 2017), Deep pectoralis myopathy (DPM). Recently, new muscle abnormalities have been observed such as white striping (WS) and hardening of the breast muscle known as ‘wooden breast’ (Kuttappan et al., 2017). Moreover, intramuscular connective tissue defects characterized by a loose structure of muscle fiber bundles called ‘spaghetti meat’, has been recently observed (Baldi et al., 2018; Maiorano, 2017). The previous poultry meat defects were attributed due to a consequence of substantial improvement towards increasing growth rate and breast yield (Petracci et al., 2015).

All previously mentioned defects in turkey and chicken meat (in particular breast meat) are considered as a serious problems to poultry industries because they affected adversely the quality traits of premium cuts (Soglia et al., 2018b). These defects impaired visual appearance as well as reduced technological properties such as water holding capacity, texture, and color. Accordingly, this was negatively reflected on consumer acceptance (Kuttappan et al., 2017). The classification systems for affected meat by muscle abnormalities are still based on aesthetic criteria (variations in the color of the meat, whether the meat is too pale or too red, and/or excessive fluid accumulation), couldn’t make an exact judgment to deal with meat quality issues (Barbut, 2009). The affected meat should be culled out from the processing line and transformed them for further processed meat (such as nuggets and sausages) while the rest of the carcass is suitable for human consumption (Brambila et al., 2017).

Differences in meat composition due to increase muscle abnormalities have imposed more pressure on the meat industries to guarantee good meat quality. Concerning production and meat evaluation, there is a need to look for rapid, non-destructive and non-expensive techniques.

Over the last years, the use of near-infrared spectroscopy (NIRS) as instrumental technique with spectrum wavelength (800–2,500 nm) has increased enormously. Near-infrared spectroscopy (NIR) has the ability to estimate and predict different quality traits in food products by measuring the amount of NIR radiation that is reflected, absorbed, transmitted, and/ or scattered at different wavelengths (Gardner, 2018).

NIR spectroscopy technique was employed to evaluate the chemical composition of meat and meat products (Van Kempen, 2001). It has unique advantages if compared with classical methods such as quick and frequent measurements, and the ease of sample preparation. Moreover, it is fit for on-line applications in the agriculture field (Abu-Khalaf, 2015; Beghi et al., 2018), pharmaceutical industries (Guillemain et al., 2017), as well as medical sectors (Monteyne et al., 2018) to assess different quality traits. On another hand, NIRS has still some limitations where there is a necessity for reference method, low sensitivity to minor constituents, as well as complexity in the calibration (Buning-Pfaue, 2003).

The ability of NIRS to predict several quality traits of meat such as chemical composition (protein, moisture, fat, and collagen), pH, water holding capacity, etc have been investigated (Brondum et al., 2000; Meulemans et al., 2002; Moran et al., 2018; Yang et al., 2018). Moreover, it was found that there was a possibility to classify meat based on feeding regimes (Cozzolino et al., 2002), strains (McDevitt et al., 2005), and tenderness (Yancey et al., 2010) by using NIR spectroscopy.

There are no available studies that used visible-near infrared (VIS/NIR) spectroscopy to predict the quality traits of turkey breast meat affected by different levels of WS. Therefore, the main objective of this research is to employ VIS/NIR spectroscopy to differentiate different levels of WS defects.

Materials and Methods

Samples selection and preparation

From a local Palestinian slaughterhouse near Tulkarm city (Palestine), more than 60 the pectoralis major muscles of 20-wk old tom turkey birds were randomly selected based on the appearance of white striations. The evaluation of the presence of WS was performed on the processing line at 1–2 h of post-mortem after the breast- deboning area. Out 60 pectoralis major muscles, 34 muscles were classified into three groups: normal (12 samples) (free of white striations), moderate (12 samples) (when white striations thickness <1 mm), and severe (10 samples) (when white striations thickness >1 mm) (Soglia et al., 2018b). Samples were subjectively pre-classified into categories, packed on ice, and transported to Palestine Technical University-Kadoori laboratory for VIS/NIR measurements then to An-Najah National University laboratories for other quality traits analysis. The pectoralis major muscles were excised from the whole breast muscle. Excessive fat, connective tissue, cartilage, and bone fragments were avoided to minimize sampling errors.

VIS/NIR spectroscopy measurements

In each turkey breast meat sample (n=34), three spectra were collected (at a room with a temperature of 23±2ºC and relative humidity of 60%) directly on the skin side, radial section, and tangential section. A USB2000+ miniature fiber optic spectrometer (Ocean Optics, Largo, FL, USA) with a vivo light source and 50 μm fiber optics probe was used for spectra acquisition. The spectra were obtained at scans with a resolution of 0.35 nm full width at half maximum (FWHM), and spectra range 550–1,100 nm. It also has a 2048-element CCD-array detector, 2-MHz analog-to-digital (A/D) converter, in addition to a high-speed USB 2.0 port. The USB2000+ can be controlled by Spectra Suite software. This device is equipped with an active fan cooling to overcome the risk of sample overheating. The 4 halogen tungsten light sources make the vivo a high-powered VIS/NIR source, which allows a shorter integration time than conventional methods (Ocean Optics). The integration time used in this investigation was 1,340 μs. A total of 102 spectra were obtained for turkey samples, and then the average spectra were taken. The VIS/NIR analyses were performed in the diffuse reflectance mode and then recorded as absorbance (log 1/R). To ensure the stability of the measurements, a diffuse reflectance standard WS-1 (Ocean Optics) was used as the optical reference standard for the system every 5 minutes during the experiment. The dark reference was done once at the beginning of each experiment, by closing the entrance of incoming light from probe to the USB2000+ miniature fiber optic spectroscopy using a plastic cap. At the end of all spectral measurements, the acquired data were well stored for later analysis. The 34 samples were used for building PLS calibration models using their VIS/NIR spectra.

Statistical analysis

The Unscrambler program (version 9.7, CAMO Software AS, Oslo, Norway) was used for both principal component analysis (PCA) and PLS multivariate data analysis (Abu-Khalaf, 2015). In PCA, VIS/NIR spectra represented a bilinear model of the data matrix X. PCs represent in a pattern of observations in plots.

To investigate the possible differences in three types of turkey breast meat (normal, moderate and severe) at three ranges, i.e. VIS (550–700 nm), NIR (700–1,100 nm) and VIS/NIR (550–1,100 nm) wavelengths, a PCA model was carried out.

Results and Discussion

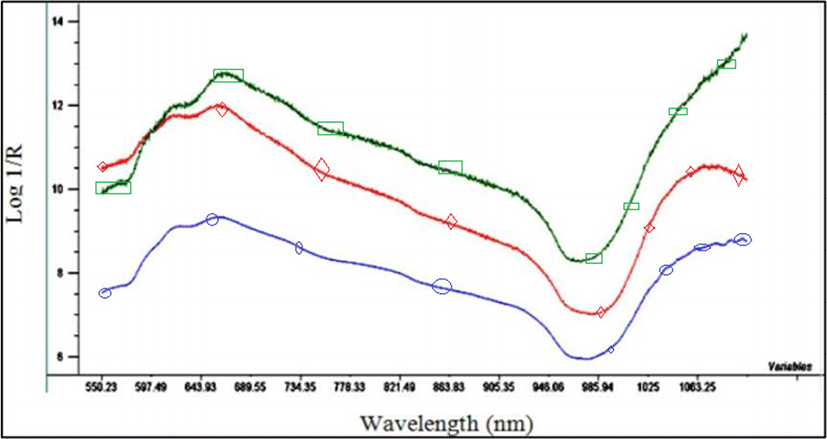
Typical mean spectral curves representing the three levels of WS fillets in the wavelength range 550–1,100 nm are shown in Fig. 1. The depressions and peaks in spectra showed the strong and weak absorbance characteristics of the samples, within the range of study. The spectra of normal, moderate (WS) and severe (WS) breast fillets showed similar absorption bands, which were in agreement with previous studies (Barbut, 1996; Fumiere et al., 2000).
kosfa-40-1-96-g1
Fig. 1. A typical VIS/NIR (500–1,100 nm) spectral curve obtained from turkey fillets. Normal fillets (◊, red), moderate WS fillets (○, blue) and severe WS (□, green) fillets, without pre-processing. VIS/NIR, visible-near infrared/near-infrared spectroscopy; WS, white striping.
Download Original Figure

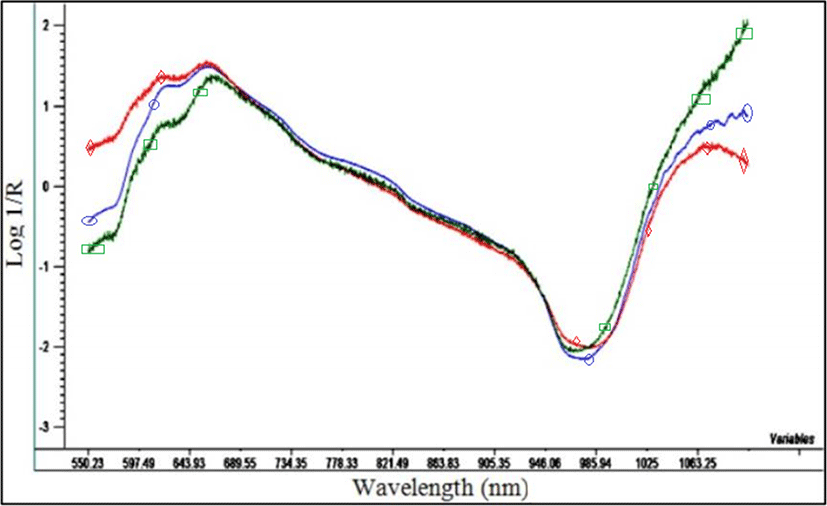
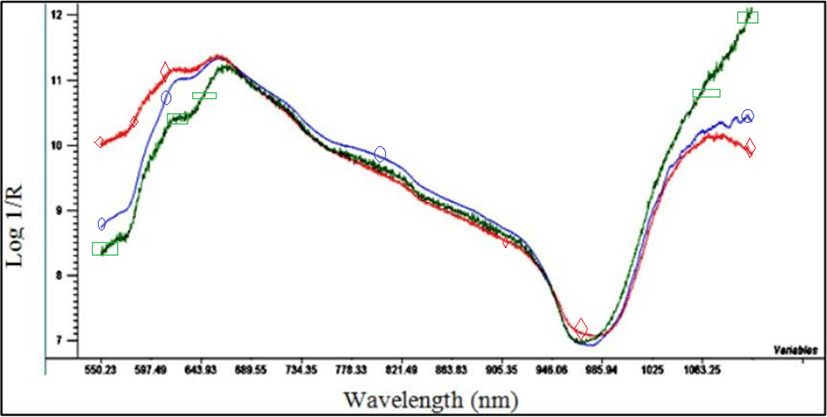
NIR spectra often contain undesired scattering variation due to heterogeneous content and sample surface amongst others. The scattering effect in NIR consists of a multiplicative effect and an additive effect. The additive effect is reflected as the baseline offset. The multiplicative effect is reflected as a slope that scales the entire spectrum. Data pre-treatment was employed to minimize these complex baseline variations and scattering effects. NIR spectra of the samples set were pre-processed using standard normal variate (SNV) to delete slope variation and to correct for scattering effects (Fig. 2). Light scattering in fresh meat samples does not always travel the same distance before it is detected. As a longer light traveling path corresponds to a lower relative reflectance value while more light is absorbed (Jens et al., 2019). This causes a parallel translation of the spectra. For that reason, multiplicative scatter correction (MSC) was used to eliminate these effects (Li and He, 2006) (Fig. 3). Savitzky-Golay first derivatives (1st D) was done to delete baseline flung in meat spectral data and small spectral differences were strengthened, this followed by Savitzky-Golay smoothing (Cunha et al., 2010) to prevent increasing the noise, which came from the derivative (Fig. 4; Li and He, 2006). The relative values of spectra may vary from sample to sample, which might be due to changes in surface texture and moisture content of three types of fillets (Mudalal, 2019; Soglia et al., 2018a; Soglia et al., 2018b).
kosfa-40-1-96-g2
Fig. 2. The effect of Standard Normal Variate (SNV) preprocessing on the spectra obtained from turkey fillets. Normal fillets (◊, red), moderate WS fillets (○, blue) and severe WS (□, green) fillets. WS, white striping.
Download Original Figure
kosfa-40-1-96-g3
Fig. 3. Effect of Multiplicative Scatter Correction (MSC) preprocessing on the spectra that obtained from turkey fillets. Normal fillets (◊, red), moderate WS fillets (○, blue) and severe WS (□, green) fillets. WS, white striping.
Download Original Figure
kosfa-40-1-96-g4
Fig. 4. The effect of the first derivative and smoothing preprocessing on the spectra obtained from turkey fillets with different absorption bands. Normal fillets (◊, red), moderate WS fillets (○, blue) and severe WS (□, green) fillets. WS, white striping.
Download Original Figure

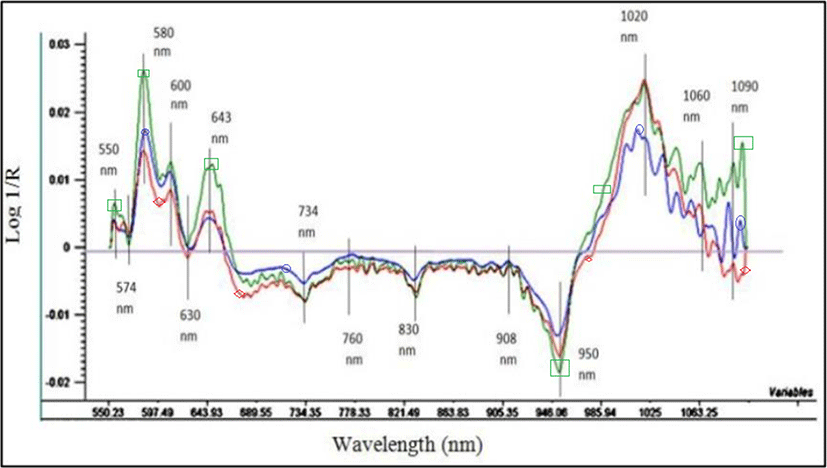
Six bands (peaks at 550, 574, 580, 600, 630, and 643 nm) in the visible region (550–700 nm) and eight bands in the NIR region have been observed (Fig. 4). Several researchers found similar bands and spectral features (Andres et al., 2008; Barlocco et al., 2006; De Marchi et al., 2012). Absorption bands at 550 to 580 nm were associated to the Soret band attributed to the traces of erythrocytes of myoglobin with both haemoglobin and oxyhaemoglobin absorption as well as to oxymyoglobin (Liu and Chen, 2000).

Our findings showed that severe and moderate WS fillets had higher absorption at 550, 574, and 580 nm than normal fillets. This result may be attributed due to discoloration over the surface of white striped fillets (Ellekjaer and Isaksson, 1992). The mean spectrum in the NIR region has absorption bands at 980 nm and it could be related to the second overtone of the OH- vibrational mode of water (Bowker et al., 2014). The absorption at 760 and 908 nm corresponds to the deoxhaemoglobin (Hollo et al., 1987) and the third overtones of C-H bonds, respectively. The identified band at 552 nm related to myoglobin (Cozzolino et al., 1996). Absorption band at 574 nm was associated with oxyhemoglobin (Mitsumoto et al., 1991). The absorption bands at 540 and 580 nm were associated with both myoglobin and oxymyoglobin, respectively (Cozzolino and Murray, 2004).

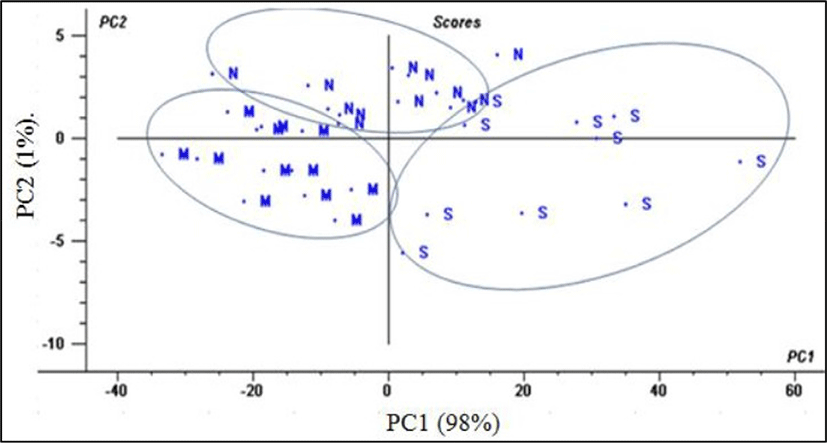
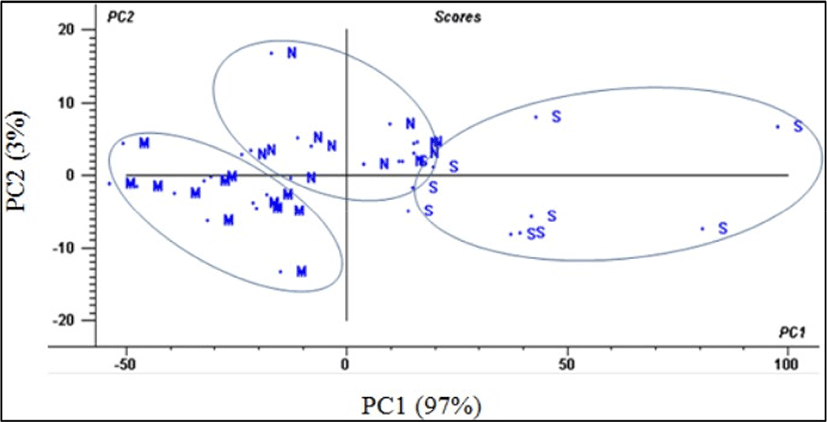
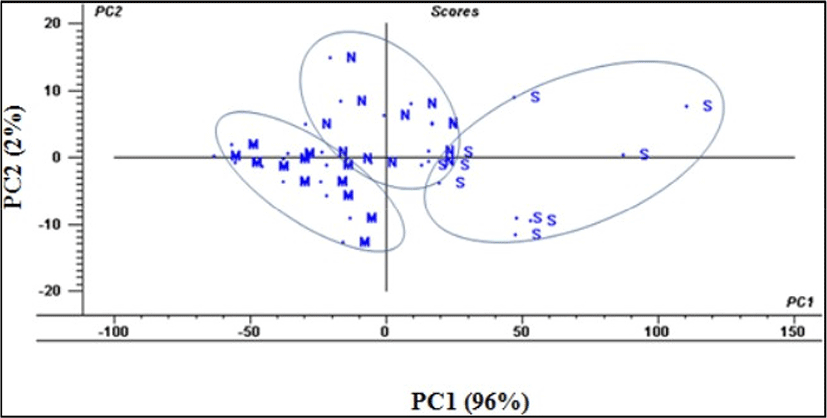
PCA has been carried for VIS/NIR regions spectrum considering the three levels of muscle abnormalities (normal, moderate and severe). PCA showed an ability to distinguish the three groups (normal, moderate WS and severe WS) from each other (Figs. 57).

kosfa-40-1-96-g5
Fig. 5. Score plot of PCA model based on VIS (550–700 nm) spectra of turkey fillets. Normal fillets (N), moderate WS fillets (M) and severe WS (S) fillets. Two PCs explained 99% of the data variation. PCA, principal component analysis; VIS, visible-near infrared; WS, white striping; PC, principal component.
Download Original Figure
kosfa-40-1-96-g6
Fig. 6. Score plot of PCA model based on NIR (700–1,100 nm) spectra of turkey fillets. Normal fillets (N), moderate WS fillets (M) and severe WS (S) fillets. Two PCs explained 100% of the data variation. PCA, principal component analysis; NIR, Near-infrared spectroscopy; WS, white striping; PC, principal component.
Download Original Figure
kosfa-40-1-96-g7
Fig. 7. Score plot of PCA model based on VIS/NIR (550–1,100 nm) spectra of turkey fillets. Normal fillets (N), moderate WS fillets (M) and severe WS (S) fillets. Two PCs explained 98% of the data variation. PCA, principal component analysis; VIS/NIR, visible-near infrared/ near-infrared spectroscopy; WS, white striping; PC, principal component.
Download Original Figure

In this analysis, 2PCs for VIS, NIR and VIS/NIR region explained 99%, 100%, and 98% of the variance, respectively. Our findings showed that PCA had high performance in separating normal turkey breast meat from abnormal meat (moderate and severe). These results were in agreement with previous studies where VIS/NIR spectroscopy with PCA was used to separate poultry and meat products into different categories (Wold et al., 2017).

In conclusion, VIS/NIR spectroscopy is considered a quick, safe and nondestructive technique which is very suitable for online control for meat defects. The findings of this study showed that VIS/NIR spectroscopy was satisfactory to differentiate normal from severe WS turkey fillets. Moreover, the results open a wide door for using a portable VIS/NIR technique in the turkey industry. Further studies with a high number for samples are recommended to confirm the ability of VIS/NIR combined MVDA techniques to differentiate normal turkey breast meat samples from defect WS.

Notes

Conflicts of Interest

The authors declare that there is no conflict of interest regarding the publication of this paper.

Acknowledgments

This work has been financed from the Deanship of Scientific Research at An-Najah National University under project number ANNU-MoHE-1819-Sc012. And also it partially financed by Dutch Nuffic through NICHE-PAA-233 project. We would like to thank Palestine Technical University-Kadoorie (PTUK) to fund the research through the master program of Agricultural Biotechnology.

Notes

Author Contributions

Conceptualization: Abu-Khalaf N, Mudalal S, Petracci M. Data curation: Zaid A, Abu-Khalaf N. Formal analysis: Zaid A, Abu-Khalaf N. Methodology: Zaid A, Abu-Khalaf N, Mudalal S. Investigation: Zaid A, Abu-Khalaf N, Mudalal S. Writing - original draft: Zaid A, Abu-Khalaf N, Mudalal S, Petracci M. Writing - review & editing: Zaid A, Abu-Khalaf N, Mudalal S, Petracci M.

Notes

Ethics Approval

This article does not require IRB/IACUC approval because there are no human and animal participants.

References

1.

Abu-Khalaf N. 2015; Sensing tomato’s pathogen using Visible/Near Infrared (VIS/NIR) spectroscopy and multivariate data analysis (MVDA). Palest Tech Univ Res J. 3:12-22.

2.

Andres S, Silva A, Soares-Pereira AL, Martins C, Bruno-Soares AM, Murray I. 2008; The use of visible and near infrared reflectance spectroscopy to predict beef M. longissimusthoracis et lumborum quality attributes. Meat Sci. 78:217-224

3.

Baldi G, Soglia F, Mazzoni M, Sirri F, Canonico L, Babini E, Laghi L, Cavani C, Petracci M. 2018; Implications of white striping and spaghetti meat abnormalities on meat quality and histological features in broilers. Animal. 12:164-173

4.

Barbut S. 1996; Estimates and detection of the PSE problem in young turkey breast meat. Can J Anim Sci. 76:455-457

5.

Barbut S. 2009; Pale, soft, and exudative poultry meat: Reviewing ways to manage at the processing plant. Poult Sci. 88:1506-1512

6.

Barlocco N, Vadell A, Ballesteros F, Galietta G, Cozzolino D. 2006; Predicting intramuscular fat, moisture and Warner-Bratzler shear force in pork muscle using near infrared reflectance spectroscopy. Anim Sci. 82:111-116

7.

Beghi R, Giovenzana V, Tugnolo A, Guidetti R. 2018; Application of visible/near infrared spectroscopy to quality control of fresh fruits and vegetables in large-scale mass distribution channels: A preliminary test on carrots and tomatoes. J Sci Food Agric. 98:2729-2734

8.

Bowker B, Hawkins S, Zhuang H. 2014; Measurement of water-holding capacity in raw and freeze-dried broiler breast meat with visible and near-infrared spectroscopy. Poult Sci. 93:1834-1841

9.

Brambila GS, Chatterjee D, Bowker B, Zhuang H. 2017; Descriptive texture analyses of cooked patties made of chicken breast with the woody breast condition. Poult Sci. 96:3489-3494

10.

Brondum J, Munck L, Henckel P, Karlsson A, Tornberg E, Engelsen SB. 2000; Prediction of water-holding capacity and composition of porcine meat by comparative spectroscopy. Meat Sci. 55:177-185

11.

Buning-Pfaue H. 2003; Analysis of water in food by near infrared spectroscopy. Food Chem. 82:107-115

12.

Cozzolino D, Martins V, Murray I. 2002; Visible and near infrared spectroscopy of beef longissimus dorsi muscle as a means of dicriminating between pasture and corn silage feeding regimes. J Near Infrared Spectrosc.10:187-193

13.

Cozzolino D, Murray I. 2004; Identification of animal meat muscles by visible and near infrared reflectance spectroscopy. LWT-Food Sci Technol. 37:447-452

14.

Cozzolino D, Murray I, Paterson R, Scaife JR. 1996; Visible and near infrared reflectance spectroscopy for the determination of moisture, fat and protein in chicken breast and thigh muscle. J. Near Infrared Spectrosc. 4:213-223

15.

Cunha WG, Tinoco MLP, Pancoti HL, Ribeiro RE, Aragao FJL. 2010; High resistance to Sclerotinia sclerotiorum in transgenic soybean plants transformed to express an oxalate decarboxylase gene. Plant Pathol. 59:654-660

16.

De Marchi M, Riovanto R, Penasa M, Cassandro M. 2012; At-line prediction of fatty acid profile in chicken breast using near infrared reflectance spectroscopy. Meat Sci. 90:653-657

17.

Ellekjaer MR, Isaksson T. 1992; Assessment of maximum cooking temperatures in previously heat treated beef. Part 1: Near infrared spectroscopy. J Sci Food Agric. 59:335-343

18.

Fumiere O, Sinnaeve G, Dardenne P. 2000; Attempted authentication of cut pieces of chicken meat from certified production using near infrared spectroscopy. J Near Infrared Spectrosc. 8:27-34

19.

Gardner CM. 2018; Transmission versus reflectance spectroscopy for quantitation. J Biomed Opt. :23-018001

20.

Guillemain A, Degardin K, Roggo Y. 2017; Performance of NIR handheld spectrometers for the detection of counterfeit tablets. Talanta. 165:632-640

21.

Hollo J, Kaffka KJ, Gonczy JL. 1987 Near infrared diffuse reflectance/transmittance spectroscopy: Proceedings of the International NIR/NIT Conference. Akademiai Kiado. Budapest, Hungary:

22.

Jens PW, Ingrid M, Atle L, Karen WS, Ragni O. 2019; Near-infrared spectroscopy detects woody breast syndrome in chicken fillets by the markers protein content and degree of water binding. Poult Sci. 98:480-490

23.

Jolliffe I. 2011; Principal component analysis. In International encyclopedia of statistical science. In: Lovric M, editor.(ed)Springer. Berlin, German: pp p. 1094-1096

24.

Kuttappan VA, Owens CM, Coon C, Hargis BM, Vazquez-Anon M. 2017; Incidence of broiler breast myopathies at 2 different ages and its impact on selected raw meat quality parameters. Poult Sci. 96:3005-3009

25.

Li X, He Y. 2006; Non-destructive measurement of acidity of Chinese bayberry using Vis/NIRS techniques. Eur Food Res Technol. 223:731-736

26.

Liu Y, Chen YR. 2000; Two-dimensional correlation spectroscopy study of visible and near-infrared spectral variations of chicken meats in cold storage. Appl Spectrosc. 54:1458-1470

27.

Maiorano G. 2017; Meat defects and emergent muscle myopathies in broiler chickens: Implications for the modern poultry industry. Sci Ann Pol Soc Anim Prod. 13:43-51

28.

McDevitt RM, Gavin AJ, Andres S, Murray I. 2005; The ability of visible and near infrared reflectance spectroscopy to predict the chemical composition of ground chicken carcasses and to discriminate between carcasses from different genotypes. J Near Infrared Spectrosc. 13:109-117

29.

Meulemans A, Dotreppe O, Leroy B, Istasse L, Clinquart A. 2002; Prediction of organoleptic and technological characteristics of pork meat by near infrared spectroscopy. Viandes & Produits Carnes-Hors Serie 9emes Journees Sciences du Muscle et Technologies des Viandes. Clermond-Ferrand, France: pp p. 241-242.

30.

Mitsumoto M, Maeda S, Mitsuhashi T, Ozawa S. 1991; Near-infrared spectroscopy determination of physical and chemical characteristics in beef cuts. J Food Sci. 56:1493-1496

31.

Monteyne T, Coopman R, Kishabongo AS, Himpe J, Lapauw B, Shadid S, Van Aken EH, Berenson D, Speeckaert MM, De Beer T, Delanghe JR. 2018; Analysis of protein glycation in human fingernail clippings with near-infrared (NIR) spectroscopy as an alternative technique for the diagnosis of diabetes mellitus. Clin Chem Lab Med. 56:1551-1558

32.

Moran L, Andres S, Allen P, Moloney AP. 2018; Visible and near infrared spectroscopy as an authentication tool: Preliminary investigation of the prediction of the ageing time of beef steaks. Meat Sci. 142:52-58

33.

Mudalal S, Lorenzi M, Soglia F, Cavani C, Petracci M. 2015; Implications of white striping and wooden breast abnormalities on quality traits of raw and marinated chicken meat. Animal. 9:728-734

34.

Mudalal S. 2019; Incidence of white striping and its effect on the quality traits of raw and processed turkey breast meat. Food Sci Anim Resour. 39:410-417

35.

Petracci M, Cavani C. 2012; Muscle growth and poultry meat quality issues. Nutrients. 4:1-12

36.

Petracci M, Mudalal S, Soglia F, Cavani C. 2015; Meat quality in fast-growing broiler chickens. Worlds Poult Sci J. 71:363-374

37.

Petracci M, Soglia F, Berri C. 2017; Muscle metabolism and meat quality abnormalities. In Poultry quality evaluation. In: Petracci M, Berri C, editors.(ed)Woodhead. Cambridge, UK: pp p. 51-75

38.

Soglia F, Mazzoni M, Petracci M. 2018a; Spotlight on avian pathology: Current growth-related breast meat abnormalities in broilers. Avian Pathol. 48:1-3

39.

Soglia F, Baldi G, Laghi L, Mudalal S, Cavani C, Petracci M. 2018b; Effect of white striping on turkey breast meat quality. Animal. 12:2198-2204

40.

Van Kempen T. 2001; Infrared technology in animal production. Worlds Poult Sci J. 57:29-48

41.

Wold JP, Veiseth-Kent E, Host V, Lovland A. 2017; Rapid on-line detection and grading of wooden breast myopathy in chicken fillets by near-infrared spectroscopy. PLOS ONE. :12-e0173384

42.

Yancey JWS, Apple JK, Meullenet JF, Sawyer JT. 2010; Consumer responses for tenderness and overall impression can be predicted by visible and near-infrared spectroscopy, Meullenet-Owens razor shear, and Warner-Bratzler shear force. Meat Sci. 85:487-492

43.

Yang Y, Zhuang H, Yoon SC, Wang W, Jiang H, Jia B. 2018; Rapid classification of intact chicken breast fillets by predicting principal component score of quality traits with visible/near-infrared spectroscopy. Food Chem. 244:184-189

44.

Zuidhof MJ, Schneider BL, Carney VL, Korver DR, Robinson FE. 2014; Growth, efficiency, and yield of commercial broilers from 1957, 1978, and 2005. Poult Sci. 93:2970-2982