


Introduction
The flavor is one of the most important criterion of acceptability of meat affecting consumer purchasing decisions. The characteristics of cooked beef flavor include the basic tastes and odor flavors derived from volatile compounds (Ba et al., 2012). The main flavor precursor amino acids with reducing sugars determine the kinds of volatile compounds generated; reaction between only one amino acid and one sugar will yield hundreds of volatile compounds through Maillard reaction and Strecker degradation (Elmore et al., 2002; Farmer, 1994). In-mouth perception of flavor and tenderness has been documented in relation to post mortem degradation of specific myofibrillar proteins which closely linked to the structural changes during aging (Hwang et al., 2003). Protein degradation by enzymes, give rise to protein fragments (Huff-Lonergan et al., 2010b) and releasing taste active small peptides free amino acids during aging (Toldra and Flores, 1998). Therefore, the concentration and rate of appearance of released amino acids during aging may great determinants of both palatable meat taste and odor. In addition, the resulting tenderness and flavor is influenced by muscle type and aging period. The national beef tenderness surveys stated considerable variation in the length of postmortem aging periods of beef cuts (Dashdorj et al., 2015). Thus early post mortem electrical stimulation (ES) to localized part of carcasses could be used for accelerate beef aging and reduce tenderness variability between beef cuts.
The post slaughter treatment carcass ES is one of the major interventions adopted in the meat industry for enhancing meat quality traits (Adeyemi et al., 2014). Cross et al. (1985) reported that application of ES of carcasses bring significant effect on the aging periods saving and economic feasibility through improvement of meat tenderness. ES categorized into low voltage that is applied ranges from 20 to 120 V, or high voltage that is greater than 120 V. Moreover, an approach to stimulation had been developed in Australia based on medium voltages which were favoured over the traditional high voltage systems. Researchers suggest that low voltage ES initiates a muscle pH decline similar to that associated with the use of high voltage stimulation.
Many investigations were conducted the influence of ES on meat tenderness (Hwang and Thompson, 2001; Hwang et al., 2003; Simmons et al., 2008) and other quality traits such as color and water holding properties (Castaneda et al., 2005; Nazli et al., 2010; Polidori et al., 1999; Wiklund et al., 2001), while to our knowledge limited information about the effect ES on the flavor of cooked meat is available in the scientific literature and the mechanism by which ES enhances flavor has not been identified.
A large number of studies have identified the effectiveness of ES technology to accelerate the tenderization of meat. The main factors are operative in increasing the tenderness of stimulated muscles; prevent of cold shortening, increases proteolytic action of endogenous, affect the structure of myofibrils during rigor development and physically disrupt muscle structure during chiller aging (Hwang and Thompson 2001; Hwang et al., 2003; Nowak et al., 2011). The accelerated pH decline caused by ES can increase calpain proteolytic activity (Pearce et al., 2010) and some fibers will enter rigor earlier than nonstimulated muscle and age faster (Devine, 2014). However, some authors concluded the key mechanism of ES induced tenderization is via direct myofibrillar damage rather than the effect of an accelerated pH decline (Hwang et al., 2003; Simmons et al., 2008).
Given that meat flavors are largely determined by proteolytic activity, we hypothesized that early postmortem ES treatment improves meat flavor as much as chiller aging through its effect on elevated proteolytic activity. As far as we aware, there is no accessible reports whether improvement of meat flavor by ES treatment is compatible with chiller aging. The current study was designed to examine the effect of low voltage ES on volatile flavor components and meat quality traits for m. longissimus lumborum and biceps femoris muscles from Hanwoo beef.
Material and Methods
A total of 16 Hanwoo commercial steers (n=8) and cow (n=8) were sampled from an industrial population. Animals were stunned using a captive bolt and slaughtered in a day at a commercial slaughter house. The mean of carcass weight, back fat thickness and rib-eye area were 393 kg, 16 mm and 87 cm2 respectively, and animals were up to 36 months old. After slaughter, carcasses were immediately moved into a 4°C chiller room before approximately 30 min post-mortem. Right side of each carcass was electrically stimulated with 45 volts (uni-directional square wave pulses of 7 milliseconds width, 14.3 pps, output: 1.2 to 9 amps) for 60 sec. Multi-point electrode probes were inserted into the muscles at the distal end of the biceps femoris and cranial end of longissimus muscle. The corresponding left sides were used as a control side. Sides were kept overnight at the 4°C chiller room. The day following slaughter the longissimus muscle from the 13th thoracic vertebrae to the last lumbar vertebrae and biceps femoris muscles were removed from each carcass side and trimmed of all epimysium and subcutaneous fat. Each muscle was divided into two blocks; cranial and caudal parts vacuum-packed and was assigned to two aging groups; 2 and 14 d of aging at 4°C.
Meat color, WBSF and cooking loss were determined on the sample steaks approximately 300 g. Meat color evaluated with Konica Minolta Spectrophotometer CM-2500d (Sinodevices, Japan) with an 8 mm measuring port, D 65 illuminant and 10° observer. Three measurements were taken on the 30 min bloomed surface of the beef. After the color measurement, determined cooking loss. Approximately the 3 cm thick steaks of 250 g of each sample were placed in plastic bags and heated in water bath at 70°C for until the core temperature had reached 70°C. The cooked samples were cooled in tap water for 30 min. Samples were reweighed after removed excess moisture. The WBSF values were measured in an Instron Universal Testing Machine (Model 3342, USA) on six pieces core samples with 0.5 inch diameter. A crosshead speed was 400 mm/min and a 40 kg load cell. Further, the pH and the moisture content analyzed by HR 73 halogen moisture analyzer (Mettler-Toledo, Switzerland). The intramuscular fat (IMF) content was analyzed using the Soxhlet extraction method.
The protein concentration of the sample was adjusted to 2 mg/mL using sample buffer (2× treatment buffer, 2-mercaptoethanol and bromophenole blue, pH 6.8) and heated at 95°C for 5 min. Each sample was loaded into 4% Stacking Gel and the proteins were separated using 12.5% separating Gel. 20 cm mini gel was run at 100 V. After SDS-PAGE, the protein in the gel transferred to 0.2 μm PVDF membranes at 200 mA for 60 min in transfer buffer (10% methanol, 192 mM glycine, 25 mM Tris). Subsequently, the membrane blocked by 5% skim milk at room temperature for 1 h. The membrane incubated with monoclonal primary antibodies (Monoclonal anti-troponin-T (JLT-12, SIGMA, USA), diluted 1:2,500 in TTBS). The bound antibodies were visualized using ECL kit and then the images were taken by Versa Doc 3000 imaging system (Bio-Rad, Hercules, USA).
Direct transesterification of fatty acid followed the procedure of Rule (1997). GC-FID (Shimadzu, Japan) was used to separate and identify the fatty acid components of the samples. Separation of components was carried out on a Fame Wax Cap Column (30 m×0.32 mm ID×0.25 um). Flow rate was 0.7 mL/min. Split ratio used was 30:1. The N2, H2 and air were used as the carrier gas. The inlet temperature was 250°C and the oven temperature program was: 50°C for 1 min, then raised to 200°C at the rate of 25°C per minute, further increased to 240°C at 3°C per min. Then, temperature was held at 240°C for 15 min. Detector temperature was 250°C. The each fatty acids were expressed as percentage of the total fatty acids detected as standard-fatty acid methyl esters (Marine Oil FAME Mix; Cat No. 35066).
TBARS was determined by using the method described with Buege and Aust (1978). Homogenized 2.5 g samples with 7.5 mL distilled water, 25 μL saturated butylated hydroxyansole (BHA) and 10 mL thiobarbituric acid/trichloroacetic acid (TBA/TCA) at 11,000×g for 15 s by homogenizer (Ultra-Turrax T25B, IKA, USA). The volume of the homogenate adjusted to 30 mL with a TBA/TCA solution and placed in ice. The homogenate was immersed in a 90°C water bath for 15 min. Thereafter, homogenate placed in ice and cooled for 20 min and centrifuged at 3,000×g for 10 min. 1 mL supernatant was taken and measured at 531 nm by Ultrospec 2000 spectrophotometer (Pharmacia Biotech, UK). The TBARS value expressed as mg malondialdehyde/kg (MDA/kg) of fresh meat.
The colorimetric determination of hydroxyproline method in Kolar (1990) used as measure of total collagen content. The heat solubility of intramuscular collagen determined using the method of Hill (1966).
Muscles (0.2 g) sonicated with 100% ethyl alcohol containing 0.4% formic acid and centrifuged at 13,000×g for 10 min. Chromatography was performed using a HPLC-MS (Agilent 6430, USA). The characterization and quantitative analyses of AAs were carried out on Intrada AA 50×3 mm column (Imtakt, USA). The solvent A was acetonitrile : tetrahydrofuran : 25 mM ammonium formate : formic acid (9/75/16/0.3 v/v/v/v) and B mobile phase was acetonitrile : 100 mM ammonium formate (20/80 v/v). HPLC conditions for free amino acids set by following the method of Woodward and Henderson (2007). The column temperature was maintained at 40°C, flow rate was 0.6 mL/min and the injection volume was 10 μL. The peaks of the individual AAs were identified and quantified based on retention time of the 17 primary AAs mixture standard (Merck, Darmstadt, Germany). Final concentration of standard solutions were 90, 225, and 900 pM. The amino acids were quantified by using norvaline as an internal standard.
The volatile compounds analyzed by GC/MS, following the method of Ba et al. (2012). The samples were powdered in nitrogen using a mini-grinder. A 1 g aliquot of ground meat samples was put in 40 mL headspace vials and sealed with PTFE silicone septum. Then heated at 121°C for 20 min in an autoclave, cooled at room temperature. After equilibration SPME needle (Carboxen/PDMS, 75 μm, Supelco Co., USA) inserted into the PTFE/silicone septum and extraction process for volatile compounds was carried out at 60 min. The internal standard 2-methyl-3-heptanone (Merck, Darmstadt, Germany) was added into vial for volatiles quantification. Then, fiber was retracted and immediately inserted into chromatography injection port at 250°C for 5 min. GC-MS (Agilent Technologies 6890N Network GC System) and A DB-5MS capillary column, 30 m×0.25 mm i.d.×0.25 μm film thickness (J & W Scientific, Folcom, USA) were used for all analyses. Carrier gas was helium. Flow rate was 1.0 mL/min. Oven program; 5 min holding time was at 40°C then, increased to 250°C at a rate of 8°C/min, it kept 31.25 min at 250°C and holding time was 5 min. The identification of volatile compounds was carried out by comparing their mass spectra with the Mass Spectral Data 7th edition, then a series of n-Alkanes (C8–C20) (Merck, Darmstadt, Germany), and authentic compounds of choice were run under the same conditions to get the retention times for the identification of volatiles The linear retention index values calculated from the standard alkane retention times. The internal standard 2-methyl-3-heptanone was used for volatiles quantification.
Means of meat quality traits were examined as a function of ES, sex, chiller aging, muscle type and their first and second interactions using a generalized liner model (GLM) with a random effect for animal (software 9.3, SAS Institute, Cary, NC, USA). When the main effect and/or the first and second interactions were not greatly significant (p>0.05), the effects were removed from the final models. The levels of significant for the estimated means were compared using the Duncan’s multiple-range test (p<0.05). Subsequent analysis of Pearson’s correlation coefficients and principal component analyses were performed by applying PROC CORR and PROC FACTOR engines (Software 9.3, SAS Institute).
Results and Discussion
Means of quality traits of m. longissimus lumborum (LL) and m.biceps femoris (BF) muscles that electrically stimulated and aged for 2 and 14 d are documented in Table 1. Result showed that ES treatment significantly (p<0.05) improved WBSF of both muscles, while chiller ageing greatly (p<0.05) affected pH, WBSF and TBARS values for both muscles, and color CIE a*, CIE b* values for BF. Numerous workers have reported that ES caused muscle contractions and increased the rate of glycogen usage (Hwang et al., 2003) that resulted increases the rate of pH decline in m. longissimus during the first 24 h postmortem (Kim et al., 2013). Huff-Lonergan et al. (2010b) found that pH differences between ES and control group were only from 3.5 to 8.5 hours in postmortem and the pHu measurement at 24 h postmortem showed no difference between the stimulated and nonstimulated beef. However, the ultimate pH of both LL and BF muscles varied (p<0.05) between aging days. Similar increase in pHu with post-mortem time has been reported in beef; there was linear increase tenderness at 1 to 13 d of aging with increasing pH (Silva et al., 1999). Although Hwang and Thompson (2003) resulted that due to differential aging rates the optimum pH at 70 min postmortem increased with aging time from 5.96 to 6.14 for 1 to 14 d postmortem, respectively.
In terms of color values of muscles, use of ES did not show any effect on the meat color, indicating stable oxygenation capacity of myoglobin (Abbasvali et al., 2012; Channon et al., 2005). However, aging time increased color CIE L*, CIE a* and CIE b* values (p<0.05) indicating that postmortem aging enhanced the oxygenation of metmyoglobin, thus improved meat color up to 14 d aging, while this changes only for BF muscle, color of LL muscle was stable during aging (Table 1). Aging has been reported to influence meat color through metmyoglobin accumulation rate, metmyoglobin reduction activity, and oxygen consumption rate (Jeremiah et al., 2003; Li et al., 2011) and extent color change during aging was muscle dependent.
Under the current experiment, connective tissue and cooking loss varied between muscles and furthermore these traits was not affected by ES and aging (p°C0.05). The loin with higher IMF (p<0.001) and with lower total collagen (p<0.001) was potential tender (p<0.001) with lower cooking loss (p<0.001) than silverside (Table 1) in both 2 and 14 d aging. The lower amount cooking loss and WBSF a function of the higher fat content for the muscles compare to the others (Dashdorj et al., 2012; Nishimura et al., 1995).
WBSF at 2 d post-mortem indicated that ES treatment decreased 1.04 and 0.79 kg for BF and LL, respectively, and the improved tenderness for ES-treated muscles continued at 14 d post-mortem, with significantly (p<0.05) lower WBSF (ca., 0.4 kg). This result indicated that muscles from the electrically stimulated side more tendered than its non-stimulated counterpart and increases effectiveness of tenderness by ES more remarkable during early ageing days. Similar results were demonstrated that the low voltage ES accelerated the rate of carcass pH decline and improved objective tenderness of beef (Li et al., 2006; Nazli et al., 2010), improved sensory tenderness by 1.3 units even after 30 d aging (Pearce et al., 2010). Polidori et al. (1999) reported significant effects of early post mortem low voltage ES (28 V) on meat tenderness in lamb at 7 d aging. In addition, different muscles reacted differently to the ES application (Nazli et al., 2010; Polidori et al., 1999) in their rate of postmortem glycolysis (Huff-Lonergan et al., 2010b).
Researchers noted that meat tenderization by ES has been attributed to factors, such as cold shortening prevention through acceleration of glycolysis and rigor onset before temperature reaches the cold shortening range (Hwang et al., 2003). A secondary effect is accelerated proteolytic activity through enhanced calcium releases, then it causes of physical disruption of fiber structure through extreme muscle contractions (Aberle et al., 2001; Hopkins et al., 2006). The acceleration of postmortem proteolysis in electrically stimulated meat is mainly due to the increased proteolytic activity of calpains (Hwang and Thompson, 2001; Pearce et al., 2010). The calpains degrade key minor muscle proteins, thereby fragmenting the muscle structure, which weakens and can be more easily broken down in the mouth (Huff-Lonergan et al., 2010a). In addition, Pearce et al. (2010) suggested that ES causes the release of lysosomal protease cathepsins, since cathepsins degrade proteins such as actin and myosin however, these are not usually observed to be degraded in stimulated muscle (Hwang et al., 2003).
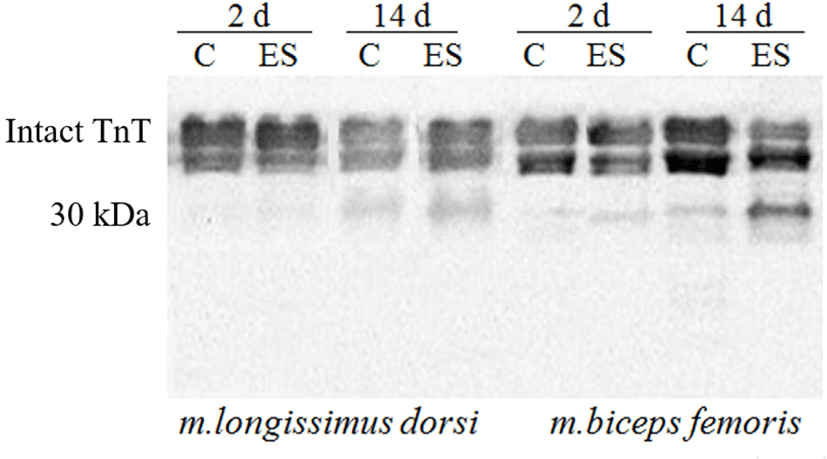
Present study compared Troponin T (Tn-T) degradation of ES with that for non-stimulated muscles by using Western blotting (Fig. 1) in that the degradation was little faster on ES than aging, with a faster degradation stimulated BF muscles than stimulated LL. The observation coincided with a faster activation of μ-calpain for the electrically stimulated muscles (data not shown). The post mortem aging was associated with a loss of Tn–T protein which closely linked to the tenderization (Hopkins, 2014), a generation of Tn-T peptides and releases amino acids (Mikami et al., 1994). As the meat ages, researchers observed changes in the ultrastructure of muscle fibers and degradation of myofibrillar and cytoskeletal proteins such as Tn-T, Tn-I, titin, desmin, nebulin and vinculin (Devine, 2014; Koohmaraie, 1984; Nowak et al., 2011), caused by proteolytic enzymes (Huff-Lonergan et al., 2010b; Koohmaraie et al., 1984). Although Devine (2014) noted that changes in the ultrastructure of the stimulated muscle had shown that contracture nodes are formed, accompanied by fibre disruption that may facilitate the degradation of the myofibrillar structure during aging and this may be more important in red muscle fibres, where the disruption is greatest. It supported by Hertzman et al. (1993) who noted that a more rapid glycolysis early post mortem, especially for a red muscle like BF, is induced by ES.
TBARS value was unaffected by ES treatment, whereas greatly (p<0.05) increased during chiller aging. This finding was coincided with a hexanal value, which amount of this volatile greatly (p<0.05) increased for LL, while slight increases observed for BF muscles during aging (Table 1). TBARS and hexanal usually used as indicators of lipid oxidation and rancidity development in the meat and normally strongly correlated with each other in experimental models of warmed-over flavor development (Spanier et al., 1997). Malondialdehyde (MDA) results mainly from the oxidative degradation of polyunsaturated fatty acidsthus, fattier meat will have higher MDA levels. However, TBARS values in the current experiment were below the critical limit of 0.5 mg MAL/kg meat. Values above 0.5 indicate a level of lipid oxidation products which impart a rancid flavor and odor that can be detected by consumers (Wood et al., 2008).
A total of 63 volatile compounds identified in cooked LL and BF muscles by using SPME-GC-MS method (Table 2). According to their chemical nature, identified volatile compounds were classified into chemical classes, including aldehydes (23), alcohols (7), ketones (6), hydrocarbons (17), sulfur containing compounds (4), pyrazines (2) and furans (4). Within these chemical classes the major aroma compounds were aldehydes, representing between 51.7% to 58.6% of total volatile compounds, followed by hydrocarbons (15% to 23.2%) and alcohols (5.4% to 7.6%).
Additionally, as far as the individual compounds are concerned; ES treatment significantly (p<0.05) affected the level of 20 volatile compounds at 2 d post-mortem. ES results greater increase (p<0.05) amounts of aldehydes (pentanal, hexanal, heptanal, octanal, propanal, E-2-octenal, nonanal, benzenacetaldehyde, E-2-decenal and E-E-2.4-decadienal), pentanol, 2-propanone, 2-nonanone, 2-acetylthiazole, 2-methylpyrazine, 2,5-dimethylpyrazine and total of pyrazines in cooked LL muscles than nonstimulated. However, amount of 2-methylbutanal, 2-undecenal, dodecane and 1-heptanol in LL muscles decreased (p<0.05) by ES.
For BF muscles, contents of volatiles such as pentanal, furfural, hexadecane, 2-acetylthiazole, 3-acetylpyrrol, 2,5-dimethylpyrazine greatly (p<0.05) increased by ES treatment, while benzaldehyde, decanal, 1-octen-3-ol, decane and total of furans decreased (p<0.05) by this treatment. After 14 d of aging, the acetaldehyde, 2-methylbutanal, hexanal, heptanal, 2-octenal, nonanal, benzenacetaldehyde, E-2-decenal, undecanal, 2-furanmethanol, 2-propanone, 2-nonanone, decane, undecane, dodecane, tetradecane, hexadecane, 2-methylpyrazine, 2-octylfuran and total amount of pyrazins and furans of LL muscle showed significant increases (p<0.05), where the quantity was higher on 14 d than 2 d (Table 2), while pentanal, octanal, 1-pentanol decreased (p<0.05) by chiller aging. However, for BF muscles the 3-methybutanal, pentanal, furfural, benzaldehyde, propanal, decanal, palmitaldehyde, 1-hexanol, 1-octen-3-ol, 2,4-dimethylheptane, dodecane, hexadecane, dimethyldisulfide and 2,5-dimethylpyrazine, total of ketones, hydrocarbons, sulfuric compounds and pyrazins greatly increased (p<0.05) between aging days. The current data imply that the volatile compounds affected by chiller aging included primarily those indicative of Maillard reaction products and lipid oxidation.
Additional analysis was extended to the quantities of selected volatile compounds which were significantly affected by treatments were subjected to a principal components analysis (PCA). The factor loading of the PCs used the correlation coefficient matrix as the calculation base. Fig. 2 shows the loading plots of the volatile compounds and treatments on the first two PCs. The PC1 in this plot contributes to 36.7% of the variability of the data, while PC2 contributes to 24.5% of the variability of the data. Treatments were separated across PC1 and muscles were separated across PC2. The highest factor loading for PC1 was observed in treatment BFES14d followed by LLES14d, LLCon14d, LLES2d, BFES2d, BFCon14d, LLCon2d and BFCon2d (BF, Biceps femoris; LL, Longissimus lumborum; ES, electrical stimulated; Con, control; aging, 2 and 14 d).
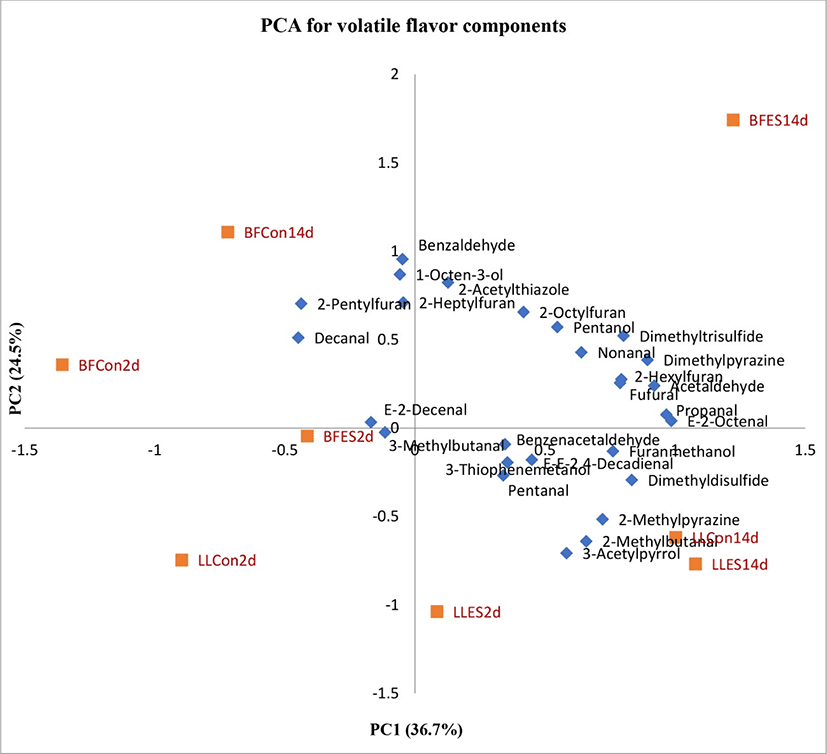
A remarkable change of the PCA2 scores in stimulated and aged 14d BF muscles (BFES14d) were attributed to the highest increase of most volatile compounds including E-2-octenal, propanal, acetaldehyde, dimethylpyrazine, dimethyltrisulfide, 2-hexylfuran, fufural, nonanal, pentanol, 2-octylfuran and 2-acetylthiazole. However, dimethyldisulfide, furanmethanol, 2-methylpyrazine, 2-methylbutanal, 3-acetylpyrrol, E-E-2.4-decadienal, 3-thiophenemetanol, benzenacetaldehyde and pentanal were found in higher concentrations in LLES14d. These facts suggested that the most volatile compounds were correlated to electrically stimulated and aged muscles (BFES14d followed by LLES14d). The treatments LLCon14d and LLES2d were strongly correlated only with the 2-methylbutanal and E-2-decenal respectively. Several compounds such as benzaldehyde, 1-octen-3-ol, 2-pentylfuran and decanal were correlated with chiller aging.
It is well known that raw meat has little aroma and blood-like taste, and that the taste and odor of cooked meat is thermally developed during heating, mainly from the interactions of flavor precursors, including peptides, free amino acids, reducing sugars, nucleotides, lipid and vitamins (Ba et al., 2012; Dashdorj et al., 2015). The volatile flavor compounds can be divided into two groups, those formed from the Maillard reaction and those formed from lipid oxidation. Out of more than 1,000 volatiles identified in cooked meat, but only few have been characterized as strong meat like and or roast aroma impact compounds. In general, the meaty and roast aromas are frequently associated with sulfur containing compounds, pyrazines, thiophenes and thiazoles that have very low odor thresholds and hence are of vital importance to the meat aroma (Ho, 1996). The most important reaction responsible for these desirable volatile compounds is Maillard reaction and interaction between Maillard reaction products with lipid oxidation/degradation products (Ba et al., 2012; Elmore et al., 2002). Especially amino acids can undergo Strecker degradation to produce Strecker products. Strecker degradation by sulphur-containing amino acids such as cystein, cystin and methionine produce the other important intermediate products sulfuric and nitrogen containing compounds, thereafter these intermediate products can further react with other compounds or with each other to produce low and high molecular weight end flavor compounds (Ba et al., 2012). Otherwise the reaction of other nonsulfur containing amino acids with sugars produces nitrogen-containing products such as pyrazines. Thus, protein degradation products; peptides and amino acids formed during aging in meat upon the activity of enzymes are very important fractions in volatiles synthesis (Toldra and Flores, 1998).
The heterocyclic pyrazines are products from Maillard reactions generally contain pleasant nutty and roasted aromas. Data presented in Table 3 indicated that 2-methylpyrazine strongly correlated to valine (r=0.59; p<0.05), weakly to alanine (r=0.23), asparagine (r=0.24) and lysine (r=0.24), while 2.5-dimethylpyrazine correlated to phenylalanine (r=0.29) and alanine (r=0.20). The results agree with the findings of Li et al. (2006) who documented that 2-methylpyrazine and 2-dimethylpyrazine formation probably results from the condensation of two molecules of α-ketone derived from the Strecker degradation between an amino acid and α-carbonyl compounds. The pyrazine was mostly produced by alanine and phenylalanine while methylpyrazine was driven valine reaction following by phenylalanine and methionine reaction. Moreover, deamidation of glutamine, asparagine and both α-and ε-amino groups of lysine also could involve in the pyrazine formation under the conditions of Maillard reaction (Ho, 1996). The proportion of pyrazine compounds increase in cooked meat as influenced by aging time; with longer aging resulting in higher values probably due to increases in sugars and free amino acids associated with aging (Elmore et al., 2004).
The sum of sulfur containing compounds contribute to meaty flavor notes (dimethyltrisulfide, dimethyldisulfide, 2-acetylthiazole and acetlpyrrol) were collectively found to be greatest (p<0.05) in stimulated BF steaks. Moreover sulphur-containing amino acid methionine was significantly correlated dimethyltrisulfide (r=0.35, p<0.05) and a weak positive correlation was observed with dimethyldisulfide (r=0.26), 2-acetylthiazole (r=0.25) and 3-thiophenemethanol (r=0.29) respectively (Table 3). This is consistent with the findings of Watanabe et al. (2015) who reported that 2-acetylthiazole and dimethyltrisulfide can be produced by pyruvaldehyde from acetaldehyde and sulfur containing free amino acids. Thiazole formation probably involves the reaction of dicarbonyls, or hydroxyketones with hydrogen sulphide and ammonia, formed via the hydrolysis or Strecker degradation of Cys2, and aldehydes (Mottram, 1998).
The methyl branched aldehyde 3-methylbutanal is known to be able to give rise to bacon-like flavor via reactions with sulphur-containing compounds such as cysteine and methionine (Elmore et al., 2004). Formation of 2-methylpropanal, 2-methylbutanal (with fruity odor) and 3-methylbutanal are often arises from Strecker degradation of the amino acids including valine, isoleucine and leucine respectively (Elmore et al., 2004; Ho, 1996). Similar results were found in the present study where the amount of 2-methylpropanal was correlated to valine (r=0.22), whereas 2-methylbutanal to isoleucine (r=0.26), 3-methylbutanal to leucine (r=0.28) respectively (Table 3).
Interestingly, the 2-furanmethanol correlated (p<0.05) with most amino acids except glycine (Table 3). The methyl branched alcohols 2-furanmethanol, 3-thiophenemethanol are probably derived from the Strecker degradation of amino acids (Elmore et al., 2004). Although Watanabe et al. (2015) and Chen et al. (2004) reported that thermal degradation from RNA and ATP generates furfural whereas 2-furanmethanol derived from thermal degradation of deoxyribose from DNA. The increases in furfural and the relatively consistent quantity of 2-furanmethanol during aging probably linked to the more stability of DNA than RNA and ATP. Thus, ES may speed up muscle pH fall and depletes muscle energy reserves. By changing concentrations of precursors such as reducing sugars, nucleotides and amino acids would be expected to influence eventual flavor (Chen et al., 2004; Watanabe et al., 2015).
Pearson correlation coefficients between selected unsaturated fatty acids with aldehydes and furans which occur in cooked beef through the thermal oxidation of fatty acids are shown in Table 4. Among aldehydes the hexanal (r=−0.39; p<0.05), heptanal (r=−0.32; p<0.05), octanal (r=−0.32; p<0.05), nonanal (r=0.25), propanal (r=−0.39; p<0.05), decanal (r=−0.44; p<0.05), (E)-2-octenal (r=−0.36; p<0.01), (E)-2-decenal (r=−0.32; p<0.05), benzaldehyde (r=−0.31; p<0.05), 2-undecenal (r=−0.20) and benzenacetaldehyde (r=−0.29) negatively associated with oleic acid. The (E)-2-octenal (r=−0.40; p<0.01), propanal (r=−0.30; p<0.05), pentanal (r=−0.20), hexanal (r=−0.23), heptanal (r=−0.28), (E)-2-heptenal (r=−0.25), 2-undecenal (r=−0.26) correlated with linoleic acid (C18:2) while the benzaldehyde correlated (r=−0.34; p<0.05) to linolenic acid (C18:3). In terms of furans, the 2-pentylfuran and 2-hexylfuran significantly associated with linoleic acid (r=−0.45; r=−0.35; p<0.05 respectively), weakly with oleic acid (r=0.26; r=0.22 respectively), 2-2-pentylfuran correlated to linolenic acid (r=0.22) while 2-octylfuran correlated only to oleic acid (r=0.20).
The lipid oxidation/degradation is very important as the Maillard reaction for the formation of flavor in cooked meat (Ba et al., 2012; Elmore et al., 2002). It has been suggested that the basic species-specific differences in the aroma of cooked meats are mainly due to concentration and compositional differences in lipid-derived flavor substances (Elmore et al., 2002). The volatiles including aldehydes, hydrocarbons, ketones, alcohols and carboxylic acids derived from lipid degradation have been found in cooked meat (Ba et al., 2012). Within these compounds the saturated and unsaturated aldehydes produced by oxidation of unsaturated fatty acids such as oleic (C18:1), linoleic (C18:2), and linolenic acids (C18:3) is the major source of volatile compounds in cooked meat (Cerny, 1992; Elmore et al., 1999). The oxygen-containing heterocyclic furans known to have a caramel-like aroma also arise from fatty acid oxidation (Mottram, 1998).
The hydrocarbons, ketones, alcohols and carboxylic acids often associated with lipid oxidation and were affected by aging. However, hydrocarbons, alcohols and ketones with higher detection threshold contribute less significantly to flavor development, only few alcohols and ketones partly contribute to the flavor of cooked meat (Ba et al., 2012). Both types of lipid thermal oxidation and autoxidation would form these compounds, but time-dependent changes could be mainly explained by autoxidation during storage (Watanabe et al., 2015). Therefore, meat chiller aging could result in increases of important flavor compounds however a longer aging period may negatively influence the flavor quality of cooked meat.
In current study chiller aging had a large influence on the amount of amino acids. Total amount of amino acids of electrically stimulated muscles greatly increased (p<0.05) during aging (from 589.1 to 809.6 μg/g for chiller aging and from 614.1 to 846.1 μg/g for ES group respectively, data not shown). The all amino acid concentration was not significantly but apparently higher in ES treated groups than aging groups. It could be suggested that the differences in the content of amino acids are probably due to the different in enzyme activity between groups. Similar results were reported by Mikami et al. (1994) who noted that low voltage ES (40 V and 13.8 Hz) increased level of small peptides and free amino acids. These researchers also noted that origins of these flavor precursors are derived from myofibrillar proteins as well as sarcoplasma. Sekikawa et al. (1999) presumed that ES had an effect not only on proteases but also on other enzymes such as transaminase and lysosomal enzymes. The lysosomal enzymes released by ES acted more rapidly on the meat. Huff-Lonergan et al. (2010b) stated that calpains catalyze the release of filaments from the myofibril that had amino acids, also provide to the proteasome and lysosomes for complete free amino acids degradation. Sekikawa et al. (1999) reported that aminopeptidase activity in beef decreased with storage.
Interestingly, level of some compounds, including hexanal, octanal, 2-undecenal, 1-heptanol, 3-thiophenemethanol, tetradecane, heptanes of electrically stimulated LL muscles decreased (p<0.05) after 14 d aging, whereas these changes were not observed in stimulated BF muscles and control samples. There have been reports of Elmore et al. (2002) reported that difference in IMF content between muscles was related to flavor intensity of beef due to its contribution to the formation of volatile compounds by means of lipid oxidation. Lower fat content beef was related with greater quantities of volatile compounds due to the solubility of volatile aroma compounds in lipids. Although differences between muscles in the activity of some enzymes involved in the oxidative defense system of muscle, there may be differences in the antioxidant defense system between muscles would influence calpain activity and proteolysis (Huff-Lonergan et al., 2010a). Adeyemi and Sazili (2014) reported that the heterogeneous nature of muscle substantiates the variation and complexity in their response to ES.
Present study reports for the first time the effect of the ES on formation of volatile compounds in cooked Hanwoo beef. ES treatment might effective on increasing level of flavor precursors such as amino acid, reducing sugars and nucleotide contents, thereby acting the increase in percentages of important sulfurous and nitrogen containing volatile compounds which considered being principal contributors to meat flavor. In particular, for BF muscles the effects of ES were more significant and outstanding than that of chiller ageing.
Conclusion
The current data demonstrated that early post mortem low voltage ES to localized part of carcasses using ES (60 V/60 s) improved tenderness of important beef muscles without any negative effects on other quality traits. ES accelerated formation of important favorable volatiles such as 2-methylpyrazine and 2,5-dimethylpyrazines, 2-acetylthiazole, 3-methylbutanal, 2-methylbutanal other some Strecker aldehydes of cooked beef which was greatly differed from these formed during chiller ageing. The current data implied that ES treatment improved volatile flavor development by largely different pathways compared with that of chiller aged muscles.