


Introduction
Water-holding capacity (WHC) of postmortem porcine musculature is an important quality trait. Its variations need to be assessed to evaluate and process pork products. Many methods have been developed and compared for measuring WHC of meat (Fennema, 1990; Filho et al., 2017; Otto et al., 2004; Trout, 1988). Each method has its advantages and disadvantages. Common methods used to measure WHC are based on either applied pressure (Grau and Hamm, 1953) or centrifugal force (Wierbicki and Deatherage, 1958) followed by subsequent measurement of water loss. Filter-paper wetness (FPW) method has been recognized as the simplest and fastest technique to evaluate WHC of pork carcasses (Kauffman et al., 1986). Among many procedures for measuring WHC, drip loss (DL) method has been proposed as a reference method (Honikel, 1987). It has been considered as a standard method. Later, EZ-DL method by weighing meat juice container has been suggested for pork categorization (Correa et al, 2007; Filho et al., 2017; Rassmussen and Andersson, 1996).
However, it is difficult to achieve high accuracy with DL method if DL is small due to small muscle size or high fat content. In addition, DL and EZ-DL techniques are gravimetric methods in which the meat is left suspended in an airtight container for a long period (over 24 h). In such case, it might be better to use filter-paper press method because it does not need a big muscle sample or high DL. Several modifications of this technique have been suggested, including varying the pressure, weighing the meat sample or filter-paper before and after pressing (Hamm, 1986), calculating the meat and total areas as ellipses after measuring the axis whit a Vernier caliper (Hoffman et al., 1982), and using a reticulated dot filter-paper (Zamorano and Gambaruto, 1997). However, all these methods do not measure a real released water (RW) weight by pressure, but evaluate damp area with RW on filter-paper, result in variations and low correlation with DL. In addition, the result of these methods strongly depend on the pressure and sample weight. Therefore, it needs to measure RW directly without any loss of water. For this reason, in the present study, using of plastic film sandwich is introduced to prevent loss of meat juice and to measure the RW directly. The objectives of the present study were to evaluate the convenience of using RW method with filter-paper absorption within two thin plastic films after pressing, and to find a methodology that could be used as a standard for measuring WHC of pork muscles.
Materials and Methods
A total of 150 pork loins belonging to three pork quality groups (PSE, pale, soft, and exudative; RFN, reddish-pink, firm, and nonexudative; and DFD, dark, firm, and dry; 50 pork loins in each pork quality group) with considerable variations in WHC (preliminarily tested by visual evaluation and later verified by percentage of DL) were used in this study. At 24 hr postmortem, 50 pork loins for each quality group (PSE, RFN, or DFD) were selected, vacuum packed, and transported to the laboratory to measure DL % and CIE L*. The loins were classified according to Joo et al. (1999), based on DL % and L* value, into one of three quality groups:
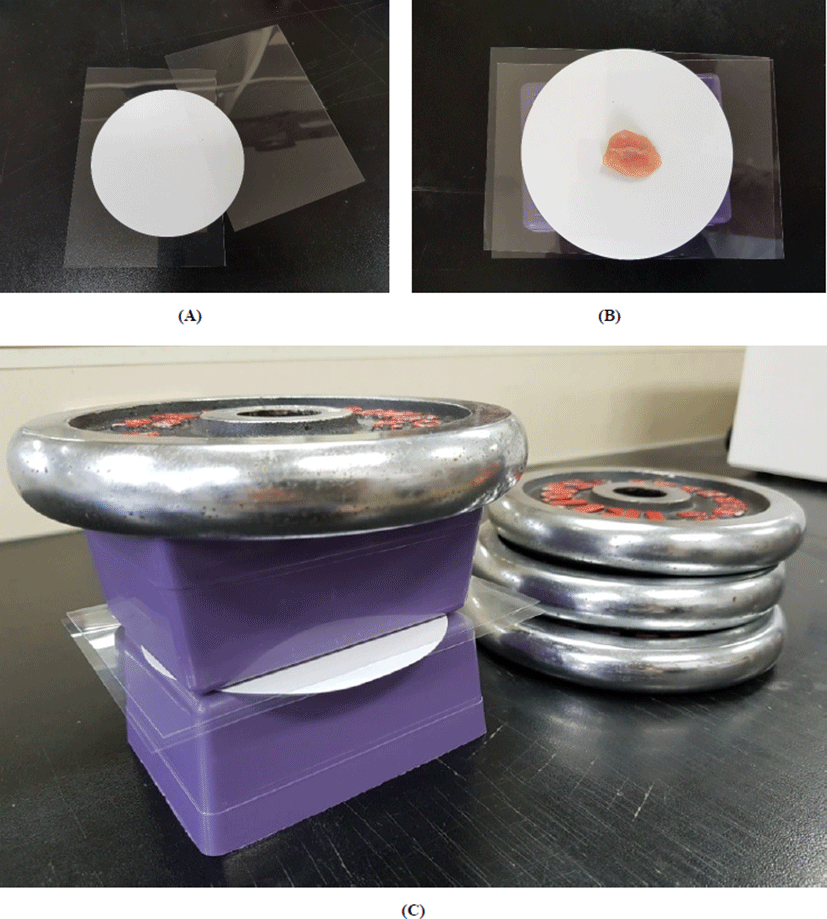
DL was measured as weight loss % during suspension of a standardized (4×3 cm) sample of about 50 g over 24 h at 4°C (Honikel, 1987). RW was studied in triplicates applying different loads. Approximately 3.0 g of intact meat was weighed and placed on a previous desiccated and weighed filter-paper (Whatman No. 1, 11 cm in diameter) with two thin plastic films (Fig. 1A). After weighing the meat sample, the filter-paper and plastic film with meat sample (Fig. 1B) were placed between plexiglass plates. Loads of 1.5 kg, 2.0 kg, 2.5 kg, 3.0 kg, and 3.5 kg were applied for 5 min using dumbbell weights (Fig. 1C). After accurately removing the compressed meat sample, damp filter-paper with two plastic film was rapidly weighed. The percentage of RW % was calculate as follow;
Experimental data were analyzed by analysis of variance (ANOVA) procedure of statistical analysis systems (SAS, 2002). Duncan's multiple range test was used to determine significant differences among means at 5% level of significance (SAS, 2002). Correlation analysis was performed using CORR procedure of SAS to evaluate the correlation between DL and RW method conditions.
Results and Discussion
Results of WHC measurements for the three pork quality groups are shown in Table 1. As expected, DL % was significantly (p<0.05) different among quality groups, similar to previous works (Joo et al., 1995; Joo et al., 1999; Moon et al., 2009). There were also significant (p<0.05) differences in RW % among the three pork quality groups. The RW % varied highly depending on the load used. RW % of 2.5 kg load sample was significantly (p<0.05) higher than that of 2.0 kg or 1.5 kg load sample. However, there were no significant (p>0.05) differences in RW % among 2.5 kg, 3.0 kg, and 3.5 kg load samples for all three pork quality groups. These results suggest that it is necessary to accurately define pressure conditions for RW % determination. Using pressure over 2.5 kg load is not recommended for measuring RW % of pork loin.
Pork quality could be classified into different categories (Faucitano et al, 2010; Joo et al., 1995; Joo et al., 1999; Kauffman et al., 1993; Warner et al., 1997). Characterization of pork has revealed wide variations in the incidence of PSE and DFD (Joo et al., 1999). WHC is key attribute because it allows for separation of meat due to exudation which affects consumer acceptance and meat yield. DL values described in the present study were similar to those reported by Kauffman et al. (1993), Warner et al. (1997), and Joo et al. (1999). They have observed a mean DL of 10% for PSE, 3% for RFN, and 2% for DFD meats. They arbitrarily suggested DL of 5%–6% as the standard value to separate acceptable from unacceptable WHC to categorize pork into quality classes. However, no studies have suggested the use of filter-paper press values as a criterion for pork classification into quality categories because of wide variations in its values. In the present study, RW method and DL method both can distinguish WHC into pork quality categories. RW method is recommended for pork quality categorization considering its ease of use and fast application.
Table 2 shows correlations between DL % and various RW % when different loads are applied. RW % was highly and positively correlated with DL % (r>0.95; p<0.001). The highest correlation was observed between DL % and RW % for sample with 2.5 kg load (r=0.97; p<0.001). However, this correlation was decreased when correlation analysis was performed within each quality group. Especially, within PSE groups, RW % of 1.5 kg load sample was not significantly (p>0.05) correlated with DL % while RW % of 2.5 kg load sample showed significant correlation with DL % (r=0.43; p<0.01). Among all RW loads within each quality groups, the highest correlation between DL % and RW % was observed for 2.5 kg load sample (r=0.66 for RFN and r=0.46 for DFD; both p<0.001). These results imply that applying load of 2.5 kg is the best for determining RW % of pork muscles.
In the present study, the high correlation (r>0.95; p<0.001) between all RW % and DL % is due to sample selection for PSE and DFD groups. Because extreme pale and exudative pork loins were selected for PSE group in this study, a mean DL of 10.65% for PSE could be exaggerated and correlation could also vary widely with different loads applied. This may be the main reason for the decreased correlation when correlation analysis was performed within only PSE group. In general, a rapid postmortem pH decline may have negative effects on WHC that can generate PSE pork. It is well known that about 85% of water in the muscle is located between myofibrils. Denaturation of these proteins because of high temperature and low muscle pH can cause reduction in WHC, resulting in increased release of water from meat (Huff-Lonergan and Lonergan, 2005; Hughes et al., 2014). Results from this study clearly showed wide variations in RW when different loads were applied. The highest correlation between DL % and RW % was observed for 2.5 kg load samples in all three quality groups. Consequently, RW % with 2.5 kg load is recommended as reference method to assess DL % of porcine musculature.
Conclusion
There were significant (p<0.05) differences in DL % and RW % among the three pork quality groups. Although RW % was highly and positively correlated with DL % (r>0.95; p<0.001), RW % varied highly depending on the load used. The highest correlation between DL % and RW % was observed for 2.5 kg load samples in all three quality groups. Consequently, applying 2.5 kg load is the best for determination of RW % and recommended as a reference method to assess DL % of pork muscles.