Introduction
The Korean native black goat (KNBG) (Capra hircus coreanae) has been raised as a domestic stock in Korea from 2,000 years ago. KNBG used mainly for meat production, while in other countries goats are reared for mainly milk production. Although KNBG muscle has been consumed as a medicine more than as a food (Son, 1999), the consumption of KNGB muscle has increased tremendously during last few decades. The Korean nation consider goat meat a healthy food that helps with seasonal attunement of the human body. Particularly, it is considered as healthy food for pregnant women, patients recovering from sickness, and frail children (Kim et al., 1993). It is also a good source of lean meat with desirable fatty acids because of a higher proportion of polyunsaturated fatty acids (Kim et al., 2010a; Kim et al., 2010b). However, the fatty acid compositions of KNBG muscle types are not well known, although physical characteristics and proximate and mineral composition of goat meat are influenced by muscles (Tomovic et al., 2016).
Fat content and fatty acid composition in meat play important role in human health but it also enhances meat quality (Joo et al., 2017). Skeletal muscles mainly consist of muscle fibers that’s why meat quality is strongly influenced by muscle fiber characteristics (Joo et al., 2013). Previously it was reported that there was a relationship between the proportion of each fiber type and size, and IMF content in porcine (Kim et al., 2013a; 2013b) and bovine (Hwang et al., 2010) muscles. Also, in the previous study, it was stated that muscle fiber type composition is an important factor influencing fatty acid composition in Hanwoo muscle (Joo et al., 2017). It is believed that a better understanding of the relationships between muscle fiber and fatty acid composition is useful to control the genetic and environmental factors that alter lipid characteristics in relation to healthy meat production. However, the relationships in goat muscles have not yet been studied. Therefore, the objective of this study was to investigate the muscle fiber characteristics and fatty acid compositions of the four major muscles in KNBG.
Materials and Methods
Five male KNBGs of 36 months of age were randomly selected from among fifty bucks raised at the livestock farm of Gyeongsang National University (GNU). The goats were slaughtered at the meat plant in GNU, and approximately 10 g of four major muscles including longissimus lumborum (LL), psoas major (PM), semimembranosus (SM), and gluteus medius (GM), was taken for histochemical analysis within 1 h post-mortem. It was frozen in isopentane chilled with liquid nitrogen. After 24 h of chilling, these four muscles were removed from carcasses to investigate meat color (CIE L*a*b*), Warner-Bratzler shear force (WBSF), fat content, and fatty acid composition of these muscles.
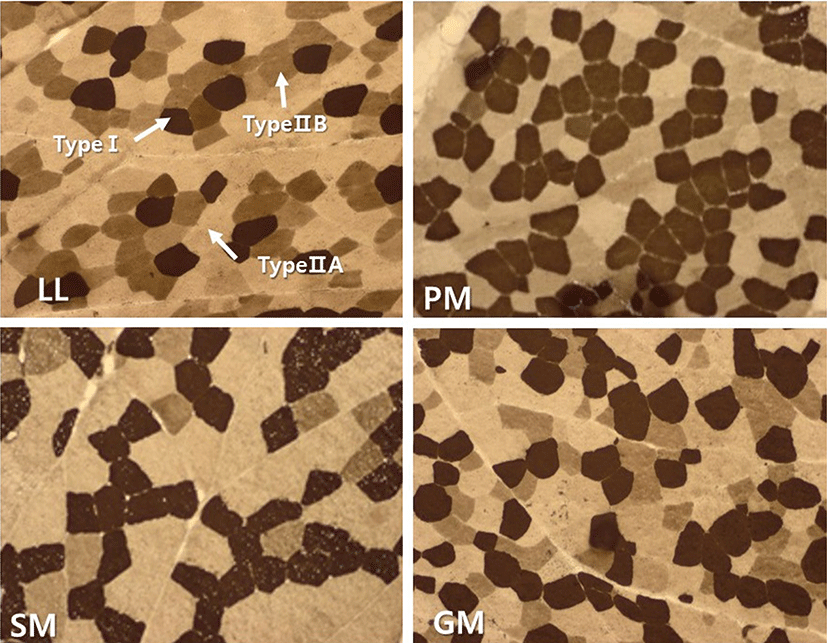
Transverse serial sections of 10 µm in thickness were cut from entire blocks (1.0 × 1.0 × 1.5 cm) with a cryostat microtom (HM525, Microm GmbH, Germany) at −20°C. The sections were subsequently used for histochemical analysis of myosin adenosine triphosphatase (mATPase) following alkaline (pH 10.70) and acid (pH 4.63) preincubation using the method of Brooke and Kaiser (1970) with slight modifications. An image analysis system (Image-Pro®plus 5.1, Media Cybernetics Inc., USA) was used to examine the stained sections. The muscle fibers were classified into fiber type I, IIA, and IIB according to the nomenclature of Brooke and Kaiser (1970) (Fig. 1). Approximately 500 fibers per sample were counted to analyze the muscle fiber characteristics. Fiber number percentage (FNP) and fiber area percentages (FAP) were determined. FNP refers to the ratio of counted fiber number of each fiber type to the total counted fiber number. FAP was the ratio of a total cross-sectional area of each fiber type to total fiber area measured.

The intramuscular fat content was determined using a modified method of Folch et al. (1957). Briefly, lipid was extracted from 3 g of homogenized meat sample using 30 ml of Folch solution I (chloroform : methanol = 2:1, v/v). The homogenate was filtered with Whatman no.1 filter paper. The filtered solution was mixed with 0.88% of NaCl by stirring. The solution was then allowed to separate into two layers. After washing the wall of a measuring cylinder with 10 ml of Folch solution II (chloroform : methanol : H2O = 3:47:50), the final volume of the lower layer was recorded. The upper layer (methanol and water layer) was removed using an aspirator. Then 10 ml of the lower layer (chloroform containing lipid extracts) was added into a dish to dry at 50°C. The weight of the dish was measured before and after drying. Fat content was computed based on weight difference of the dish.
After the extraction of intramuscular lipids, lipid methyl esters were prepared via saponification with 1.0 N methanolic NaOH and subsequently methylated with boron trifluoride in methanol. Fatty acid methyl esters (FAME) were analyzed using an HP6890N (Hewlett-Packard, USA) gas chromatograph equipped with an HP7683 (Hewlett-Packard) automatic sampler. FAME separations were accomplished using a 100 m SP2560 (Supelco, Bellefonte, PA) capillary column (0.25 mm i.d. and 0.20 µm film thickness). For the separation of FAME from the samples, the following temperature program was applied with nitrogen as a carrier gas at a flow rate of 1 mL per min. Column oven temperature increased from 50 to 180°C at 10°C per min, from 180 to 220°C at 5°C per min, 220 to 240°C at 2°C per min, and then held at 240°C for 20 min. The injector and detector were maintained at 250°C. Sample injection volume was 1 µL and the analysis was performed in duplicate. Individual fatty acids were identified by comparison of the retention times with standards (Supelco 37 components FAME Mix, USA). Results were expressed as the percentage of the total fatty acid detected based on the total peak area.
Meat color (CIE L*, a*, and b*) were measured on the surface of muscles, using a Minolta Chromameter CR-300 (Minolta Co., Japan) that was standardized with a white plate (Y = 93.5, X = 0.3132, y = 0.3198). WarnerBratzler shear force (WBSF) values were determined using an Instron Universal Testing Machine (Model 4400, Instron Corp., USA) after samples (1.3-cm diameter cores) obtained from steaks were cooked to internal temperature of 70°C for 30 min.
Experimental data were analyzed by analysis of variance (ANOVA) procedure of statistical analysis systems (SAS, 2002). Duncan's multiple range test was used to determine significant differences among means at 5% level of significance (SAS, 2002). Correlation analysis was performed using the CORR procedure of SAS to evaluate the correlation between individual fatty acids and the sensory panel traits or the meat quality traits.
Results and Discussion
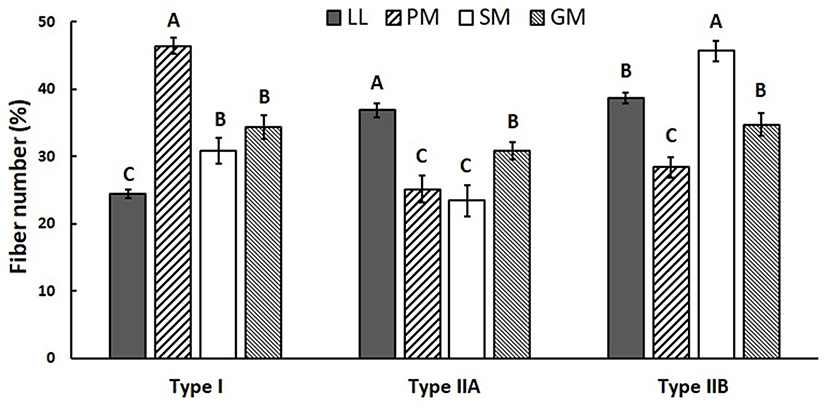
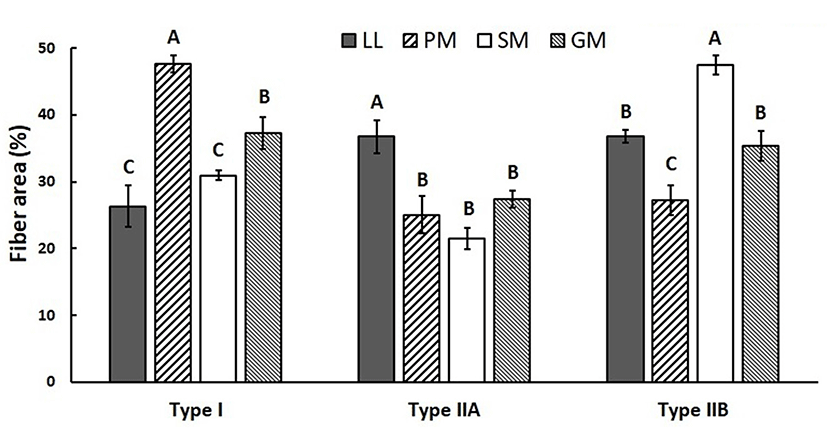
Muscle fiber characteristics (FNP and FAP) of four muscles from KNBG are summarized in Figs. 2 and 3. There were significantly (p<0.05) different in FNP and FAP among four muscles. PM had the highest FNP of type I, while the lowest FNP of type I was observed in LL (p<0.05). There was no significant (p>0.05) difference observed among FNP of type I between SM and GM. However, FNP of type IIA was significantly (p<0.05) different between SM and GM. SM had the highest FNP of type IIB while PM had the lowest FNP of type IIB. FAP results were similar with FNP among four muscles. PM had the highest FAP of type I, and LL and SM had significantly (p<0.05) lower FAP of type I. There was no significant difference in FAP of type IIA among PM, SM, and GM, while LL had significantly (p<0.05) higher FAP of type IIA. Meanwhile, the highest FNP of type IIB was observed in SM, while PM had the lowest FNP of type IIB (p<0.05).


The FNP and FAP results in this study clearly showed that the composition of muscle fiber type varied considerably among four major muscles of KNBG. Many previous reports showed that muscle fiber characteristics were different depending on various factors, including breed (Ryu et al., 2008), selection (Larzul et al., 1999), gender (Ozawa et al., 2000), growth performance (Gondret et al., 2006), diet (Gotoh, 2003), and muscle location (Totland and Kryvi, 1991). Our previous studies also reported that FNP and FAP of muscle fiber types varied due to variations in intramuscular fat content in several major Hanwoo muscles (Hwang et al., 2010; Joo et al., 2017). According to Joo et al. (2013), muscle fiber characteristics and IMF content are influenced by various intrinsic and extrinsic factors including species and breed. In the present study, FNP and FAP of type I were lower in LL, while those of type IIA in LL were higher compared to other muscles. Also, SM had the highest FNP and FAP of type IIB among four muscles of KNBG. As the highest and lowest fat contents were observed in LL and SM, respectively (Table 1), it was suggested that compositions of muscle fiber type in KNBG muscles could be influenced by intramuscular fat content.
Fat content, meat color, and WBSF of the four muscles from KNBG are summarized in Table 1. There were significant (p<0.05) differences in fat contents among muscles. The highest fat content was observed in LL while SM had the lowest fat content. No significant differences (p>0.05) in fat content was observed between PM and GM. There were also significant (p<0.05) differences in color measurements among muscles. Especially, the highest a* value was observed in PM while SM had the lowest a* value. LL had the highest L* value while SM had the lowest L* value. WBSF was also significantly (p<0.05) different among four muscles. PM had the lowest WBSF, followed by LL, GM, and SM. According to our previous studies, these results of color and WBSF in KNBG were similar with that the investigated muscle fiber characteristics and meat quality traits of Hanwoo muscles (Hwang et al., 2010; Joo et al., 2017).
A-DMeans±SE with different superscripts in the same row are significantly different (p<0.05).
1)LL: Longissimus lumborum, PM: Psoas major, SM: Semimembranosus, GM: Gluteus medius
2)Warner-Bratzler Shear Force
Fatty acid compositions of four muscles from KNBG are summarized in Table 2. The proportions of saturated fatty acids (SFA) and monounsaturated fatty acids (MUFA) were significantly (p<0.05) different among four muscles due to differences in the majority of fatty acids such as oleic (C18:1) and palmitic (C16:0) acids. The oleic acid proportions of LL and GM were significantly (p<0.05) higher than those of PM and SM. PM had the highest palmitic acid proportion while the lowest proportion of palmitic acid was observed in LL. There were significant (p<0.05) differences in SFA and UFA proportions among four muscles. LL had the highest UFA proportion while PM had the highest SFA proportion. The proportions of MUFA were also significantly (p<0.05) different between muscles, whereas there were no significant (p>0.05) differences in the polyunsaturated fatty acids (PUFA) proportions among four muscles. LL had also the highest MUFA proportion while the lowest MUFA proportion was observed in PM. Consequently, the PUFA/SFA ratio was also significantly (p<0.05) different among four muscles, and the highest and lowest PUFA/SFA ratio were observed in PM and LL, respectively.
A-CMeans±SE with different superscripts in the same row are significantly different (p<0.05).
1)LL: Longissimus lumborum, PM: Psoas major, SM: Semimembranosus, GM: Gluteus medius
It has been known that Korean black goat including KNBG has a healthful fatty acid profile, so it is ideal for health conscious consumers (Choi et al., 2010; Kang et al., 2013; Kim et al., 2014). According to Webb et al. (2005), there are several considerations in the balance of fatty acids for beneficial effects to meat consumers needs: 1) there should be a high concentration of what are termed desirable fatty acids (DFA), which are C18:0 and UFA, 2) the PUFA/SFA ratio should be high (at least 0.45), 3) the n-6/n-3 ration should be less than five, and 4) PUFA should have a high content of CLA isomers. In the present study, DFA in KNBG meat ranged between 69.09% in PM and 72.48% in LL. These tended to be higher values compared to 67.45% for Omani goats (Mahgoub et al., 2002), 65.37 and 66.4% for Boer and South African indigenous goats (Tshabalala et al., 2003). Also, the PUFA/SFA ratios in the present study (ranged 0.26-0.32) were similar with Banskalieva et al. (2000) that ranged between 0.16 and 0.49 for goat meat, with a median of 0.32. In this regard, the fatty acid profile of KNBG has evaluated a salubrious fat. Especially, it was suggested that LL and PM might be better for healthful fat because of higher DFA value and PUFA/SFA ratio, respectively.
Results of correlations between muscle fiber characteristics, fat content, color measurements, WBSF and fatty acid composition are summarized in Table 3. Fat content was positively correlated with FNP and FAP of type IIA (r = 0.77 and 0.73, respectively) but negatively correlated with type IIB (r = −0.46). Lightness (L*) was positively correlated with type IIB while redness (a*) was negatively correlated with type IIB. Yellowness (b*) was negatively correlated with type I but had a positive correlation with type IIB. The SAF proportion had a positive correlation with FNP of type I (r = 0.65) but had a negative correlation with FNP of type IIA (r = −0.47), whereas the MUFA proportion had a negative correlation with type I (r = −0.68) but a positive correlation with type IIA (r = 0.58). Consequently, both FNP and FAP of type I had positive correlation with PUFA/SFA ratio whereas those of type IIB had a negative correlation.
*p<0.05, **p<0.01, ***p<0.001
1)Warner-Bratzler shear force
The present results clearly showed that the proportions of fatty acids were correlated with muscle fiber characteristics. However, the correlations in this study were different with our previous studies that investigated the relationship between muscle fiber type and fatty acid composition in Hanwoo muscles (Hwang et al., 2010; Joo et al., 2017). Fiber type I in Hanwoo muscles had a negative correlation with SAF proportion and positive correlation with MUFA proportion (Hwang et al., 2010). Also, positive correlation between type IIB and SFA was observed in Hanwoo muscles (Joo et al., 2017). These correlations were reversed in goat muscles, so that SFA proportion was positively correlated with FNP of type I and negatively correlated with type IIB. It is currently unclear whether these differences are due to species or sampling position in the muscle or carcass. This different relationship between cattle and goat muscles may be due to differences in muscle fiber characteristics in relation to energy metabolic and contractile properties (Joo et al., 2013). Further studies are needed to clarify these findings because current data on this topic are limited.


