Introduction
Prolonging desirable meat color is practically important for the meat industry, as the surface color of fresh meat is one of the most important aspects affecting consumers’ meat purchasing decisions (Kim and Hunt, 2011). Post-harvest processing and storage conditions, such as temperature, aging periods, display lighting source and/or packaging types, have significant impacts on meat surface color and color stability (Abd El-Rhman et al., 1998; Barbut, 2001; Djenane et al., 2001; Jakobsen and Bertelsen, 2000; Madhavi and Carpenter, 1993). Postmortem aging is a value-adding process of meat, as it results in an improvement in palatability characteristics, such as tenderness, flavor and/or juiciness (Feuz et al., 2004; Kim et al., 2016). While the extent of aging per se is positively associated with the eating quality attributes, a potentially adverse impact on oxidation stability (particularly color stability) has been reported (Barbut, 2001; Kim et al., 2011; Ma et al., 2016; Vitale et al., 2014).
The maintenance of a constant temperature during refrigeration storage is a vital in assuring quality and shelf life of fresh meat (Greer et al., 1994). In particular, it is well documented that elevated temperature during storage and/or display causes lipid oxidation and reduces metmyoglobin reducing activity, which consequentially leads to meat discoloration (Bekhit and Faustman, 2005; Choe et al., 2016; Jakobsen and Bertelsen, 2000; Mancini and Hunt, 2005; Renerre, 1990). O’Keeffe and Hood (1980) reported that two to 5-fold of rapid discoloration in beef muscles occurred when storage temperature increased from 0 to 10℃.
Despite the known importance of temperature control for fresh products and the advancement in refrigeration technology, several retail/consumer surveys revealed that it was not uncommon to find the temperature abuse over targeted and/or regulated range during retail storage/display of fresh products. According to Kennedy et al. (2005), 30% of cold foods were stored above 10℃ at retail and households in South European countries. Jol et al. (2006) noted that temperature abuse over 10℃ occurred in nearly 20% of household and commercial refrigerators in USA. In the case of Korea, a survey conducted by Lee et al. (2008) released that inner temperature of refrigerators at retail markets, department stores, and convenience stores varied from −2 to 22.9℃ (average temperature of 7℃).
Taken together the given information, it is practically important to understand how postmortem aging influences oxidation stabilities (particularly lipid oxidation and color stability) of beef muscles when coupled with temperature abusing condition during retail display. Therefore, the objective of this study was to evaluate the effects of short-term/extreme temperature abuse (STA) during simulated retail display on color characteristics and oxidative stability of two beef muscles aged for different periods. A relatively extreme condition as placing beef steak samples at 20℃ for 1 h was applied in the study in order to establish a preliminary understanding in the combined effects of postmortem aging and STA on oxidation stability of beef muscles.
Materials and Methods
At 7 d postmortem, M. longissimus lumborum (LL) and M. semitendinosus (ST) were removed from one side of three beef carcasses (approximately 16 mon). Each muscle was cut perpendicularly into four equal sections and randomly assigned to four different aging times (7, 14, 21, and 28 d). Each section, excluding 7 d aging, was individually vacuum-packaged using a vacuum machine (TC- 280, Promax Inc., USA), and stored in a 2℃ cooler for further aging. On the assigned aging time, each muscle section was removed from vacuum bags, and two steaks (approximately 2.5 cm each) were cut from each section. Each steak was placed on Styrofoam and wrapped with a commercial oxygen-permeable polyvinylchloride (PVC) film (Cling Wrap, Glad®, USA).
The PVC-wrapped samples were placed in a 2.5℃ cooler for 7 d under continuous fluorescent natural white light (approximately 1,450 lx, color temperature = 3,500 K). The intensity of illumination was measured using a light meter (Testo 545, Testo, Germany), and the color temperature was provided from the manufacturer (OCTRON® T8 Lamps, Osram, USA). The STA was induced by placing the displayed samples at 20℃ for 1 h on 4 d of display. Immediately after, the steak samples were placed back to the previous display condition and were further displayed until a total of 7 d. Instrumental and visual color evaluations were conducted on 1, 4 (before STA), and 7 d of display, and all chemical analyses for oxidative stability were performed on 1 and 7 d.
Surface color of beef muscles was determined using a Hunter MiniScan EZ colorimeter (Model 4500L, Hunter Associates Laboratory Inc., USA) equipped with a 25 mm (diameter) measuring. The setting for illuminant and observer was A/10°, respectively. CIE L*, a* and b* values were recorded from three random locations on the surface of beef muscles (a total of 9 readings per treatment). Hue angle value was calculated as follows; hue angle = tan−1 (b*/a*) (AMSA, 2012).
Visual color of beef muscles was evaluated by trained sensory color panelists between ages 20 and 40 (n=8), who had previously passed the Farnsworth-Munsell 100 Hue Test and trained and participated multiple times for similar fresh meat color trials. The scoring scale of lean color was 8 points (1 = extremely dark red, 2 = dark red, 3 = moderately dark red, 4 = slightly dark red, 5 = slightly bright red, 6 = moderately bright red, 7 = bright red, 8 = extremely bright red), and that of discoloration was 7 points (1 = no discoloration, 0%), 2 = slight discoloration (1-19%), 3 = small discoloration (20-39%), 4 = modest discoloration (40-59%), 5 = moderate discoloration (60- 79%), 6 = extensive discoloration (80-99%), 7 = total discoloration (100%) in accordance with the meat color guidelines (AMSA, 2012).
FRC was determined in duplicate by following the method of Kanner et al. (1991) described by Min et al. (2008). Five grams of beef muscle were homogenized with 15 mL distilled water (DW) using an Ultra Turrax (Ultra-Turrax T25, Janke & Kunkel IKA-Labortechnik, Germany) at 10,000 rpm for 15 s. One milliliter of the homogenate was mixed with 1 mL of 1 mM ferric chloride and vortexed occasionally for 10 min. One milliliter of 11.3% trichloroacetic acid (TCA) solution was added into the mixture and centrifuged at 10,000 g for 10 min. Two milliliters of the supernatant were mixed with 0.8 mL of 10% ammonium acetate and 0.2 mL of ferrozine solution (6.1 mM ferrozine color reagent in 0.14 N HCl). After standing at a room temperature (20℃) for 10 min, the absorbance of the supernatant was measured at 562 nm using a spectrophotometer (Epoch Microplate Spectrophotometer, Biotek Instruments Inc., USA). FRC was expressed as μg ascorbic acid equivalent/g muscle, based on a standard curve prepared with 1.25-20 μg/mL of ascorbic acid solution.
Lipid oxidation was determined in duplicate by 2-thiobarbituric reactive substances (TBARS) assay described by Buege and Aust (1978). Five grams of beef muscle were homogenized with 15 mL DW and 50 μL of 10% butylated hydroxyl anisole (BHA) solution in 90% ethanol for 30 s using an Ultra Turrax at 6,000 rpm. One milliliter of the homogenate was mixed with 2 mL of 20 mM 2-thiobarbituric acid (TBA) solution in 15% TCA solution. The mixture was heated for 15 min in a water bath (80℃) and cooled for 10 min in ice water. The cooled mixture was centrifuged at 2,000 g for 10 min and filtered through filter paper (Whatman No. 4). The supernatant was placed on 96-well plate; and the absorbance was measured at 538 nm using the microplate spectrophotometer. A blank was prepared with 2 mL of DW and 4 mL of TBA/TCA solution. TBARS value was expressed as mg MDA/kg muscle by multiplying the absorbance at 538 nm by a factor of 5.54.
The experimental design of this study was split-split plot design. Whole plot was muscle type effect (LL and ST), the sub-plot was for the aging time effect (7, 14, 21, and 28 d), and the sub-sub plot was for the display time effect (1, 4, and 7 d for color evaluation; 1 and 7 d for oxidative stability). All data were analyzed using the PROC MIXED procedure of SAS 9.4 software (SAS, 2012). Animal was considered random effect. Least squares means for all traits were separated (F test, p<0.05) by using least significant differences.
Results and Discussion
Significance of three main effects, muscle type (M), aging time (A) and display time (D), and their interactions on color characteristics and oxidative stability is presented in Table 1. In this current study, no significant threeway interactions among the main effects (M × A × D) on any of attributes were found.
Ap value: NS, non-significance; *p<0.05, **p<0.01, ***p<0.001.
BFRC: ferric ion reducing capacity assay.
CTBARS: 2-thiobarbituric acid reactive substances assay.
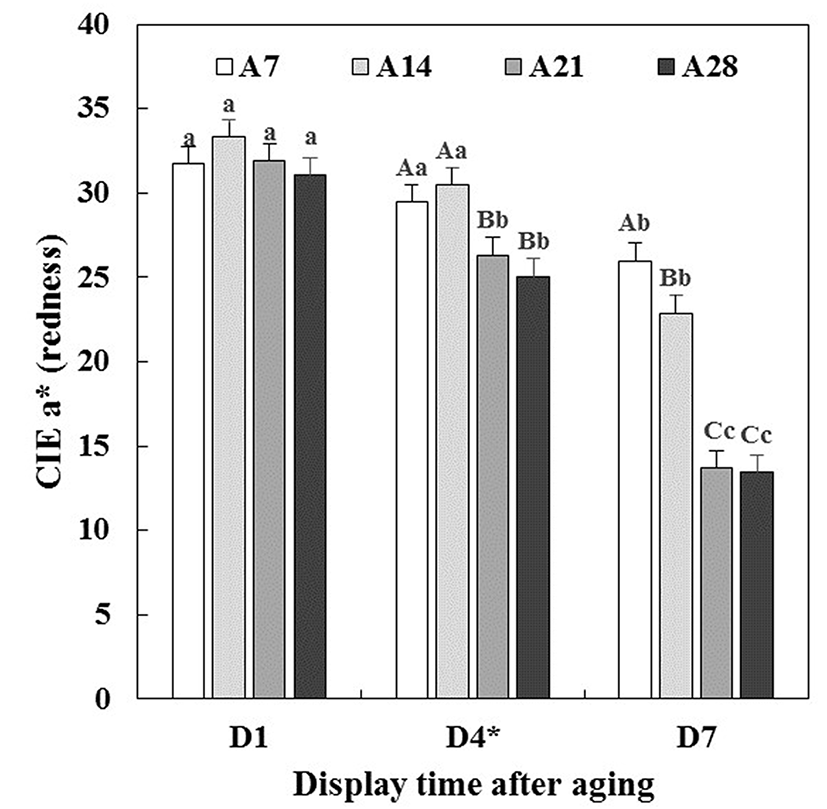
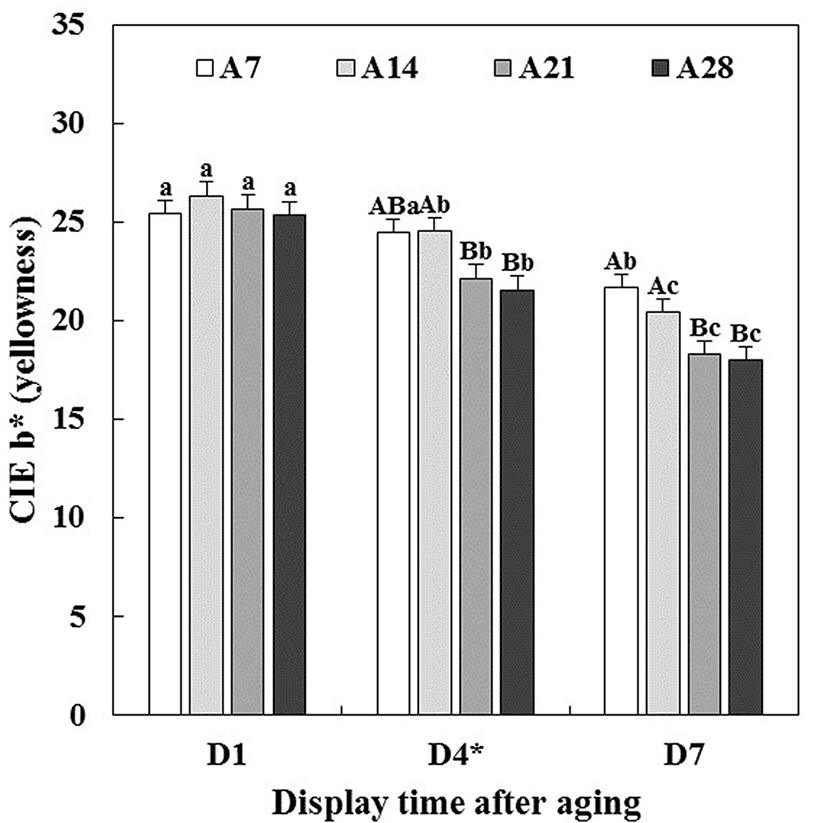
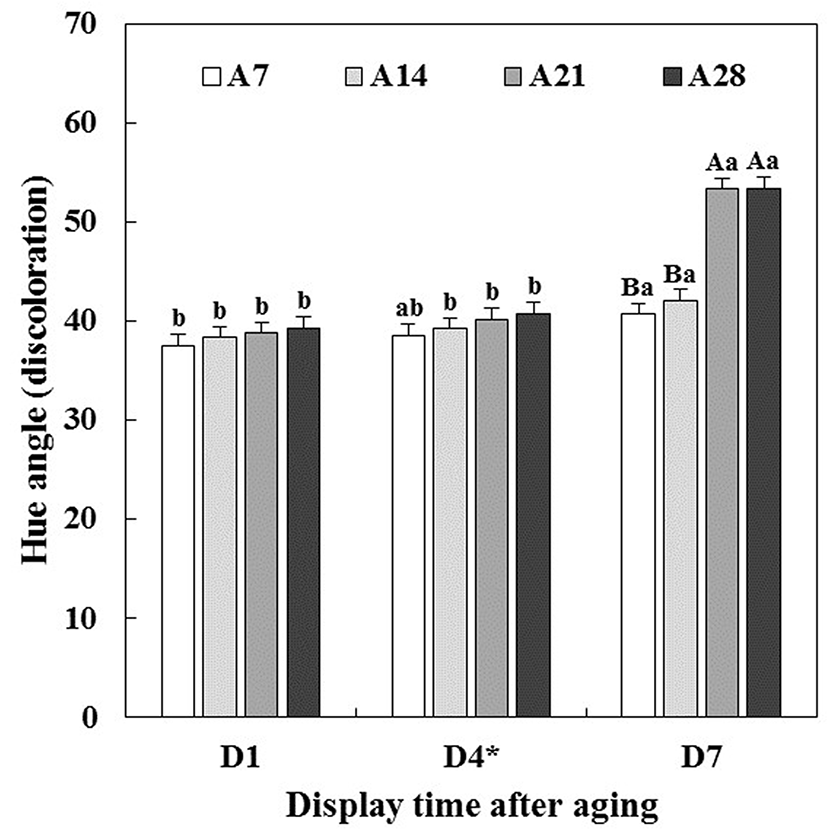
Changes in CIE L* (lightness), CIE a* (redness), CIE b* (yellowness) and hue angle (discoloration) of aged beef muscles were evaluated during 7 d of simulated retail display including short-term/temperature abuse (STA) on the 4th d of display.
Lightness of beef muscles was only affected by aging time (p<0.05, Table 1), which indicated that the lightness increased with increasing aging time (data not shown). This result was in agreement with previous studies reported by Boakye and Mittal (1996), Gašperlin et al. (2001) and Kim et al. (2011). As seen in Table 1, there were significant interactions between aging time and display time (A × D) on redness (p<0.001), yellowness (p<0.01) and hue angle (p<0.001). Initially, all beef muscles showed similar redness (Fig. 1), yellowness (Fig. 2) and hue angle (Fig. 3), regardless of aging time before display (p>0.05). However, on 7 d of display after STA, the redness of beef muscles aged for 21 and 28 d (A21 and A28) rapidly decreased (p<0.05), and were significantly lower than those aged for 7 and 14 d (A7 and A14). Recently, Pouzo et al. (2016) also reported that extended aging time resulted in a sharp decrease in redness of beef muscle during display. Similar trend for a decrease in yellowness was observed. Regarding the muscle type effect on hue angle, ST muscle (43.15) exhibited a significantly higher hue angle than LL muscle (40.62) (data not shown), which implies that LL was more color stable during aging and/or display periods compared to ST. Reflecting greater changes in redness, A21 (53.33) and A28 (53.39) beef muscles exhibited significantly higher hue angle than A7 (40.68) and A14 (42.06) beef muscles on 7 d of display.
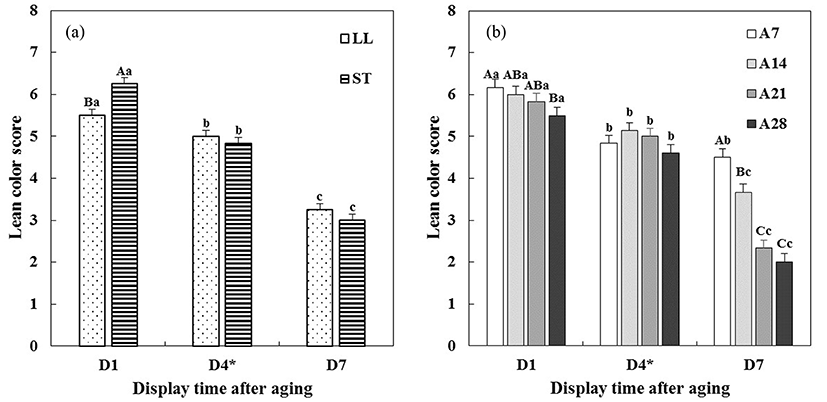
Changes in visual lean color and discoloration scores of aged beef muscles during 7 d of display are presented in Fig. 4 and 5, respectively. Significant interactions, muscle type × display time (M × D, p<0.001) and aging time × display time (A × D, p<0.001), on visual lean color score were found (Table 1). Between muscle types (Fig. 4a), initially, ST muscle exhibited a significantly higher lean color score than LL muscle. However, such difference in lean color score between two muscles was not observed on 4 and 7 d of display (p>0.05). As a similar result, Seyfert et al. (2006) reported that ST muscle exhibited more bright red color than LL muscle only at the initial display time. Initial differences in lean color score due to different aging times were numerically small, although there was a significant difference between A7 and A28 beef muscles (Fig. 4b). On 7 d of display after STA, steaks from A21 and A28 beef muscles had obviously lower lean color scores than steaks from A7 beef muscle (p<0.05).
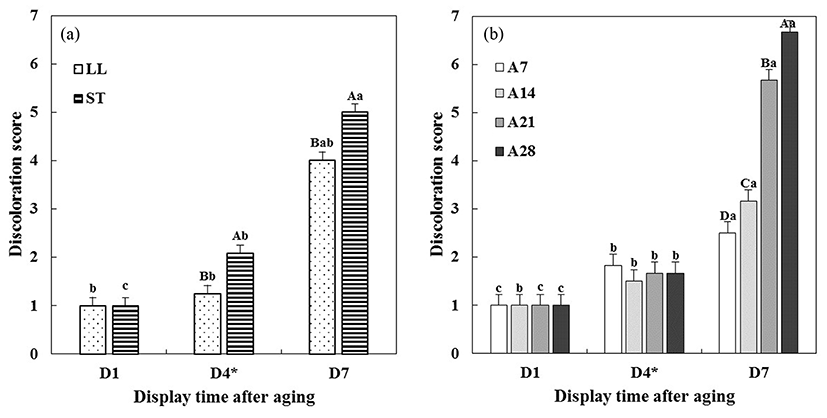
Visual discoloration score of aged beef muscles was also affected by muscle type × display time (M × D, p<0.01) and aging time × display time (A × D, p<0.001) interactions (Table 1). The discoloration score of two beef muscles was similar (1 point, no discoloration) on 1 d of display (p>0.05, Fig. 5a). Although there was no muscle type × display time (M × D) interaction on redness and hue angle, ST muscle was more rapidly discolored from 4 d of display when compared to LL muscle (p<0.05). This finding was consistent with the result of hue angle in this study. Similarly, according to McKenna et al. (2005), ST muscle was more rapidly discolored than LL muscles, even if both LL and ST muscles are involved in a high color stable muscle group. In addition, Seyfert et al. (2006) reported that LL muscle was more color table than ST muscle, and suggested that the different color stability in beef muscles could be associated with the proportion between α-white fiber (glycolytic muscle fiber) and β-fiber (oxidative muscle fiber). Regarding aging time × display time (A × D) interaction, until 4 d of display, there were no significant differences in discoloration score between beef muscles with different aging time (Fig. 5b). On 7 d of display after STA, the discoloration scores of beef muscles were as follows; 7 d (color stable) < 14 d < 21 d < 28 d (color unstable). Overall, based on the obtained results that there were no significant differences in hue angle and visual discoloration score until 4 d of display before STA, regardless of aging time before display. Our finding implies that discoloration of beef muscles aged over 21 d might be more affected by STA during simulated retail display compared to beef muscles aged for 7 d and 14 d.
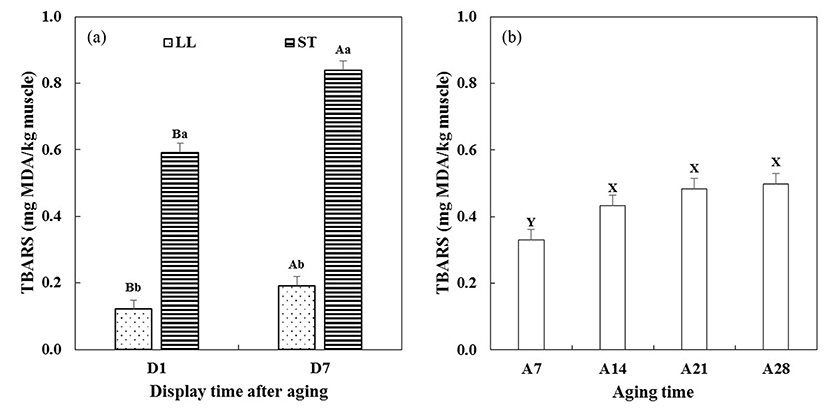
Changes in ferric ion reducing capacity (FRC) and 2-thiobarbituric acid reactive substances (TBARS) of aged beef muscles on 1 and 7 d (after STA) of simulated retail display were measured (Fig. 6 and 7, respectively). Significant interactions between aging time × display time (A × D) on FRC (p<0.01) and TBARS (p<0.001) were found (Table 1).
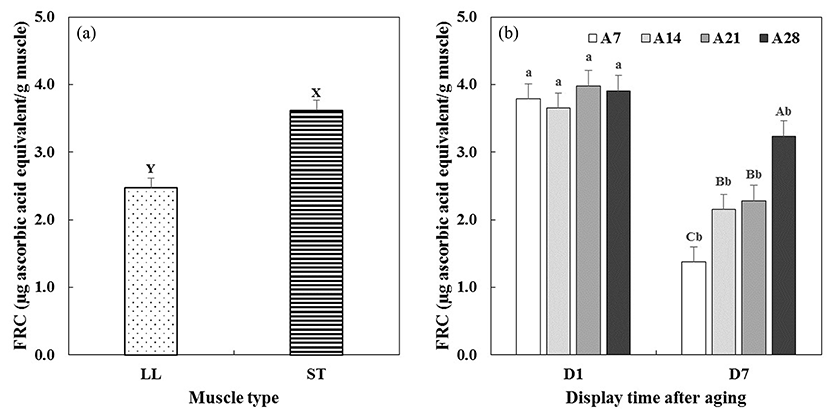
FRC assay is fundamentally based on the activity of antioxidants responsible for ferric reducing to ferrous ion (Min et al., 2008). Between two beef muscles (Fig. 6a), ST muscle (3.62 μg ascorbic acid/g muscle) exhibited a significantly higher FRC value than LL muscle (2.47 μg ascorbic acid/g muscle). In Fig. 6b, the initial FRC values of aged beef muscles were similar (3.65-3.98 μg ascorbic acid/g muscle), regardless of aging time before display (p>0.05). On 7 d of display after STA, FRC values of all aged beef muscles significantly decreased compared to those on 1 d of display. A similar trend was previously reported by Min et al. (2008) showing that FRC value of beef loin muscle was reduced from 7.03 to 4.43 μg ascorbic acid/g muscle during 7 d of storage. Pouzo et al. (2016) also reported that increases in both aging and display times decreased ferric reducing ability of beef muscle. However, interestingly, the given results of FRC values in the current study did not completely align with the observed color stability of beef muscles. As discussed above, much higher FRC values were observed in ST than LL, and A28 than A7, A14, and A21, while LL was more color stable compared to ST, and color stability was inversely affected by aging. Endogenous metmyoglobin reducing activity, which is primarily responsible for prolonging desirable red color of meat during storage and display, can be influenced by several intrinsic factors, such as pH, muscle type, pro/antioxidants, and mitochondrial enzyme activity (Mancini and Hunt, 2005). Therefore, the result of FRC value alone in the current study would not be able to fully explain the observed discoloration of aged muscles during display. Further studies determining the actual relevance of the FRC assay to color stability (or myoglobin redox capacity) would be beneficial to advance our understanding in FRC and its impacts on meat color stability.
Initially, ST muscle showed a significantly higher TBARS value than LL muscle (Fig. 7a). On 7 d of display after STA, the significant difference in TBARS value between two beef muscles was still observed. Greater lipid oxidation accumulation of LL muscle than ST muscle during display was also reported by McKenna et al. (2005). The TBARS value of aged beef muscles increased with increasing aging time (Fig. 7b). Particularly, higher TBARS values of A14, A21 and A28 were found compared to A7 (p<0.05). As similar results, Pouzo et al. (2016) reported the interaction between aging time (3, 14, and 56 d) and display time (0 and 5 d) on TBARS value, which showed that an increase in aging time accelerated lipid oxidation during display. Vitale et al. (2014) noted that TBARS value of beef muscle aged for 21 d was higher than those aged for 0-14 d during 9 d of display. Ismail et al. (2008) reported that an increase in aging time from 7 to 21 d increased TBARS value of beef muscles, from 0.55 to 1.20 mg MDA/kg meat. In addition, Kim et al. (2011) reported increased TBARS value with increasing aging time during whole display time for 8 d. In this study, there was no interaction between aging time and display time on TBARS value, which implies that the accelerated lipid oxidation during aging might override oxidative changes due to STA during further display time. In general, skeletal muscle has several biological defense systems against oxidative stress, by non-enzymatic antioxidant compounds and antioxidant enzymes, which contribute to prevention of lipid oxidation in meat and meat products (Decker et al., 2000). However, previous studies have reported that meat aging caused the depletion of antioxidant vitamins (Descalzo et al., 2008) and/or the decrease in activity of antioxidant enzymes (Renerre et al., 1996). Thus, the observed accumulation of lipid oxidation of beef muscles during display might be attributed to the decreased antioxidant activity with beef muscles with extended aging. Furthermore, our current study showed the relationship between color stability and lipid oxidation of long-term aged beef muscle, which was in agreement with previous suggestion that myoglobin and lipid oxidations in muscle could be potentially involved in coupling mechanisms (Faustman et al., 2010).
In conclusion, an increase in postmortem aging time had no influence upon initial color characteristics, but caused greater extents of lipid oxidation. Short-term/extreme temperature abuse during simulated retail display resulted in a rapid discoloration on long-term aged beef muscles over 21 d. In addition, ST muscle, which showed high level of lipid oxidation, was more rapidly discolored compared to LL muscle. Our results indicate that color and oxidative stabilities of aged beef muscles under temperature abuse could be differently affected by muscle type and aging time. Therefore, the results of this current study suggest that beef with extended aging should be handled with a careful cold-chain control in order to prevent oxidation related quality defects during the retail sale and distribution process. Further studies looking into more detailed regimes of temperature abusing conditions combined with various aging periods of beef muscles would be warranted to develop practical quality control strategies for different muscle types with long-term aging.


