SHORT COMMUNCATION

Residual Level, Histology, and Blood Biochemistry of Tebuconazole: A Repeated Dose 28-Day Oral Toxicity Study in Pigs

Jin Young Jeong1,*https://orcid.org/0000-0002-8670-7036, Minji Kim1https://orcid.org/0000-0003-2106-1921, Seol Hwa Park1https://orcid.org/0000-0002-7218-8212, Byeonghyeon Kim1https://orcid.org/0000-0003-4651-6857, Sang-Ik Oh2https://orcid.org/0000-0003-0877-9170, Eunju Kim2https://orcid.org/0000-0003-4040-0474, Hyunjung Jung1https://orcid.org/0000-0002-7004-2017
Author Information & Copyright
1Animal Nutrition & Physiology Division, National Institute of Animal Science, Rural Development Administration, Wanju 55365, Korea
2Division of Animal Disease & Health, National Institute of Animal Science, Rural Development Administration, Wanju 55365, Korea
*Corresponding author: Jin Young Jeong, Animal Nutrition & Physiology Division, National Institute of Animal Science, Rural Development Administration, Wanju 55365, Korea, Tel: +82-63-238-7487, Fax: +82-63-238-7497, E-mail: jeong73@korea.kr

© Korean Society for Food Science of Animal Resources. This is an Open-Access article distributed under the terms of the Creative Commons Attribution Non-Commercial License (http://creativecommons.org/licenses/by-nc/3.0) which permits unrestricted non-commercial use, distribution, and reproduction in any medium, provided the original work is properly cited.

Received: Apr 29, 2022 ; Revised: Jun 08, 2022 ; Accepted: Jun 09, 2022

Published Online: Jul 01, 2022

Abstract

In this study, we investigated the residual properties of tebuconazole-treated pigs. Twentypigs were treated with different concentrations (0.25, 1.25, 2.5, 12.5, and 25 mg/kg bw/d) of tebuconazole for 28 d. Blood biochemistry, histology, and residual levels were analyzed using the VetTest analyzer, Masson’s trichrome staining kit, and liquid chromatography-mass spectrometry, respectively. The final body weights were not significantly different between the control and treatment groups. Alkaline phosphatase, blood urea nitrogen, cholesterol, and gamma-glutamyl transpeptidase levels were significantly different from those of the control after exposure for 14 d. However, alanine aminotransferase levels showed changes only after exposure to pesticides for 28 d. The biochemical parameters were separated during the experimental period (14 d versus 28 d) by principal component analysis. Based on variable importance plots, blood urea nitrogen/creatinine ratio, blood urea nitrogen, glucose, and gamma-glutamyl transpeptidase are candidate biomarkers for tebuconazole exposure. The residual levels were observed at T4 (12.5 mg/kg bw/d) and T5 (25 mg/kg bw/d) in the liver and fat tissues, respectively. Fibrosis increased in the liver, kidney, and fat tissues, depending on the tebuconazole concentration. In conclusion, the residue limits of tebuconazole and the physiological changes caused by dietary tebuconazole in pigs provide important information for establishing maximum residue limits of pork and pork products.

Keywords: pig; tebuconazole; biochemistry; residue levels; fibrosis

Introduction

Pesticides, consisting of single or multiple components, are used to increase agricultural product yield and quality by preventing and eradicating diseases (Aktar et al., 2009; Eddleston et al., 2008; Yan et al., 2018). Depending on the type of pest, activity site, and purpose, pesticides are classified as fungicides, herbicides, insecticides, or rodenticides. Biological or chemical pesticides affect the growth of living organisms and cause neurological, respiratory, skin, and pathological problems due to adverse effects or unwanted reactions (Azaroff and Neas, 1999; Hoppin et al., 2002). Therefore, safety regulations on the maximum pesticide residue levels in food or feed have been established worldwide (Handford et al., 2015; Jeong et al., 2018).

Fungicides are agents that protect against unwanted diseases caused by fungi. Flutriafol, propiconazole, and tebuconazole are common triazole fungicides used in agricultural products and forage crops (Toda et al., 2021). Tebuconazole [1-(4-chlorophenyl)-4,4-dimethyl-3-(1H-1,2,4-triazol-1-ylmethyl)-3-pentanol] is particularly effective against various foliar diseases in cereals, including wheat, barley, oats, and rye, and is registered for the control of leaf blight, leaf spot, and anthracnose diseases. Tebuconazole is used for the therapeutic and prophylactic control of diseased plants. It is a demethylation inhibitor that affects the cell wall of the fungus by inhibiting spore germination and mold growth, thereby interfering with the production of ergosterol (Duanis‐Assaf et al., 2022; Hu et al., 2019).

Pesticide residues are harmful to the growth and health of animals and plants (Chandra et al., 2021; Damalas and Eleftherohorinos, 2011). Chronic pesticide exposure can cause fibrosis in human and animal tissues (Jeong et al., 2021; Jeong et al., 2022; Park et al., 2021), thereby impairing the functioning of their organs. We assumed that tebuconazole fungicides can cause fibrosis in pigs. However, little is known about the effects of tebuconazole on pig tissues. Therefore, this study investigated the effects of tebuconazole residues on pork and pork products.

Materials and Methods

Animals and sample preparation

The pigs were purchased from the Taehung (Iksan, Korea). Twenty castrated male pigs (Landrace×Yorkshire, BW: 63.3±1.3 kg) were housed in separate pens (pen sizes: 2.1 m×1.4 m). The animals were divided into six groups according to the tebuconazole concentrations per BW: control (0 mg/kg bw/d; n=3), T1 (0.25 mg/kg bw/d; n=3), T2 (1.25 mg/kg bw/d; n=3), T3 (2.5 mg/kg bw/d; n=3), T4 (12.5 mg/kg bw/d; n=3), and T5 (25 mg/kg bw/d; n=3). Although some dose such as research papers on the pig residue test were collected, the purpose of this study was to investigate the residual based on the maximum daily intake. Therefore, the treatment levels were determined with the data detected above the quantitation limits (1–3). In pigs, tebuconazole dose selection was based on intake ratio, feed intake amount, dry matter weight, maximum residual amount, and maximum exposure (FAO and WHO, 2010; Li et al., 2017; Schmidt et al., 2016). Housing conditions were maintained as described previously (Jeong et al., 2021). Briefly, the light cycle, relative humidity, and temperature during the experimental period were 12 h, 55±5%, and 22±2°C, respectively. Diet and water were provided ad libitum, according to the Korean feeding standards for pigs. The animals were exposed to tebuconazole twice daily (09:00–10:00 am, 15:00–16:00 pm) for 4 wks. Blood samples were collected at 14 d and 28 d after tebuconazole exposure. After anesthesia and exsanguination, the pig tissues were quickly removed and immediately frozen in liquid nitrogen. The tissues were fixed in 10% neutral buffered formalin (NBF; Sigma-Aldrich) for histological analysis.

Blood biochemistry

Blood samples were obtained from the jugular vein using a Vacutainer tube. The serum was centrifuged at 700×g for 20 min at 4°C and stored at −80°C. Total parameters, such as glucose (GLU), creatinine (CREA), blood urea nitrogen (BUN), blood urea nitrogen/creatinine ratio (BUN/CREA), phosphate (PHOS), calcium (CA), total protein (TP), albumin (ALB), globulin (GLOB), albumin/globulin ratio (ALB/GLOB), alanine aminotransferase (ALT), alkaline phosphatase (ALKP), gamma-glutamyl transpeptidase (GGT), total bilirubin (TBIL), cholesterol (CHOL), amylase (AMYL), and lipase (LIPA), were assessed according to the manufacturer’s protocol using a VetTest chemistry analyzer (IDEXX, Westbrook, ME, USA).

Pesticide residue analysis

Tissue (2 g) and blood (2 mL) were mixed with distilled water (10 mL) for 10 min in a mixture of acetonitrile (20 mL) and sodium chloride (5 g) to quantify tebuconazole. The mixed samples were stirred for 10 s and shaken for 60 min. The tissue and blood extracts were centrifuged at 2,200×g for 5 min. The untreated and tebuconazole-treated samples (5 μL) were injected into a liquid chromatography-tandem mass spectrometer (QTRAP 4500 LC-MS/MS system, SCIEX, Framingham, MA, USA). After injection, the tebuconazole residue levels were estimated using the peak area. The limit of quantification was below 0.02 mg/kg. The conditions used were as described previously (Jeong et al., 2021).

Histological analysis

The tissue samples fixed with 10% NBF were sequentially dehydrated using ethanol and xylene as follows: The tissues were embedded in paraffin, cut at 5 μm thickness, mounted, and placed on a hot plate at 40°C for 1 h. The slide sections were dewaxed with xylene, rehydrated with EtOH, and rinsed in tap water for 1 min. Histological connective tissues were stained using a trichrome stain kit (ab150686, Abcam, Cambridge, UK), according to the manufacturer’s instructions. The slices were observed using a microscope (under 200× magnification).

Statistical analysis

All data were analyzed through one-way ANOVA with Tukey’s multiple comparison post-hoc test using GraphPad Prism (ver. 9, GraphPad Software, San Diego, CA, USA). The results are presented as mean±SEM. In this study, p<0.05 among all groups reflected statistical significance.

Results and Discussion

Growth performance of tebuconazole-treated pigs

The final BW, average daily feed intake, and average daily weight gain were not significantly different between the control and treatment groups (Table 1). Thus, tebuconazole treatment at different concentrations for 28 d did not affect the growth performance of pigs. These results are similar to those of other previous studies (Jeong et al., 2021; Jeong et al., 2022; Lopez-Antia et al., 2021). Propiconazole and flutriafol were not significantly different between control and the treatment groups in pigs and chicks. However, in rats treated with similar concentrations of tebaconazole, the physical condition deteriorated and the growth ratio decreased (Ben Saad et al., 2020), whereas the liver weight and liver/body weight ratio increased (Ku et al., 2021).

Table 1. Effects of tebuconazole exposure on growth performance in finishing pigs
Control T1 (×1) T2 (×5) T3 (×10) T4 (×50) T5 (×100) SEM p-value
Initial BW (kg) 66.63 66.83 67.13 67.53 67.98 67.90 3.50 ns
Final BW (kg) 87.10 97.10 91.57 87.07 90.40 91.10 3.22 ns
ADG (kg/d) 0.73 0.86 0.87 0.77 0.80 0.83 0.04 ns
ADFI (kg/d) 2.24 2.25 2.25 2.25 2.24 2.25 0.01 ns
FCR (kg/kg) 3.10 2.60 2.60 2.90 2.80 2.70 0.14 ns

Values are mean (n=20).

T1=0.25, T2=1.25, T3=2.5, T4=12.5, and T5=25 mg/kg bw/d.

BW, body weight; ADG, average daily weight gain; ADFI, average daily feed intake; FCR, feed conversion ratio; ns, not significant.

Download Excel Table
Biochemical analysis

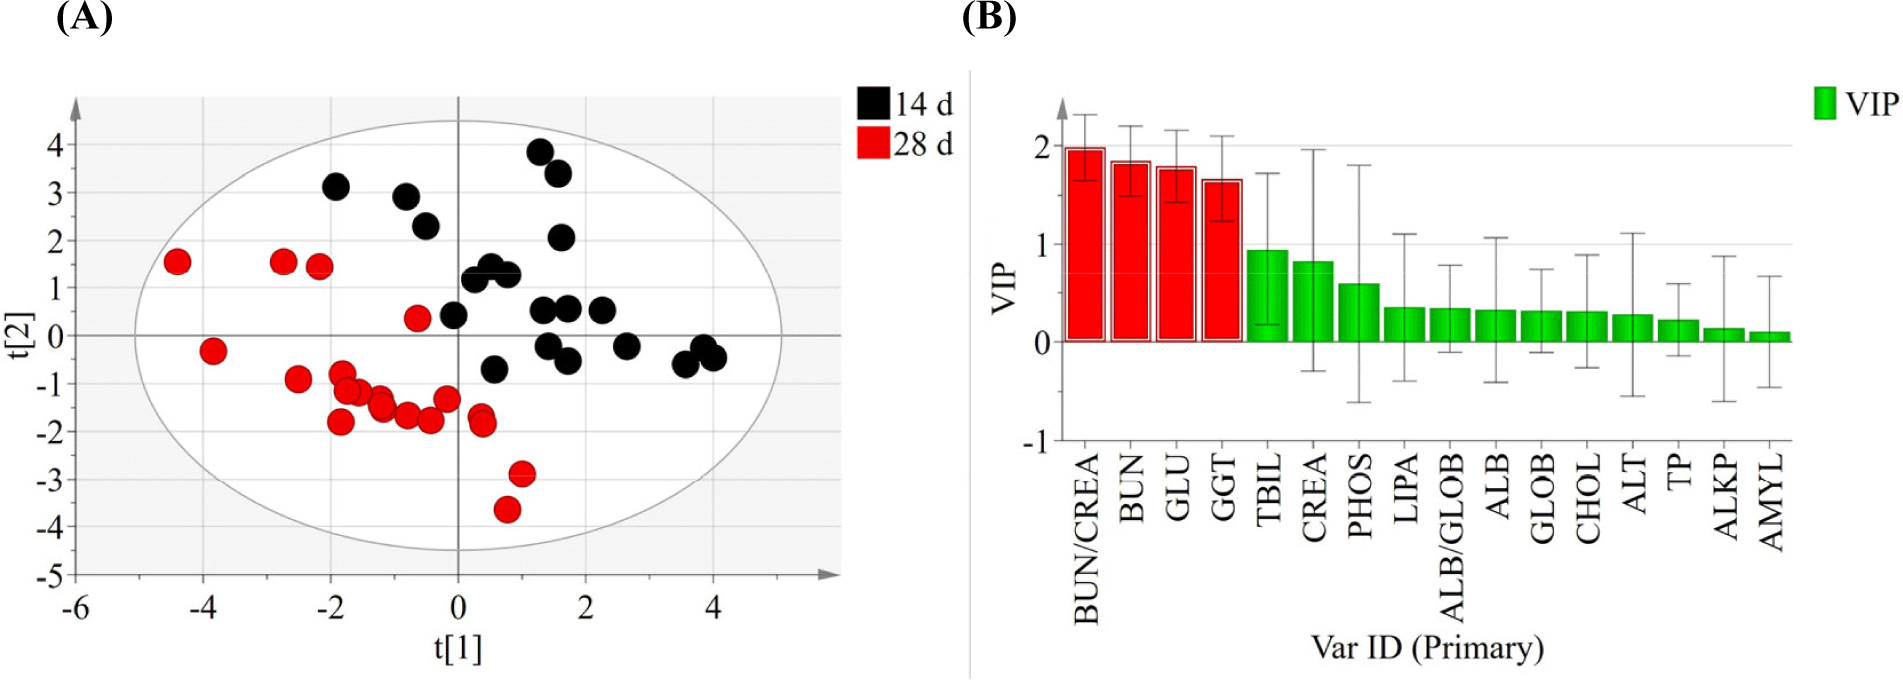
Effect of tebuconazole exposure on the biochemical properties of pig serum were analyzed at 14 d (Table 2) and 28 d (Table 3). After treatment for 14 d, BUN, GGT, and CHOL levels were higher in the high-dose group than in the control group (p<0.05). However, ALKP levels were significantly lower in the T2 treatment group (p<0.05). After treatment for 28 d, most biochemical parameters, except ALT, were not significantly different among the groups. ALT levels were significantly different in the tebuconazole-treated pigs (p<0.05). The principal component analysis plot showed a difference between the samples collected at 14 d and 28 d (Fig. 1A). The scores for BUN/CREA ratio (VIPs=1.98), BUN (VIPs=1.85), GLU (VIPs=1.79), and GGT (VIPs=1.67) levels were high when separating groups based on the variable importance plots calculated by partial least squares discriminant analysis (Fig. 1B).

Table 2. Changes of blood biochemical characteristics by pigs exposed to tebuconazole for 14 days
Parameters Control T1 (×1) T2 (×5) T3 (×10) T4 (×50) T5 (×100) p-value
GLU (mg/dL) 100.7±2.73 108.3±1.33 102.0±0.58 105.0±4.90 112.8±4.37 108.5±6.00 0.3813
CREA (mg/dL) 0.77±0.03 0.77±0.03 0.73±0.03 0.77±0.03 0.85±0.03 0.85±0.03 0.0751
BUN (mg/dL) 17.33±0.67b 19.67±2.03b 18.00±0.58b 21.00±1.00b 19.75±2.29b 26.25±1.49a 0.0157
BUN/CREA 23.00±1.73 26.00±3.79 24.67±1.86 27.67±2.03 23.00±1.96 31.00±1.29 0.1011
PHOS (mg/dL) 7.03±0.41 7.50±0.12 7.07±0.20 7.10±0.06 7.20±0.23 7.63±0.18 0.3349
CA (mg/dL) 1.00±0.00 1.00±0.00 1.00±0.00 1.00±0.00 0.03±0.03 1.03±0.03 0.7290
TP (g/dL) 7.77±0.23 7.43±0.06 7.26±0.27 7.67±0.20 7.60±0.15 7.88±0.17 0.2925
ALB (g/dL) 4.30±0.12 4.33±0.13 4.33±0.08 4.10±0.15 4.32±0.12 4.27±0.11 0.7792
GLOB (g/dL) 3.46±0.26 3.10±0.20 2.93±0.20 3.56±0.24 3.27±0.14 3.60±0.24 0.2695
ALB/GLOB 1.26±0.08 1.43±0.13 1.50±0.10 1.20±0.11 1.32±0.07 1.22±0.13 0.4026
ALT (U/L) 79.67±5.89 71.00±4.58 71.00±8.14 83.00±4.72 80.25±8.66 80.50±2.06 0.6667
ALKP (U/L) 23.00±2.51a 24.33±2.33a 11.67±0.66b 13.00±3.00b 14.00±1.08b 14.50±2.10b 0.0023
GGT (U/L) 57.67±3.93b 62.67±9.35b 68.67±7.83b 86.00±7.37b 114.5±10.97a 102.8±7.87a 0.0014
TBIL (mg/dL) 0.23±0.03 0.20±0.00 0.23±0.08 0.23±0.03 0.22±0.02 0.25±0.02 0.9723
CHOL (mg/dL) 92.33±3.84b 89.33±2.18b 93.33±3.18b 91.00±3.51b 91.25±2.65b 105.3±1.18a 0.0075
AMYL (U/L) 362.0±86.61 490.7±65.84 458.7±87.22 319.7±108.10 434±108.70 437.8±78.12 0.8198
LIPA (U/L) 10.00±0.00 12.00±2.00 24.00±14.00 10.00±0.00 10.00±0.00 10.00±0.00 0.3889

Values are mean±SEM (n=20).

T1=0.25, T2=1.25, T3=2.5, T4=12.5, and T5=25 mg/kg bw/d.

All traits in the table were analyzed by one-way ANOVA with Tukey’s multiple comparison test.

a,b Values with different letters differ significantly (p<0.05).

GLU, glucose; CREA, creatinine; BUN, blood urea nitrogen; PHOS, phosphate; CA, calcium; TP, total protein (TP=ALB+GLOB); ALB, albumin; GLOB, globulin; ALT, alanine aminotransferase; ALKP, alkalinephosphatase; GGT, gamma glutamyl transpeptidase; TBIL, total bilirubin; CHOL, cholesterol; AMYL, amylase; LIPA, lipase.

Download Excel Table
Table 3. Changes of blood biochemical characteristics by pigs exposed to tebuconazole for 28 days
Parameters Control T1 (×1) T2 (×5) T3 (×10) T4 (×50) T5 (×100) p-value
GLU (mg/dL) 82.67±7.84 89.67±6.39 87.00±2.08 84.67±0.88 94.50±3.48 88.25±3.47 0.5101
CREA (mg/dL) 0.80±0.00 0.83±0.03 0.90±0.00 0.80±0.06 0.88±0.12 0.95±0.07 0.5425
BUN (mg/dL) 12.67±0.88 12.67±1.67 12.67±1.20 12.00±0.58 12.25±1.18 13.50±1.32 0.9603
BUN/CREA 16.00±1.15 15.33±2.40 14.00±1.53 15.00±0.58 14.25±0.95 14.25±1.43 0.9136
PHOS (mg/dL) 7.37±0.24 7.53±0.29 7.53±0.23 6.93±0.13 7.60±0.44 7.90±0.07 0.3134
CA (mg/dL) 1.00±0.00 1.00±0.00 1.00±0.00 1.00±0.00 1.00±0.00 1.00±0.00 1.000
TP (g/dL) 7.77±0.09 7.23±0.22 7.43±0.20 7.97±0.12 7.48±0.27 7.48±0.12 0.1658
ALB (g/dL) 4.37±0.12 4.23±0.12 4.47±0.03 4.30±0.10 4.18±0.06 4.42±0.09 0.2301
GLOB (g/dL) 3.40±0.10 3.00±0.31 2.97±0.18 3.67±0.20 3.30±0.27 3.35±0.19 0.3444
ALB/GLOB 1.30±0.06 1.43±0.19 1.53±0.07 1.20±0.10 1.28±0.12 1.33±0.11 0.4641
ALT (U/L) 80.00±1.73a 68.33±3.71b 71.67±2.91b 82.67±6.23a 83.75±6.66a 91.50±3.52a 0.0390
ALKP (U/L) 16.67±6.67 16.00±4.16 39.33±29.33 10.00±0.00 10.00±0.00 10.00±0.00 0.4393
GGT (U/L) 28.67±9.53 32.67±8.88 49.67±18.89 36.67±7.88 31.75±4.96 34.25±6.62 0.8287
TBIL (mg/dL) 0.13±0.03 0.10±0.00 0.13±0.00 0.20±0.06 0.20±0.05 0.23±0.03 0.5570
CHOL (mg/dL) 96.67±1.33 91.67±4.67 100.00±4.36 97.00±1.15 90.50±0.50 99.50±3.43 0.1563
AMYL (U/L) 364.7±88.52 469.3±87.17 441.7±86.78 327.3±109.10 405.8±104.30 426.8±71.53 0.9119
LIPA (U/L) 12.00±2.00 17.67±7.67 22.00±12.00 10.00±0.00 12.75±2.43 12.25±0.75 0.6336

Values are mean±SEM (n=20).

T1=0.25, T2=1.25, T3=2.5, T4=12.5, and T5=25 mg/kg bw/d.

All traits in the table were analyzed by one-way ANOVA with Tukey’s multiple comparison test.

a,b Values with different letters differ significantly (p<0.05)

GLU, glucose; CREA, creatinine; BUN, blood urea nitrogen; PHOS, phosphate; CA, calcium; TP, total protein (TP=ALB+GLOB); ALB, albumin; GLOB, globulin; ALT, alanine aminotransferase; ALKP, alkalinephosphatase; GGT, gamma glutamyl transpeptidase; TBIL, total bilirubin; CHOL, cholesterol; AMYL, amylase; LIPA, lipase.

Download Excel Table
kosfa-42-4-712-g1
Fig. 1. Principal component analysis (A) and variable importance plots (B) of blood biochemical parameters exposed to tebuconazole at 14 d and 28 d. r2X (cum)=0.43, Q2 (cum)=0.117. Variations in the score plot were defined with a 95% confidence interval. Variable importance in projection from orthogonal partial least squares discriminant analysis is indicated by red color (VIPs>1). BUN, blood urea nitrogen; CREA, creatinine; GLU, glucose; GGT, gamma glutamyl transpeptidase; TBIL, total bilirubin; PHOS, phosphate; LIPA, lipase; ALB, albumin; GLOB, globulin; CHOL, cholesterol; ALT, alanine aminotransferase; TP, total protein (TP=ALB+GLOB); ALKP, alkalinephosphatase; AMYL, amylase.
Download Original Figure

Blood provides useful information regarding the dysfunction and immune disorders in animal tissues. Biochemical changes provide critical information on animal physiology. In this study, pigs treated with tebuconazole showed significantly different BUN, ALKP, GGT, CHOL, and ALT levels at 14 d and 28 d. Previous studies have also reported that pesticide exposure increases BUN and CHOL levels (Amin and Hashem, 2012; Haghighizadeh et al., 2015; Ritu et al., 2013). Abnormal blood BUN levels cause glomerular disease, tissue breakdown, and urinary excretion in the kidneys. Urea produced by ammonia in the liver is a potential blood biomarker for kidney damage (Singh et al., 2011). CHOL is a major component of cell membranes and a precursor of stress hormones. They are involved in detoxification processes and maintain homeostasis under stress responses (Firat et al., 2011; Wang et al., 2022). GGT is ubiquitously found in unicellular and multicellular eukaryotes (Rawlings et al., 2010; Saini et al., 2021). GGT has been recognized as a marker for physiological diseases such as biliary hyperplasia and necrosis (Divers, 2015; Reuter et al., 2009). ALT regulates transamination and is a marker for functional damage in the liver and kidney (Firat et al., 2011; Ochiai et al., 2020; Sookoian and Pirola, 2012). Previous studies have also shown that triazole fungicides (i.e., propiconazole and flutriafol) increased the ALT levels in pigs (Jeong et al., 2021; Jeong et al., 2022). ALT levels increase ROS levels and oxidative damage (Patil et al., 2009; Singh et al., 2011). For example, insecticide and acaricide using dimethoate showed statistically significant serum levels of enzymes, including ALT, aspartate aminotransferase, and ALKP, when compared to control animals (Al-Awthan et al., 2014).

ALKP consists of isoenzyme groups and is a hydrolase of PHOS groups (Sharma et al., 2014). Total tract digestibility of in vitro caused by multi-enzyme addition (Recharla et al., 2019). Increased ALKP activity following pesticide exposure, is often an indicator of hepatobiliary changes in dogs. The ALKP value had no relationship with type and was not a marker of hepatotoxicity (Yokoyama et al., 2019). Although ALT, GGT, and ALKP levels were increased by copper-based pesticides (Arnal et al., 2011), organophosphorus pesticides containing propiconazole decreased ALKP levels in pigs (Jeong et al., 2021).

Thus, blood biochemical analysis offers critical information about the internal environment of organisms (Fırat et al., 2011). Based on this study, BUN/CREA ratio, BUN, GLU, and GGT are proposed as potential biomarkers for identifying tebuconazole exposure compared with the non-exposure group.

Residual analysis

Linear and quadratic equations were used to determine the residual limits of dietary tebuconazole in pig tissues (Fig. 2). The quadratic equations for fat (r2=0.9862) and liver (r2=0.9976) showed significant differences among exposure concentrations. The linear equations for fat (r2=0.9807) and liver (r2=0.9813) were also determined. The residual tebuconazole levels increased in the liver and fat tissues. No residual tebuconazole was detected in the blood, kidney, and muscle.

kosfa-42-4-712-g2
Fig. 2. Residue levels of dietary tebuconazole in the liver (A) and fat (B) tissue of pigs. T1=0.25, T2=1.25, T3=2.5, T4=12.5, and T5=25 mg/kg bw/d.
Download Original Figure

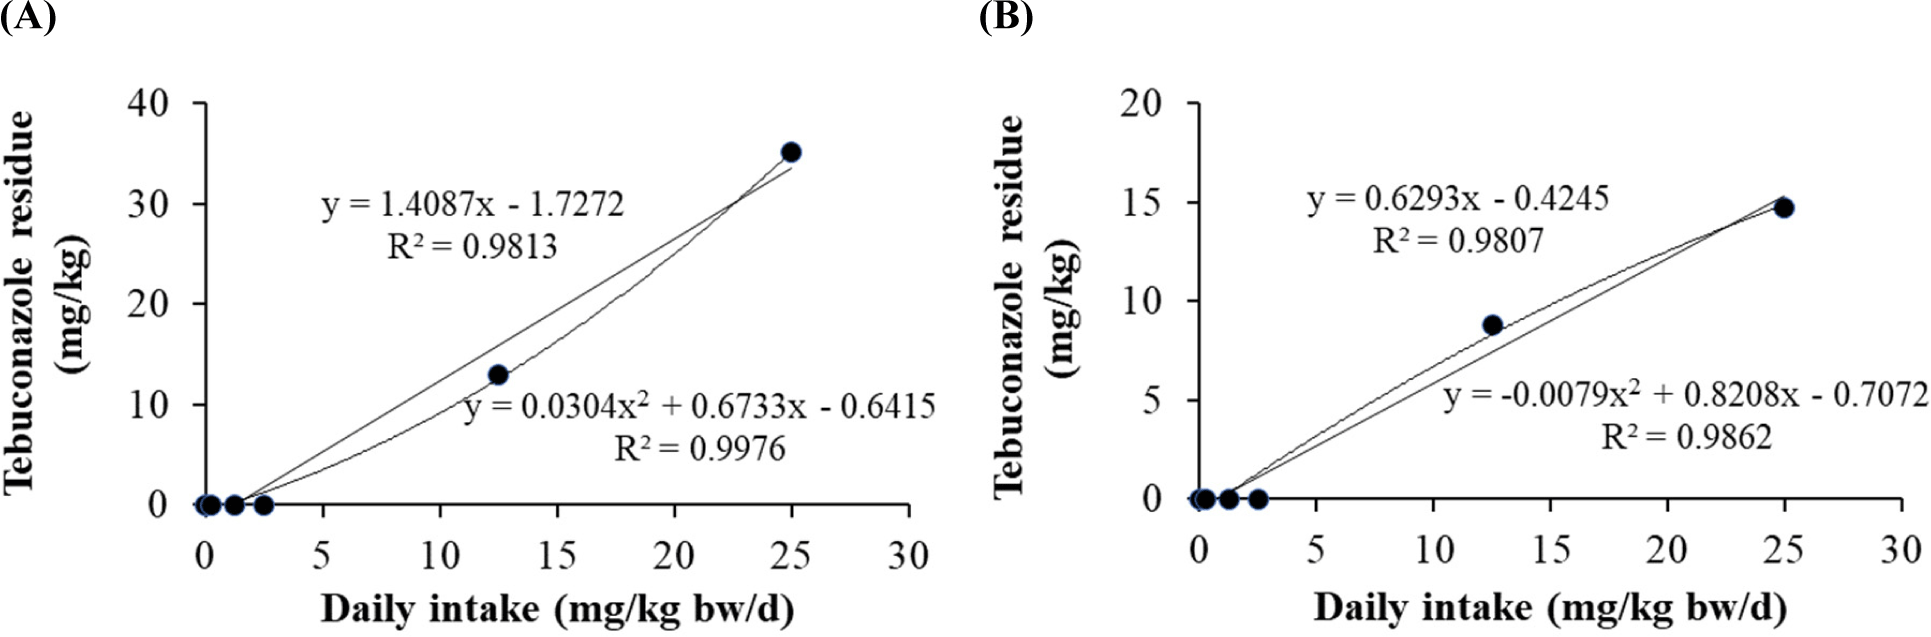
Our previous studies based on equation models suggested that triazole fungicides (propiconazole and flutriafol) showed different residual levels (Jeong et al., 2021; Jeong et al., 2022). In this study, despite acute exposures at high concentrations, the reason for no residual amount in blood, kidney, and muscle tissue is assumed to be the residual characteristics depending on individual tissues because they are excreted. Therefore, the residual values in pig tissues differed based on pesticide type. Together, prediction equations for the residual levels provide critical information for the safety regulation system.

Histological analysis

Histological changes in tissue sections of fat, ileum, kidney, liver, and muscle exposed to tebuconazole were examined to distinguish collagen fibers by Masson’s trichrome staining (Fig. 3). Partial fibrotic changes were observed in the tebuconazole- exposed groups. In the control group, the morphological changes of the five tissues showed a normal structure and a small amount of blue staining. The hepatic portal areas, including the bile duct, branch of the hepatic artery, and portal vein, were stained, and the lobular boundary of the liver was more stained (blue) in the treatment groups than in the non-exposed group.

kosfa-42-4-712-g3
Fig. 3. Representative photomicrographs of tebuconazole-induced histological changes in pig liver, kidney, muscle, fat, and ileum tissues, as represented by Masson’s trichrome staining. T1=0.25, T2=1.25, T3=2.5, T4=12.5, and T5=25 mg/kg bw/d. Fibrosis observed blue stain (arrow) was more extensive in tebuconazole exposure groups. Original magnification at 200× (scale bar=100 μm).
Download Original Figure

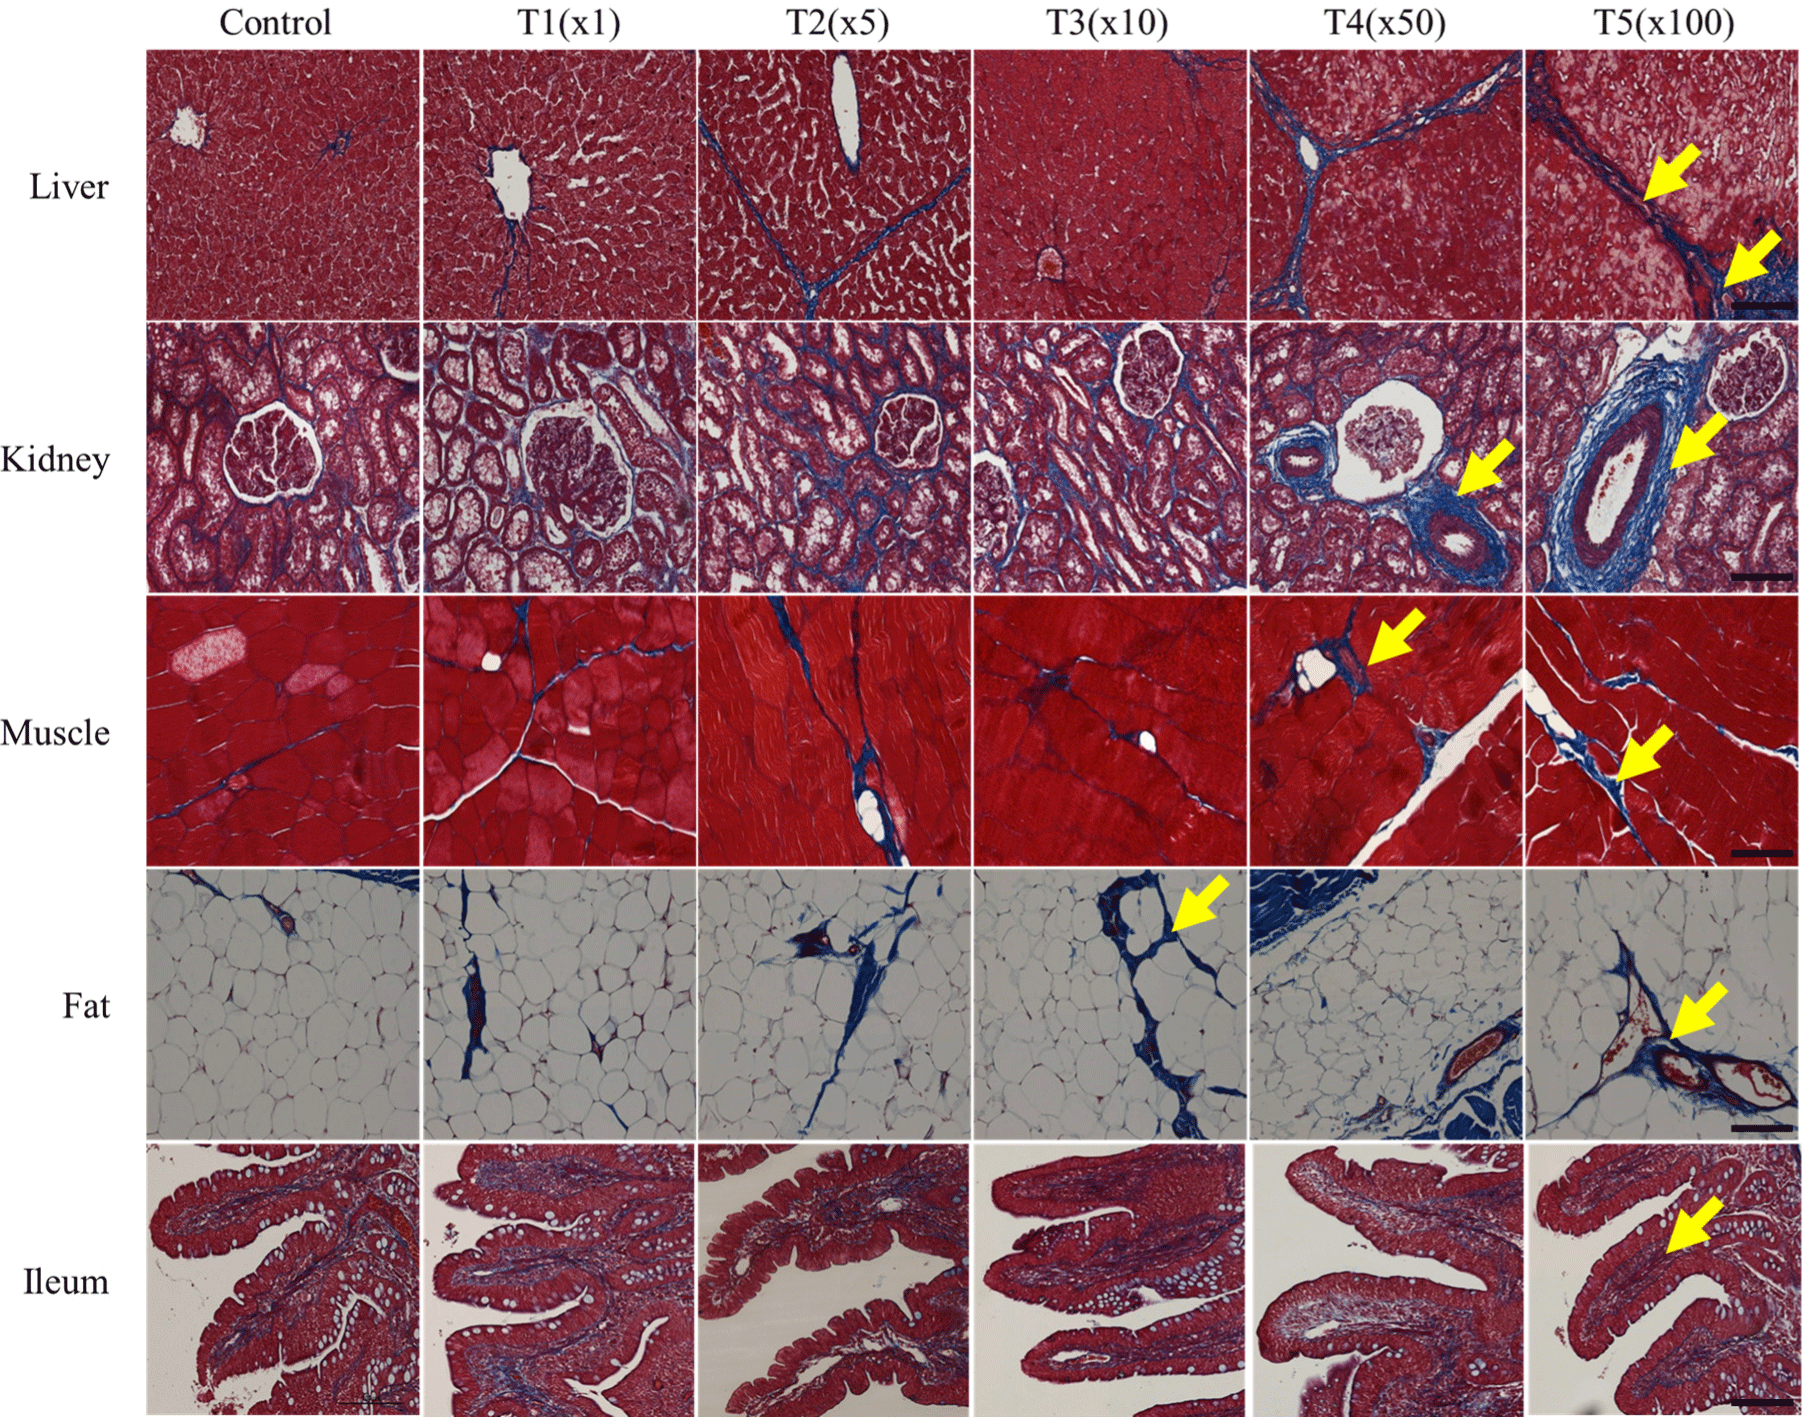
Generally, tebuconazole exposure induces collagen fiber formation. Likewise, in this study, tebuconazole exposure caused morphological changes in healthy kidney tissues, including glomeruli, tubules, and vessels. In particular, tebuconazole affected the fibrotic model, resulting in glomerulosclerosis and arteriosclerosis at different concentrations. Similarly, compared with the control, the connective tissues and veins in the fat tissues were expanded in the treatment groups. However, tebuconazole exposure did not dramatically affect ileum and muscle tissue. Thus, tebuconazole exposure causes collagen fibrosis in the liver, kidneys, and fat tissues of pigs.

The kidney is structurally and functionally composed of two parts: The glomerulus and the tubule. The glomerulus is a capillary circuit through which primary urine is filtered from blood (Arif and Nihalani, 2013). The tubules through which the primary urine flows are responsible for specific functions in reabsorption, secretion, water processing, and metabolism (Ferenbach and Bonventre, 2016). Many kidney diseases affect specific cell types or compartments of the kidneys. As pesticides are primarily excreted by the kidneys, fibrosis occurs around the tubules.

Hepatic fibrosis is induced by the excessive accumulation of collagen, which is characteristic of most types of chronic liver diseases. Chronic liver damage due to advanced liver fibrosis can lead to cirrhosis and portal hypertension and often requires liver transplantation (Bataller and Brenner, 2005). Liver and kidney fibrosis expand in vacuoles and proximal tubules, causing necrosis and hepatocellular damage. In this study, these histological changes were observed in the liver, kidneys, and fat tissues after tebuconazole treatment. Thus, tebuconazole induces the deterioration and degeneration of tissues.

Conclusion

In conclusion, our findings indicate that tebuconazole exposure affects the morphology of the pig liver, kidney, and fat, which causes fibrosis. After tebuconazole treatment, BUN, GGT, CHOL, and ALKP levels at 14 d and ALT levels at 28 d in the treatment groups showed significant differences compared with the control. In particular, the BUN/CREA ratio, BUN, GLU, and GGT are potential biomarkers for tebuconazole at 14 d and 28 d. The equations for tebuconazole residues in liver and fat tissues showed that pesticide was detected at more than 50 times the acceptable daily intake. Our study showed that the residual levels of tebuconazole in each tissue are different. Therefore, even though tebuconazole is not detected, pesticide cause physiological changes and provide information for establishing maximum residue limits in pork and pork products.

Conflicts of Interest

The authors declare no potential conflicts of interest.

Acknowledgements

This study was carried out with the support of the “Cooperative Research Program for Agriculture Science and Technology Development (Project No. PJ01426303)” Rural Development Administration, Korea.

Author Contributions

Conceptualization: Jeong JY. Data curation: Kim B. Formal analysis: Park SH. Methodology: Kim M, Oh SI. Software: Jeong JY. Validation: Jeong JY, Kim B. Investigation: Kim E, Jung H. Writing - original draft: Jeong JY. Writing - review & editing: Jeong JY, Kim M, Park SH, Kim B, Oh SI, Kim E, Jung H.

Ethics Approval

This study was approved by IACUC of Rural Development Administration (No. NIAS-2019-1576).

References

1.

Aktar MW, Sengupta D, Chowdhury A. 2009; Impact of pesticides use in agriculture: Their benefits and hazards. Interdiscip Toxicol. 2:1-12

2.

Al-Awthan YS, Hezabr SM, Al-Zubairi AM, Al-Hemiri FA. 2014; Effects of aqueous extract of Withania somnifera on some liver biochemical and histopathological parameters in male guinea pigs. Pak J Biol Sci. 17:504-510

3.

Amin KA, Hashem KS. 2012; Deltamethrin-induced oxidative stress and biochemical changes in tissues and blood of catfish (Clarias gariepinus): Antioxidant defense and role of alpha-tocopherol. BMC Vet Res. 8:45

4.

Arif E, Nihalani D. 2013; Glomerular filtration barrier assembly: An insight. Postdoc J. 1:33-45

5.

Arnal N, Astiz M, de Alaniz MJT, Marra CA. 2011; Clinical parameters and biomarkers of oxidative stress in agricultural workers who applied copper-based pesticides. Ecotoxicol Environ Saf. 74:1779-1786

6.

Azaroff LS, Neas LM. 1999; Acute health effects associated with nonoccupational pesticide exposure in rural El Salvador. Environ Res. 80:158-164

7.

Bataller R, Brenner DA. 2005; Liver fibrosis. J Clin Invest. 115:209-218

8.

Ben Saad H, Ben Abdallah F, Bkhairia I, Boudawara O, Nasri M, Hakim A, Ben Amara I. 2020; Efficacy of essential trace elements supplementation on mineral composition, sperm characteristics, antioxidant status, and genotoxicity in testis of tebuconazole-treated rats. Biomed Environ Sci. 33:760-770.

9.

Chandra R, Sharpanabharathi N, Prusty BAK, Azeez PA, Kurakalva RM. 2021; Organochlorine pesticide residues in plants and their possible ecotoxicological and agri food impacts. Sci Rep. 11:17841

10.

Damalas CA, Eleftherohorinos IG. 2011; Pesticide exposure, safety issues, and risk assessment indicators. Int J Environ Res Public Health. 8:1402-1419

11.

Divers TJ. 2015; The equine liver in health and disease. Proceedings of the 61st Annual Convention of American Association of Equine Practitioners. Las Vegas, NV, USA. pp p. 66-103.

12.

Duanis-Assaf D, Galsurker O, Davydov O, Maurer D, Feygenberg O, Sagi M, Poverenov E, Fluhr R, Alkan N. 2022; Double-stranded RNA targeting fungal ergosterol biosynthesis pathway controls Botrytis cinerea and postharvest grey mould. Plant Biotechnol J. 20:226-237

13.

Eddleston M, Buckley NA, Eyer P, Dawson AH. 2008; Management of acute organophosphorus pesticide poisoning. Lancet. 371:597-607

14.

Ferenbach DA, Bonventre JV. 2016; Acute kidney injury and chronic kidney disease: From the laboratory to the clinic. Nephrol Ther. 12:S41-S48

15.

Fırat Ö, Cogun HY, Yüzereroğlu TA, Gök G, Fırat Ö, Kargin F, Kötemen Y. 2011; A comparative study on the effects of a pesticide (cypermethrin) and two metals (copper, lead) to serum biochemistry of Nile tilapia, Oreochromis niloticus. Fish Physiol Biochem. 37:657-666

16.

Food and Agriculture Organization of the United Nations [FAO], World Health Organization [WHO]. 2010 Pesticide residues in food 2009: Joint FAO/WHO meeting on pesticide residues. FAO. Rome, Italy: Report No. 198.

17.

Haghighizadeh MH, Salehcheh M, Emam SJ, Jazayeri SM, Bakhtiari N. 2015; Biochemical effects of pesticides commonly used among agricultural workers among Arabs of southwestern, Iran. Trends Life Sci. 4:420-425.

18.

Handford CE, Elliott CT, Campbell K. 2015; A review of the global pesticide legislation and the scale of challenge in reaching the global harmonization of food safety standards. Integr Environ Assess Manag. 11:525-536

19.

Hoppin JA, Yucel F, Dosemeci M, Sandler DP. 2002; Accuracy of self-reported pesticide use duration information from licensed pesticide applicators in the Agricultural Health Study. J Expo Anal Environ Epidemiol. 12:313-318

20.

Hu Z, Li G, Sun Y, Niu Y, Ma L, He B, Ai M, Han J, Zeng B. 2019; Gene transcription profiling of Aspergillus oryzae 3.042 treated with ergosterol biosynthesis inhibitors. Braz J Microbiol. 50:43-52

21.

Jeong JY, Kim B, Ji SY, Baek YC, Kim M, Park SH, Jung H. 2022; Effect of flutriafol exposure on residue characteristics in pig muscle and fat tissue. Food Sci Anim Resour. 42:186-196

22.

Jeong JY, Kim B, Ji SY, Baek YC, Kim M, Park SH, Kim KH, Oh SI, Kim E, Jung H. 2021; Effect of pesticide residue in muscle and fat tissue of pigs treated with propiconazole. Food Sci Anim Resour. 41:1022-1035

23.

Jeong JY, Kim M, Baek YC, Song J, Lee S, Kim KH, Ji SY, Lee HJ, Oh YK, Lee SD. 2018; A recent trend of residual pesticides in korean feed. J Korean Soc Grassl Forage Sci. 38:156-164

24.

Ku T, Zhou M, Hou Y, Xie Y, Li G, Sang N. 2021; Tebuconazole induces liver injury coupled with ROS-mediated hepatic metabolism disorder. Ecotoxicol Environ Saf. 220:112309

25.

Li H, Zhang M, Vervoort J, Rietjens IMCM, van Ravenzwaay B, Louisse J. 2017; Use of physiologically based kinetic modeling-facilitated reverse dosimetry of in vitro toxicity data for prediction of in vivo developmental toxicity of tebuconazole in rats. Toxicol Lett. 266:85-93

26.

Lopez-Antia A, Ortiz-Santaliestra ME, Mougeot F, Camarero PR, Mateo R. 2021; Birds feeding on tebuconazole treated seeds have reduced breeding output. Environ Pollut. 271:116292

27.

Ochiai H, Shirasawa T, Yoshimoto T, Nagahama S, Watanabe A, Sakamoto K, Kokaze A. 2020; Elevated alanine aminotransferase and low aspartate aminotransferase/alanine aminotransferase ratio are associated with chronic kidney disease among middle-aged women: A cross-sectional study. BMC Nephrol. 21:471

28.

Park Y, Ahn C, Kim TH. 2021; Occupational and environmental risk factors of idiopathic pulmonary fibrosis: A systematic review and meta-analyses. Sci Rep. 11:4318

29.

Patil JA, Patil AJ, Sontakke AV, Govindwar SP. 2009; Occupational pesticides exposure of sprayers of grape gardens in western Maharashtra (India): Effects on liver and kidney function. J Basic Clin Physiol Pharmacol. 20:335-355

30.

Rawlings ND, Barrett AJ, Bateman A. 2010; MEROPS: The peptidase database. Nucleic Acids Res. 38:D227-D233

31.

Recharla N, Kim D, Ramani S, Song M, Park J, Balasubramanian B, Puligundla P, Park S. 2019; Dietary multi-enzyme complex improves in vitro nutrient digestibility and hind gut microbial fermentation of pigs. PLOS ONE. 14e0217459

32.

Reuter S, Schnekenburger M, Cristofanon S, Buck I, Teiten MH, Daubeuf S, Eifes S, Dicato M, Aggarwal BB, Visvikis A, Diederich M. 2009; Tumor necrosis factor α induces γ-glutamyltransferase expression via nuclear factor-κB in cooperation with Sp1. Biochem Pharmacol. 77:397-411

33.

Ritu A, Tripathi N, Choudhary A, Agnihotri S. 2013; Biochemical alterations among spray farmers due to chronic exposure to chlorpyrifos, an organophosphate pesticides. Int J Curr Microbiol Appl Sci. 2:415-418.

34.

Saini M, Kashyap A, Bindal S, Saini K, Gupta R. 2021; Bacterial gamma-glutamyl transpeptidase, an emerging biocatalyst: Insights into structure–function relationship and its biotechnological applications. Front Microbiol. 12:641251

35.

Schmidt F, Marx-Stoelting P, Haider W, Heise T, Kneuer C, Ladwig M, Banneke S, Rieke S, Niemann L. 2016; Combination effects of azole fungicides in male rats in a broad dose range. Toxicology. 355-356:54-63

36.

Sharma U, Pal D, Prasad R. 2014; Alkaline phosphatase: An overview. Indian J Clin Biochem. 29:269-278

37.

Singh S, Kumar V, Thakur S, Dev Banerjee B, Chandna S, Rautela RS, Grover SS, Rawat DS, Pasha ST, Jain SK, Ichhpujani RL, Rai A. 2011; DNA damage and cholinesterase activity in occupational workers exposed to pesticides. Environ Toxicol Pharmacol. 31:278-285

38.

Sookoian S, Pirola CJ. 2012; Alanine and aspartate aminotransferase and glutamine-cycling pathway: Their roles in pathogenesis of metabolic syndrome. World J Gastroenterol. 18:3775-3781

39.

Toda M, Beer KD, Kuivila KM, Chiller TM, Jackson BR. 2021; Trends in agricultural triazole fungicide use in the United States, 1992–2016 and possible implications for antifungal-resistant fungi in human disease. Environ Health Perspect. 129:055001

40.

Wang X, Lu H, Li Q, Zhou Y, Zhou J. 2022; Comparative genome and transcriptome of Rhodococcus pyridinivorans GF3 for analyzing the detoxification mechanism of anthraquinone compounds. Ecotoxicol Environ Saf. 237:113545

41.

Yan D, Zhang Y, Liu L, Shi N, Yan H. 2018; Pesticide exposure and risk of Parkinson’s disease: Dose-response meta-analysis of observational studies. Regul Toxicol Pharmacol. 96:57-63

42.

Yokoyama Y, Ono A, Yoshida M, Matsumoto K, Saito M. 2019; Toxicological significance of increased serum alkaline phosphatase activity in dog studies of pesticides: Analysis of toxicological data evaluated in Japan. Regul Toxicol Pharmacol. 109:104482