Introduction
Pork is one of the most commonly consumed meats worldwide with the fast growing consumption rate due to their high nutrition. For the same reason, a spoilage caused by microorganisms, tissue enzymes and chemical reactions is much more likely to happen to make quality decline during transportation and preservation (Chen et al., 2014; Huang et al., 2014; Li et al., 2016a; Li et al., 2016b). Concretely, quality decline mainly lies in water holding capacity decrease, nutrient content reduce, unpleasant smells producing, freshness loss and so on. Among the above mentioned features, freshness loss is one of the most important influencing factors, which always affects the commodity price and determines consumer preference (Chen et al., 2016). Thus, it is necessary to evaluate pork freshness to provide fundamental freshness information for the pricing and consumer choice.
The existing evaluation methods for identifying freshness include sensory evaluation and objective measurement. The former should only be attempted by experienced personnel using their tactile, sight and olfaction, for which it is subjective and slow (Prieto et al., 2009). The latter are conventionally physico-chemical or biological methods, such as detecting the content of freshness-related compounds by gas chromatography, high-performance liquid chromatography, and spectrophotometry, or detecting the numbers of specific spoilage organisms by microbiological analysis. These methods are relatively accurate but they always need professional operators and cannot realize the on-line identification. Alternatively, electronic nose (Khulal et al., 2016), electronic tongue (Chen et al., 2015), computer vision (CV) (Girolami et al., 2013), spectroscopic techniques (Fourier transform near infrared (FT-NIR), NIR, visible, and Rama spectroscopy) (Kutsanedzie et al., 2018; Ouyang et al., 2016; Saraiva et al., 2016), spectral imaging (hyperspectral, multispectral and ultraspectral imaging) (Cheng et al., 2016a; Li et al., 2015b; Xiong et al., 2015; Ye et al., 2016) have been developed for rapid and non-destructive detection of food quality. These techniques have their own advantages, but there are still some limitations. For instance, the spectroscopy method depends only on scanning single-point measurement, and could not provide spatial distribution information; CV just obtains the surface information; spectral imaging can overcome above shortcomings but it cannot study the microstructure. As a logical extension of hyperspectral imaging and microscopy imaging, hyperspectral microscopic imaging (HMI) system was fabricated to work around this limitation.
In recent years, hyperspectral microscopic imaging (HMI) technology, known as a promising method that integrates hyperspectral imaging with microscopic imaging, have emerged and been successfully applied to capture spectral and spatial images of tissue sections (Huang et al., 2013; Ortaç et al., 2016). For example, Li et al. (2014) used HMI system to capture hyperspectral microscopic images of methyl green and nitrotetrazolium blue chloride dual-stained colon sections, and significantly improved contrast and legibility of results and increase the accuracy of the unmixing of each stain in the samples. Uhr et al. (2012) developed a HMI platform to identify and quantify 10 molecular markers in individual cancer cells in a single pass. Above studies demostrate that HMI could be a valuable complementary tool in tissue examination. To the best of our knowledge, all existing HMI systems were applied for histological and immunohistochemical analysis, and the application of HMI on meat fresh degree evaluation is barely on research. Thus, the aim of the present study was to develop a HMI system and investigate its potential of pork fresh degree evaluation. To this end, the contents of total volatile basic nitrogen (TVB-N) in pork were determined with the method during different period of storage and regarded as the categorize standard of the pork fresh degree. At the same time, the samples were measured by the fabricated HMI system, and analyzed using linear discriminant analysis (LDA), back propagation artificial neural network (BP-ANN) and support vector machine (SVM) after a series of features extraction of the obtain hyperspectral microscope images. The following sections describe the fabricating of the HMI system, the processing of data, and experimental results in detail.
Materials and Methods
Six batches of freshly butchered pork fillet from six separated pork was purchased from local abattoir of Zhenjiang (China) on the same day and transported to the laboratory immediately (within 30 min) to keep the freshness. Pigs were slaughtered under commercial conditions: stunned electrically, exsanguinated, scalded, de-haired, eviscerated and split into sides. And the slaughter was carried out according to the National Standard of PR China (GB/T17236-2008). Each batch of pork fillet was divided into fifteen parts and each part was cut into 1 cm×1 cm×1 cm (length×width×thickness) cube uniformly as samples in super-clean bench, and the weight of each pork sample was 2±0.1 g. Then every sample was vacuum packed with a sealed bag, and the air in the bag was removed with a vacuum pump before stored in 4°C refrigeration for 1, 3, 5 d. To avoid the impact of differences between various batches and broaden the applicability of experiment results, samples from six batches were evenly divided into three parts and stored for different time. A total of 90 pork filler cube were obtain, wrapped with plastic wrap, labeled and used for TVB-N content test and hyperspectra microscopic image acquisition. Prior to HMI acquisition, samples were divided into two subsets, of which one was training set for developing the classification model, and the other was prediction set for validating the developed model. The former consisted two of every three samples in each fresh grades, thus, it contained 60 samples, whereas the latter contained the remaining 30 samples.
A self-assembled HMI system was developed in this study, and the composition and the structure of its hardware is shown in Fig. 1A. The whole system was assembled based on the combination of micro imaging technique and hyperspectral imaging technique, and consists of an inverted microscope for signal collection (Nikon ECLIPSE Ti-S, Nikon, Japan), an imaging spectrograph (V10E-0312-657, Specim, Finland), an electron-multiplying charge-coupled device (EMCCD) (N17EB1610, ImSpector, Finland) camera for acquisition of image with a spatial resolution of 1004×2045 pixels and size of 8 μm×8 μm, an inversion optical lens for rotating image, a 12 V and 100 W quartz-halogen illuminator (D-LH/LD, Nikon, Japan), a X-Y motorized platform, a data acquisition and pre-processing software (Spectral Image-VNIR, Isuzu Optics, Taiwan), and a personal computer (OptiPlex 790, Dell, USA) equipped with Spectral Image-VNIR and ENVI (ENVI 4.5, Research System, Inc., USA). The entrance slit of the imaging spectrograph was coupled to the slide port of the inverted optical microscope, and the EMCCD camera was mounted on the exit port of the spectrograph. The other slide port of the inverted optical microscope was coupled to the slide port of the microscope with a C-mount. One fiber-optic light-guiding from the illuminator was mounted on the microscope as a perfect lighting source of whole system. The X-Y motorized platform was used to move the inversion optical lens with a stepper motor controlled by the computer via a serial port, so that both camera scanning and platform motion could be synchronized.
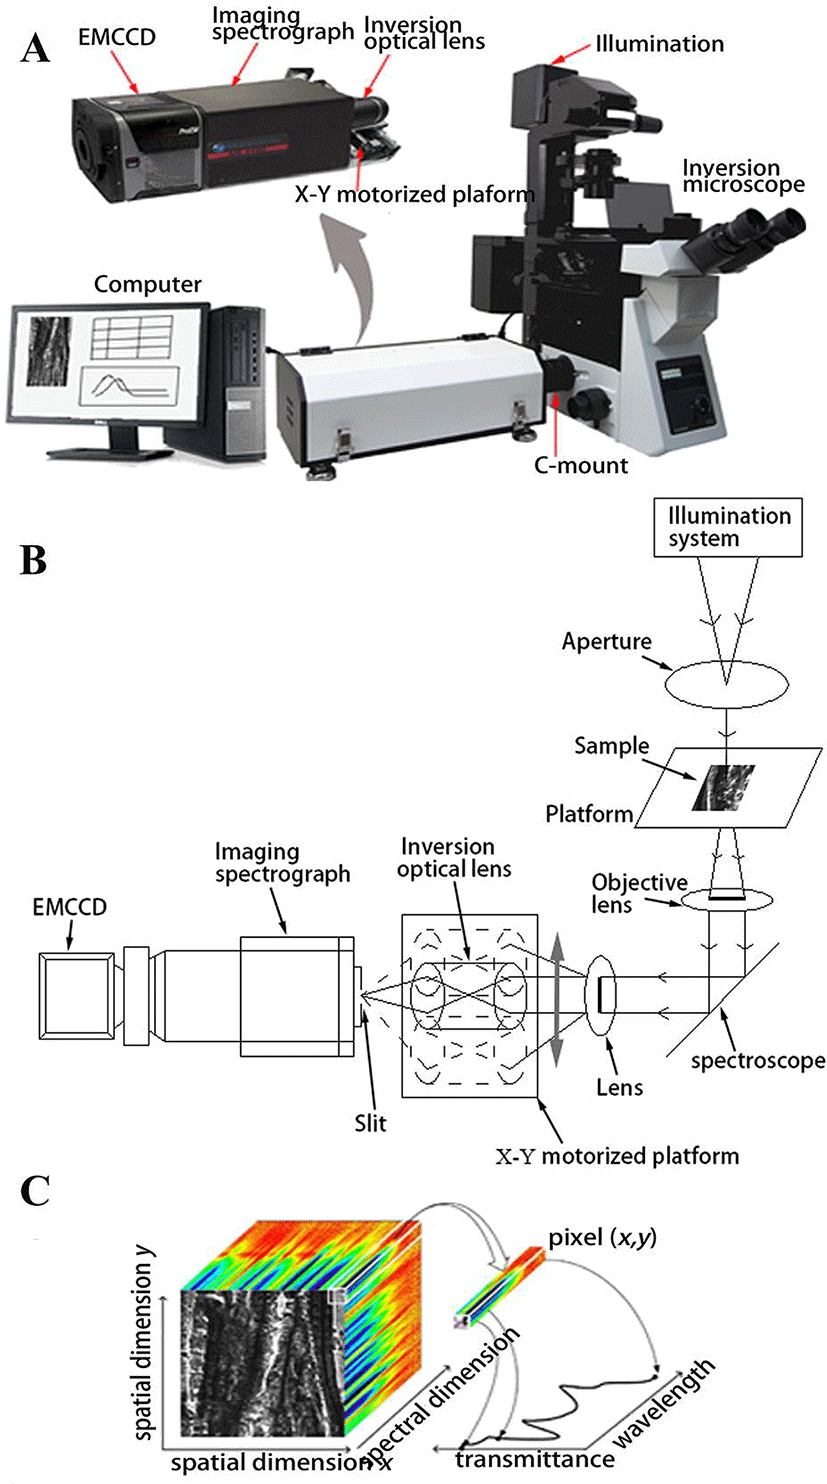
The operating principle of the developed system is shown in Fig. 1B, sample is put on the microscope table and illuminated by Kohler illumination system. The transmitted light through the sample strips in instantaneous field of view firstly reaches the slit of spectrometer through the objective lens of the microscope and C-Mount, and then was dispersed in the vertical direction of sample strips by optical grating and projected on EMCCD image plane. Finally, a linear array of data was obtained. In the developed HMI system, a fine-tuned inversion optical lens was innovatively installed between the imaging spectrometer and C-Mount to realize the movement of the imaging location with the lens. That, combined with spectrometer slit, can implement traditional push broom, and get a three-dimensional datacube (x, y, λ) consequently.
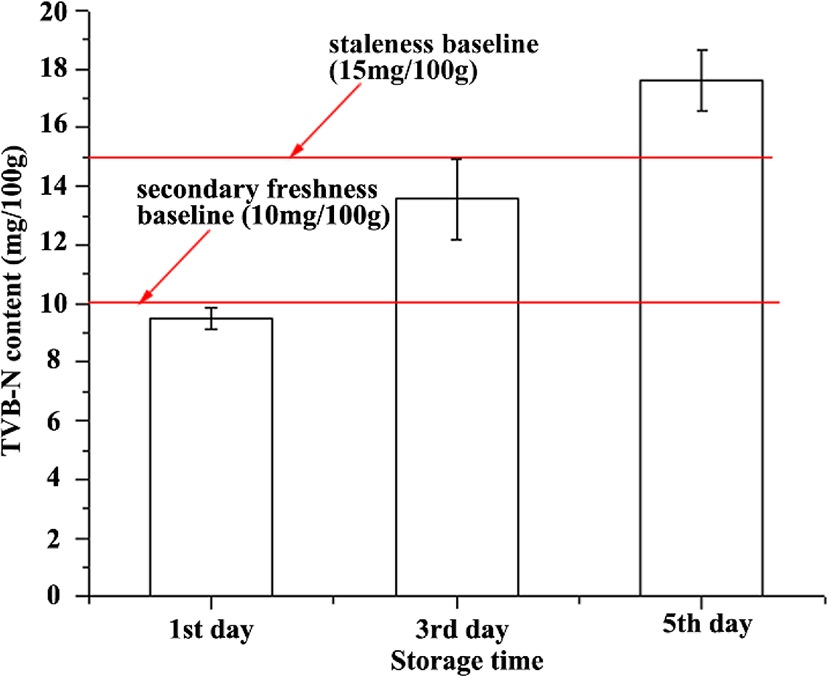
In this study, TVB-N content of 90 preprocessed pork samples was determined by semi-micro-Kjeldahl method in terms of China National Standard GB/T 5009.44-2003. TVB-N content refers to ammonia or amine and other basic nitrogen containing volatile substances produced by protein decomposition because of the effects of external microbes and biological enzymes in aninal products. If meat has higher TVB-N content, it indicates that the more internal components of meat are destoryed, and meanwhile, the worse the freshness. Based on the TVB-N content, the fresh degree of all the samples were defined in terms of Chinese Standard GB/T 2707-2016. This standard points out that meat can be devided into three levels- fresh level (TVB-N content ≤10 mg/100 g), secondary fresh level (10 mg/100 g<TVB-N content ≤15 mg/100 g) and stale level (TVB-N content >15 mg/100 g).
Prior to image acquisition, turned on the HMI instrument to allow it warm up for 30 min. In this time, took samples out of the refrigerator one by one, sliced each one into 40 μm flake by microtome (Leica CM1900 Cryostat, Leica-microsystems, Germany), and placed on the microslide. After preheating, put the microslide on the platform for data acquisition. The image of sample was individually conveyed through the field of view (FOV) of the spectrograph with an optimized speed of 0.01 mm/s, and the range of X was set as 9-17 mm. The FOV is a line area with 2 cm in length and 72 μm in width, and the exposure time of EMCCD camera was set to 300 ms. During the experiments, to get the same texture direction of the pork samples, all scan lines were kept parallel to the longitudinal orientation of pork meat. Once the image of sample entered the FOV, the hyperspectral data was captured and sent to the PC through a USB port for storage. The final full-spectrum datacube I for each sample was of 1,004×2,045×250 pixels (the first two numbers are for spatial sampling; the last number is for spectral sampling) as seen in Fig. 1C.
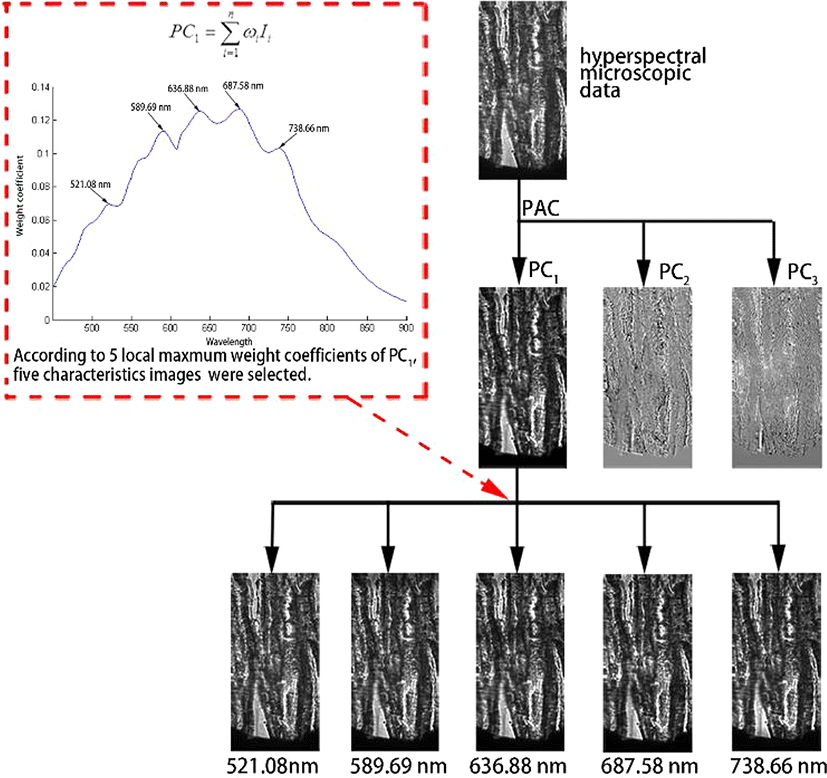
In the HMI system, the available wavelength range is between 316 nm to 1,111 nm, with a spectral interval of 3.1744 nm, which resulted in 250 spectral bands. According to the recent research about the original hyperspectral data analysis, there is a large noise in the spectral images in the regions below 450 nm and over 900 nm (Huang et al., 2015) and it is hard to eliminate in subsequent process. Thus, the middle 143 pieces of images from 450 nm to 900 nm was selected, which is still a large number input in model setting. Among these, load from neighboring band images and band-to-band correlation is common and can be avoided normally. To solve this problem, principal component analysis (PCA), which is a powerful tool in dimensional reduction for highly correlated data, was used to explain the selected multidimensional data cube by a small number of linearly uncorrelated variables according to Eq. (1).
Where PCm is the mth PC image, n is the number of pictures in the original hyperspectral microscopic image data, ωi is the weight coefficient for the picture at the i waveband, and Ii is the original picture at the i waveband.
In the process of HMI cube acquisition, the acquired images could be affected by illumination system, transmission rate of incident light, the dark current of the camera and other possible variation of the system (Gaston et al., 2010; Xiaobo et al., 2011). To minimize these influence, all acquired hyperspectral microscope image cube were corrected using Eq. (2).
Where R is the resulting relative reflectance image cube, I is the original hyperspectral microscopic image, B is the dark image (approximately 0% reflectance) recorded by covering the lens caps of the camera, and W is the white reference image obtained by letting all the light through (approximately 99% reflectance).
After correction of images, a rectangle shape in the center of each hyperspectral image was segmented as the region of interests (ROIs) to enhance the quality of the image. In each ROI, the image texture was extracted using Gray level co-occurrence matrix (GLCM) (Cheng et al., 2016b; Huang et al., 2015; Kamruzzaman et al., 2012). By statistically analyzing respective gray level of two pixels which keep a certain distance in the image, we obtained the GLCM of each characteristic image and then worked out four texture features: contrast (CON), correlation (COR), energy (EN), and homogeneity (HOM) with one distance (D=1) and four directions (0°, 45°, 90°, and 135°). Of which, CON expresses variations, COR measures the spatial arrangement of gray level, EN is a measure of the textural uniformity of the image, and HOM is in verse proportional to CON at constant EN. Meanwhile, the mean and standard deviation of each image were also calculated and fused together with above four feature values in four directions to constitute the texture feature variables of each characteristic image.
Prior to classification, fisher discriminant analysis (FDA) (Jiang et al., 2015), known as dimensionality reduction and classification algorithm, was performed for dimensionality reduction and pre-classifying the pork fresh degree to making a preliminary judgment on the classification feasibility of HMI system. Based on the cubes selected from FDA, samples were classified by three typical multivariate analysis models including LDA (Liu et al., 2006), BP-ANN (Ahmed, 2005; Lee, 2004; Yu, 2005) and SVM (Li et al., 2015a; Lin et al., 2009). The quality of these algorithms were evaluated according to the discrimination rate in the prediction set of established model. All data algorithms were implemented in Matlab (R2009b, Math works Inc., USA) in Windows 7.
FDA is a supervised method used for classification by determining a set of projection vectors that minimize the scatter within each class while maximizing the scatter between the classes (Zhao and Gao, 2015). It computes a set of linear transformation vectors, called FDA vectors, which maximize the distance among different classes while minimizing the distance within a class in the projected space. After computation, the feature variables of all samples can be projected by FDA vectors, and then separated from one another.
The LDA, as a classic algorithm in pattern recognition, has been proven to be powerful and competitive to other linear ones (Sharma and Paliwal, 2008; Siqueira et al., 2017). The basic idea of LDA is to find a linear transformation such that can realize maximization of separability among class distributions and minimization of intra-class variances. Based on Fisher’s linear classifiers, the classification procedure in this study was achieved, in which all information of samples was expressed by a measure of the separation of the two class centres.
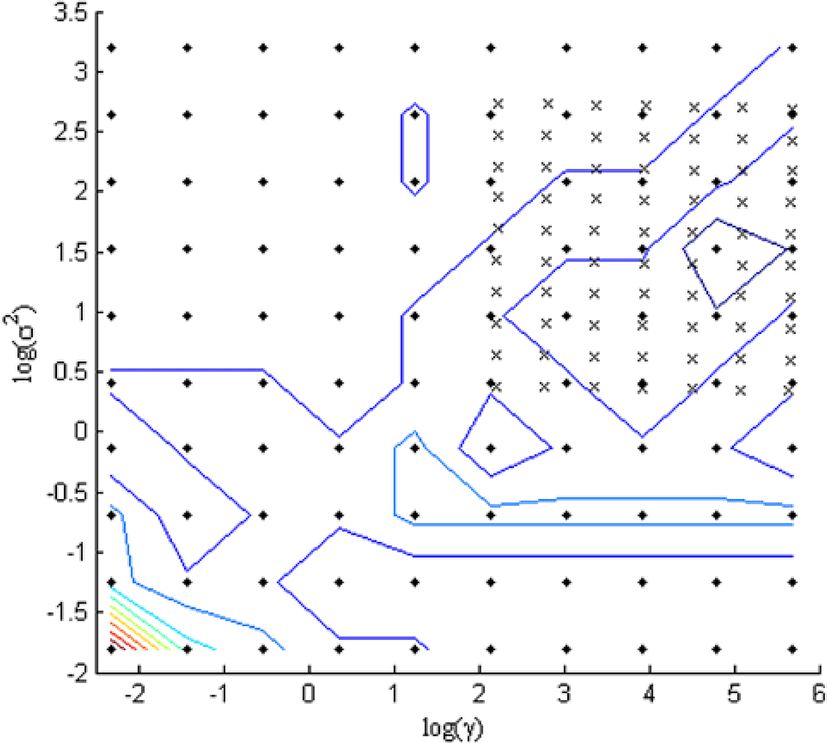
SVM, known as a hyper plane classifier, focuses on maximizing the margin or degree of separation in the training data (Morales et al., 2016; Olgun et al., 2016; Trebar and Steele, 2008). There are many hyper planes which can divide the data between two classes for classification. To determine an optimal line, one reasonable choice is to find a weight vector, which can make the classification margin between the two classes as large as possible using kernel functions. Different kernel functions, mapping input data in higher dimensional space, have been described in literature: polynomial, radial basic function (RBF), sigmoid functional, and others (Jia et al., 2016). In this study, SVM was built using RBF as kernel function because previous researches prove that RBF is a more compatible supported kernel function (Ring and Eskofier, 2016). The equation is denoted as Eq. (3). By optimizing the parameters of kernel function (shown in Fig. 2), the optimum parameters (σ =2.659, γ =722.0397) were selected to obtain the model with high recognition rate.
BP-ANN is one of the most widely applied neural network models, as a type of feed-forward, supervised learning network which can adapt its knowledge by adjusting weights, based on the classification error of one or more outputs(Guo et al., 2016; López-García et al., 2010; Su and Sun, 2016). The network topology of BP-ANN consists of multiple layers, which are the input layer, one or more hidden layers and the output layer. Two adjacent layers are always fully connected through certain values of weights. To improve the performance of BP-ANN, the optimal BP-ANN architecture model was achieved with 5 hidden layer nodes, both learning rate factor and momentum factor were set to 0.1, initial weight was set to 0.3, iteration times was set to 1,000, and the output of first hidden layer was set as hyperbolic tangent segment transfer function while the output of second hidden layer and output layer both set as linear transfer function, respectively.
Results
With prolonged storage time, the main ingredients of pork, such as protein, fat and carbohydrates, would be decomposed into toxic smaller molecular components by the function of enzymes and microbes. The compounds mainly ammonia, DMA and TMA are TVB-N compounds and their contents rise relatively with storage time progressing due to the spoilage by either bacterial or enzymatic action (Höll et al., 2016). The reference measurement of pork stored for different time is shown in Fig. 3, it can be seen that the difference of TVB-N content for three groups is obvious. In pace with lengthening of storage time, the TVB-N value of pork also increased, and there is a clear dividing line between the measured TVB-N values of the three groups of samples (1st day, 3rd day and 5th day). According to Chinese Standard GB/T 2707-2016, for fresh meat, TVB-N content ≤15 mg/100 g, or else, it should be defined as stale one. Therefore, in this study, we consider samples stored in the 1st day (TVB-N content <10 mg/100 g) as fresh pork, samples stored in the 3rd day (TVB-N content between 10-15 mg/100 g) as secondary fresh meat, and samples stored in the 5th day (TVB-N content > 15 mg/100 g) as stale pork. And then, use these three groups to study the feasibility of meat fresh degree discern technology based on homemade HMI system.
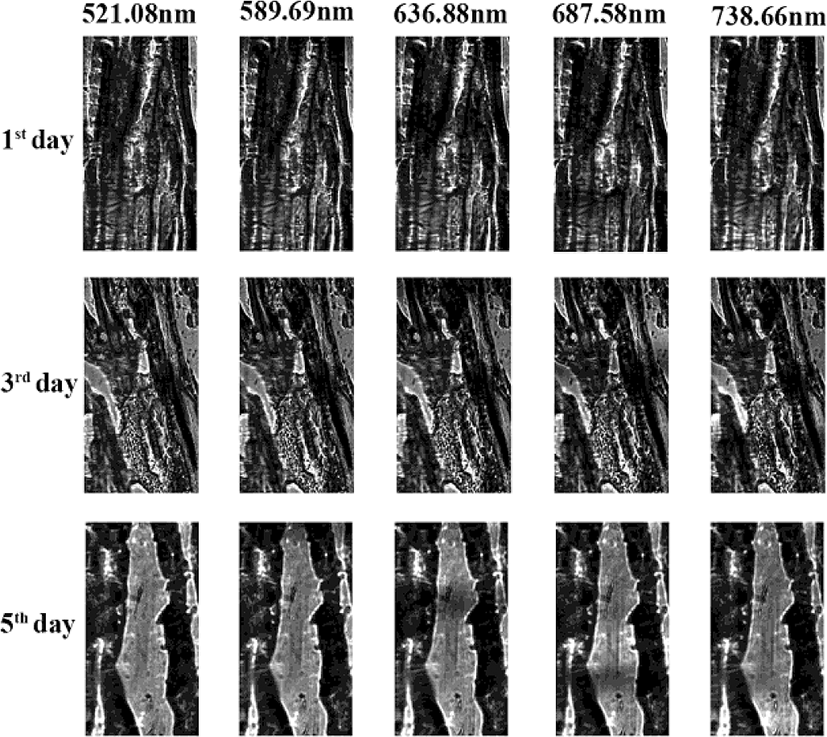
From the obtained hyperspectral microscopic images of different spoilage degrees shown in Fig. 4, we can see that the devastation extent of meat tissue was increased with the extent of meat spoilage. The muscle fiber was complete on the first day, while fibers began to rupture with some tiny cracks started appearing on the third day, and a very large area crack appeared on the fifth day. The reasons are the following.
After slaughter, meat deterioration is inevitable due to the natural enzymatic actions in the muscle cells, chemical reaction and microorganism decomposition. By the function of above actions, complex compounds (fat, protein and carbohydrates) of the tissues are broken down into simpler ones, leading to the microstructure of pork, such as muscle fibers and adipose fracture, separate over time. Hence, as the storage time prolongs, many small cracks which can be shown in hyperspectral microscopic images aggregate to form a large crack.
Prior to classification modeling, PCA, which allows an easy visualization of all the information contained in the data set with retaining most information of the original data set, was carried out on the whole image matrix, and three principal components were extracted and shown in Fig. 5. Among them, principal component 1 (PC1) image described up to 96.35% of the total variance. Thus, the dominant bands were determined according to PC1 image in this work, and five dominant bands (i.e. 521.08 nm, 589.69 nm, 636.88 nm, 687.58 nm and 738.66 nm) with higher weight coefficients were selected by investigating all weighting coefficients (See Fig. 5). Of which, wavebands around 580 nm, 635 nm and 521 nm correspond to metmyoglobin, sulfmyoglobin and muscles respectively, which are related to pork fresh degree (Wu et al., 2012). Therefore, the hyperspectral microscopic images at these five wavebands can reflect information of pork’s fresh degree and be used for classification of pork fresh degree. In addition, GLCM was implemented to extract texture data on each characteristic image. As a result, 18 textural variables were acquired for each hyperspectral image.
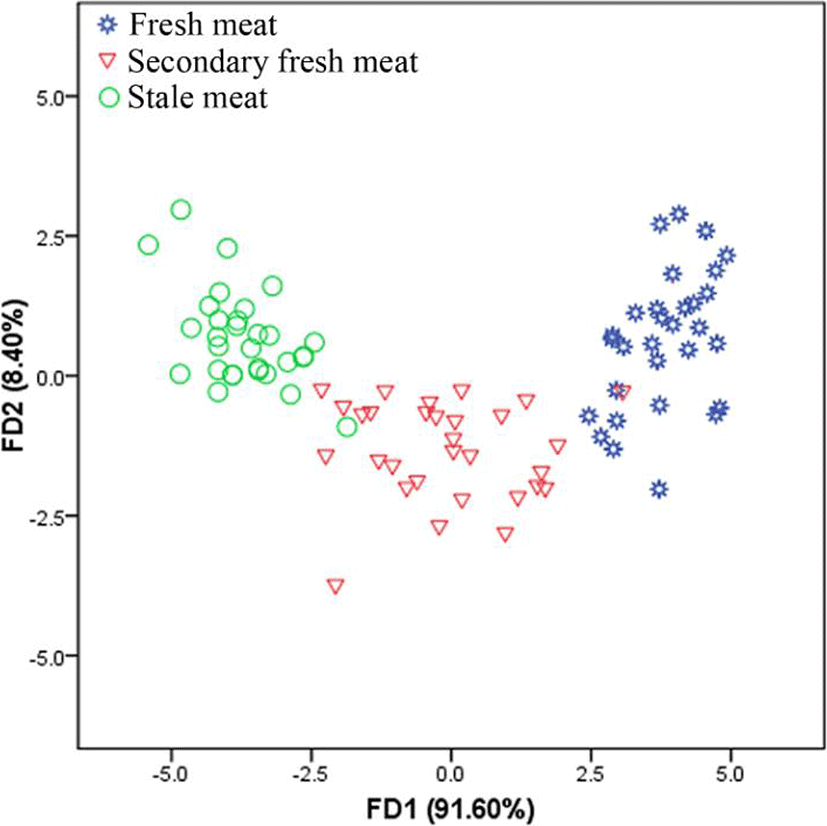
The transformation of three freshness data classes onto first two discriminant vectors was shown in Fig. 6. Observation from this figure reveals that the first FDA factor (FD1) explained 91.6% variance, and the second FDA factor (FD2) explained 8.4% variance, adding up to 100% of the data variance. As can be seen from this figure, three groups of hyperspectral microscopic images are separable, and all the samples gathered into three groups at the two dimensional FDs, except a few points overlapped among three groups. Above these indicated that it was feasible to use HMI system for discerning pork fresh degree and provided the basis for next actual classification in different algorithms.
The final five obtained variables from FDA were then used as the input of model setting. As result, total discrimination rates of LDA, BP-ANN and SVM were considerably high, with discrimination rate of 91.67%, 95.00% and 98.33% in the training set respectively, 93.33%, 100.00% and 93.33% in the prediction set respectively. The detail of results for these three models is showed in Table 1. Therefore, simple models with merely 5 variables were developed for the HMI system, which as a promising tool for sensing meat freshness.
a LDA model in the training set: one secondary fresh sample was misclassified as fresh meat, three secondary fresh samples were misclassified as stale meat, one stale sample was misclassified as secondary meat.
b LDA model in the prediction set: one secondary fresh sample was misclassified as fresh meat, one secondary fresh sample was misclassified as stale meat.
c BP-ANN model in the training set: one secondary fresh sample was misclassified as fresh meat, one secondary fresh sample was misclassified as stale meat, one stale sample was misclassified as secondary fresh meat.
Discussion
Generally, during storage period, the early changes of meat quality are in the microstructure. Thus, micro-tissue texture image of different spoilage degrees is always different, and this slight change could not be analyzed by previous technology. Simultaneously, components of pork were decomposed into many toxic small molecule components which often include these hydrogenous bonds that can be related to some absorption bands. Accordingly, in order to realize accurate discerning pork fresh degree, a novel HMI, was fabricated and employed to capture the tissue image and the spectral information of each pixel in the image simultaneously. To verifying the feasibility of this system, we selected characteristic variables by common effective ways and used these variables to setting classification models in different algorithm. All the classification models showed good performances, which further verified that it is feasible and reliable to discern fresh degree of pork qualitatively.
Compared to the present study, the classification result of HMI is better than the results of conventional HSI in classification (Pu et al., 2015; Qu et al., 2015; Sone et al., 2012). However, it was worth noting that there was still misclassification in the models. As observed in Fig. 6, there existed partial overlapping among the three groups. In other words, the spoilage process of different meat samples differ from each other, while some of them were not the ones of the defined group. A fraction of the overlapping maybe stem from environmental conditions, personal operation, and another fraction derived from inadequate or redundant variables probably. Therefore, the final discrimination rate was less than 100% due to the errors mentioned above.
Conclusion
This study was performed to fabricate a novel microscopic imaging system for discerning fresh degree of pork accurately, rapidly and non-destructively. As can be shown in this study, the discrimination rate of pork samples stored for different time can achieve as high as 100% through a serious of processing such as characteristic images extraction, textural variables selection and suitable algorithm application, indicating that it was possible to apply the developed HMI system to evaluate the fresh degree of pork. Furthermore, this novel system can also be applied to fresh degree evaluation of other kinds of meat such as chicken, fish and beef combing with appropriate chemometrics methods. Compared with traditional technologies, HMI system is a rapid, non-chemical, nondestructive and environment-friendly technology with low cost of price and is more suitable for real-time online monitoring of food quality in term of economic efficiency. Knowledge gained in this research could be incorporated in the food industry to promote the accuracy of meat fresh degree evaluation on micro level. However, further researches at industrial scale are required to facilitate its adoption.


