Introduction
Lipid oxidation is one of the major causes of quality deterioration in meat products such as off-flavor, discoloration, decrease in nutrition value, and reduction of shelf-life. Delaying lipid oxidation has become a major issue in the meat industry (Fernández-López et al., 2005). Generally, antioxidants have been used to prevent lipid oxidation and maintain qualities of meat (Jia et al., 2012) and synthetic antioxidants such as butylated hydroxytoluene (BHT) and butylated hydroxyanisole (BHA) have been used widely in the food industry. However, replacing synthetic antioxidants with natural antioxidants has been studied because of their potential toxicity (Formanek et al., 2001). Recently, using natural antioxidants from various plant sources have been studied in meat and meat products (Shah et al., 2014).
Soybeans (Glycine max) have been regarded as a nutritionally rich food resource. Recently, soybeans have been used as a forage crop and become an issue as functional health foods (Lee et al., 2013). Numerous studies have shown that soybeans contain not only various nutrients such as proteins, unsaturated fatty acids, and carbohydrate, but also abundant bioactive compounds, like vitamins, minerals, isoflavones, saponins, tocopherol, and phytic acid, which have antioxidant activities and synergistic effect with anthocyanins (Myung and Hwang, 2008; Wu et al., 1998).
Some soybean seed coats are colored with red, black, or brown soybeans. Black and brown soybeans are dark colored because of abundant anthocyanins. Anthocyanins are included in red, purple, and blue colored flavonoid pigments in the seed coats of colored soybeans (Choung et al., 2003). Anthocyanins have antioxidant and anti-inflammatory activities without side effect (Myung and Hwang, 2008). Previous research showed that ethanol extract of brown soybeans have high radical-scavenging activity in proportion to amount of total phenolic content and procyanidin (precursor of anthocyanin) (Takahata et al., 2001). Also, Takahashi et al. (2005) reported that colored soybeans have antioxidant effect because of anthocyanin contents. Thus, colored beans, including brown soybeans, have more radical-scavenging activity than less colored beans (Alkond et al., 2011). Bae and Moon (1997) reported that brown soybeans had higher antioxidant effects than yellow and black soybeans because of their high contents of phenolic and anthocyanin compounds. Thus, previous investigations have shown that brown soybeans are rich source of various phenolic and anthocyanin compounds. However, brown soybeans have not been researched as natural antioxidants in ethanol extract form to inhibit lipid oxidation in meat products.
Thus, the purpose of this study was to determine the antioxidant activity of ethanol extract of brown soybeans, depending on various ethanol concentration. Furthermore, we investigated the effects of brown soybean ethanol extracts in pork patties on pH, color, thiobarbituric acid reactive substances value, total plate count, and sensory property during refrigerated storage (4℃).
Materials and Methods
Brown soybeans were purchased from Yecheon (Korea). Brown soybeans were ground from local market (Korea). Then brown soybean powder (15 g) was extracted with 150 mL of distilled water, 50%, 75%, and 95% ethanol for 24 h in a shaker at room temperature. The extracts was filtered through filter papers (φ110 mm, Cat. No. 1001 110, Whatman International Ltd., England) and evaporated with a rotary evaporator (EYELA N-1000, RIKAKIKAI. Co. Ltd., Japan) below 50℃. After evaporation, brown soybean extracts were dissolved in distilled water, 50, 75, and 95% ethanol.
Extraction yield for each treatment was calculated by subtracting the dried weight of plant material residue after extraction from the weight of the original plant material.
The total phenol content was determined according to the Folin-Ciocalteu method of Slinkard and Singleton (1977). An aliquot of each extract was mixed with 4.5 mL of distilled water. Then 0.1 mL of Folin-Ciocalteu reagent (previously diluted 3-fold with distilled water) was added and mixed using a vortex mixer. After 5 min, 0.3 mL of 2% sodium carbonate solution was added. The mixture was allowed to stand for 2 h. The absorbance was measured at 760 nm.
The total flavonoid content of the samples was determined by a modified colorimetric method described by Myung and Hwang (2008) using quercetin as a standard. Extracts 1 mL were mixed with 4 mL of distilled water and 0.3 mL of 5% sodium nitrite (NaNO2) solution followed by the addition of 0.3 mL of 10% aluminum chloride (AlCl3) solution 5 min later. After 2 mL of 1 M sodium hydroxide (NaOH) and 2.4 mL distilled water was added. The solutions were mixed and absorbance was measured at 510 nm. The results were expressed in mg quercetin/g extract.
Determination of total anthocyanin component was measured according to a modification of the pH-differential methods (Hosseinian, 2008). Anthocyanin is reversible structural transformations with a change in pH. The oxonium (orange-purple) form predominates at pH 1.0 and the hemiketal (colorless) form at pH 4.5. The pH-differential method is based on this reaction, and rapid measurements for the total amount of anthocyanin. Sample (0.2 mL) was added to 1.8 mL of two buffers (one for pH 1.0 using potassium chloride buffer and the other for pH 4.5 using sodium acetate buffer). The absorbance of each sample was measured 520 nm and 700 nm against distilled water as blank. The concentration (mg/L) of each anthocyanin was calculated according to the following formula:
Total anthocyanin content (mg/L) = A × MW × DF × 103 / ε × 1
A (absorbance value) = (A520 nm − A700 nm)pH 1.0 − (A520 nm − A700 nm)pH 4.5
MW (molecular weight of cyanidin-3-glucoside) = 449.2
DF (dilution factor) = dilution ratio of sample
ε (cyanidin-3-glucoside molar absorbance) = 26,900 M−1 cm−1
The free radical scavenging activity of the brown soybean extract was measured using the modified method of Brand-Williams et al. (1995). Briefly, 1 mL of extracts at different concentrations (0.25-0.75 mg/mL) was mixed with 1 mL of a 2×10⁻⁴ M ethanolic DPPH solution. The reaction mixture was incubated in the dark for 20 min and the absorbance was measured at 517 nm with a UV-Vis spectrophotometer (Libra S22, Biochrom Ltd., UK). Percent of DPPH-scavenging activity was calculated according to the following equation:
Scavenging activity (%) = [(control absorbance − extract absorbance) / (control absorbance)] × 100
Fresh pork hams and back fat were purchased from local processor 48 h postmortem. Visible fat and connective tissues were trimmed off. Lean meat and fat were ground through φ-8 mm plate using meat grinder (PM-70, Mainca, Spain). The ground meat (65%) and fat (25%) were mixed in the bowl with water (10%), salt (1.5%), and then ascorbic acid (ASC) or brown soybean extract with 75% ethanol (pH, 6.22±0.02; L*-value, 40.05±2.39; a*-value, 24.88±1.09; b*-value, 25.32±0.84) were added according to the following formulation: CON (no antioxidant added); ASC-0.05 (0.05% ascorbic acid); BE-0.05 (0.05% brown soybean extract with 75% ethanol); BE-0.1 (0.1% brown soybean extract with 75% ethanol); BE-0.2 (0.2% brown soybean extract with 75% ethanol). Each mixed sample was divided into 5 portions and allocated to the 5 periods (0, 3, 7, 10 and 15 d). Samples weighed in petri dish (about 85 g) and cooked using water bath (VS-190W, Vision Scientific Co., Korea) until the core temperature reached 75℃ for 30 min (Du et al., 2001). The cooked pork patties were vacuum-packed in PE/Nylon film bags, stored at 4±1℃ for 15 d.
The pH values of cooked pork patties were determined with a pH meter (Model 340, Mettler-Toledo GmbH, Switzerland). The pH values of samples were measured by blending a 5 g sample with 20 mL distilled water for 30 s in a homogenizer at 8,000 rpm (Ultra-Turrax SK15, Janke & Kunkel, Germany).
Instrumental color were determined using a colorimeter (Minolta Chroma meter CR-210, Japan; illuminate C, calibrated with a white plate, CIE L*=+97.83, CIE a*=−0.43, CIE b*=+1.98). Five measurements for five locations on surface of cooked pork patties were taken. CIE L* (lightness), CIE a* (redness), and CIE b* (yellowness) values were recorded.
Lipid oxidation was assessed in triplicate using the TBARS method of Tarladgis et al. (1960) with minor modifications. A 10 g sample was blended with 50 mL of distilled water and 0.2 mL of butylated hydroxyl toluene (BHT) for 2 min and then transferred to a distillation tube. The cup used for blending was washed with an additional 47.5 mL of distilled water, which was added to the same distillation flask with 2.5 mL of 4 N HCl and a few drops of a silicone o/w antifoam agent (KMK-73, Shin-Etsu Silicone Co. Ltd., Korea). The mixture was distilled and 5 mL of the distillate was mixed with 0.02 M 2-thiobarbituric acid in 90% acetic acid (TBA reagent) in a vial. The vial were capped and heated in boiling water bath for 35 min to develop the chromogen and then cooled to room temperature. Absorbance was measured using a UV/VIS spectrophotometer (Optizen 2120 UV plus, Mecasys Co. Ltd., Korea) at 538 nm, against a blank prepared with 5 mL distilled water and 5 mL TBA-reagent. The TBA values were calculated as malondiadehyde (MDA) per kilogram of sample (mg MDA/kg meat). The formula was:
TBARS (MDA mg/meat kg) = (optical density of sample − optical density of blank) × 7.8
To determine the total aerobic bacterial count for each treatment, 10 g of the sample was aseptically transferred into a sterile stomacher bag and 90 mL of sterile 0.1% peptone water (Difco, USA) was added. The sample was then homogenized in stomacher (Masticater-Paddle-Blender, IUL Instrument, Spain) for 2 min at normal speed and serial dilutions of the homogenate were prepared with 0.1% peptone water. After serially diluting each sample, 0.1 mL aliquots were spread onto plates respectively. The total bacterial count was determined on plate count agar (PCA, Difco, USA) at 37℃ for 48 h. Microbial colonies were counted and expressed as Log CFU/g sample of pork patty.
Sensory evaluations were performed in duplicate on each pork patty by panelist. The samples were cut into quarters and served to the panels when samples were at room temperature. The pork patties were evaluated for color (1=extremely undesirable, 10=extremely desirable), flavor (1=extremely undesirable, 10=extremely desirable), off-flavor (1=extremely undesirable, 10=extremely desirable), and overall acceptability (1=extremely undesirable, 10=extremely desirable) using a 10 point descriptive scale. The panel consisted of 10 members from the Department of Food Sciences and Biotechnology of Animal Resources at Konkuk University in Korea.
All tests were done at least three times for each experimental condition and mean values were reported. The statistical analysis of all data was performed by SPSS Ver. 18.0 (SPSS Inc., USA). One-way ANOVA (one-way analysis of variance) and Duncan’s multiple range comparison were used to find the level of significant differences (p<0.05).
Results and Discussion
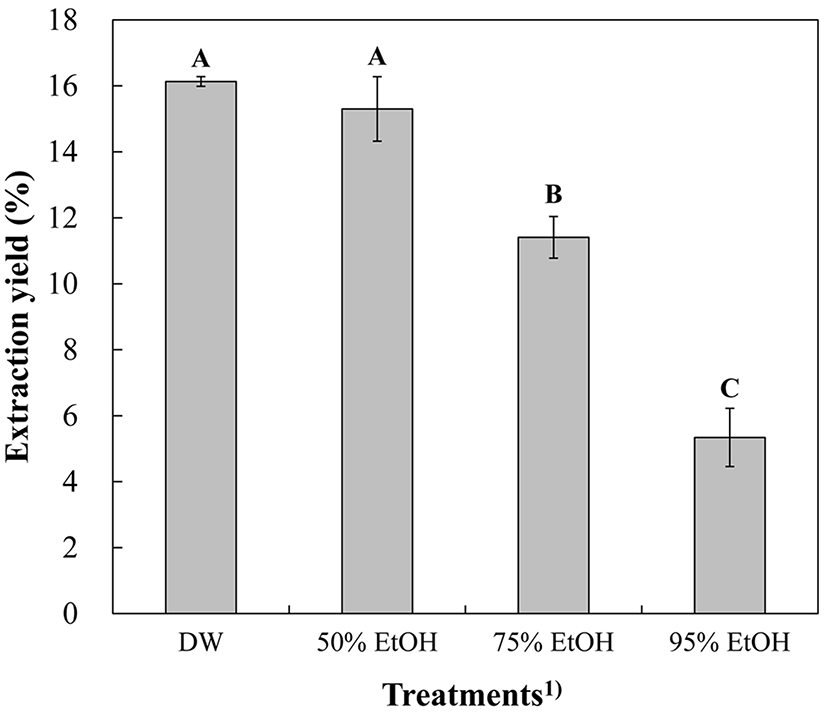
Extraction yield of brown soybean extracts with different levels of ethanol are shown in Fig. 1. The extraction yield of BE decreased as ethanol concentration increased. The 95% EtOH showed the lowest extraction yield (p<0.05). DW and 50% EtOH treatments showed significantly (p<0.05) higher extraction yields than 75% EtOH. Similarly, Lee et al. (2014) reported that extraction yield increased as ethanol concentration decreased. Kim et al. (1993) suggested that natural antioxidant extracted by diluted ethanol solution has higher extraction yield compared to that which was extracted by pure ethanol solution. Because antioxidant compounds in plant have different polarity and solubility (Sun and Ho, 2005), extraction solvent property may affect the extraction yield. Cacace and Mazza (2003) reported that different concentration of ethanol affects the physical properties of the solvent, and this may change the extraction yield of various bioactive compounds. Nonpolar covalent molecules can be dissolved less in low concentration ethanol solvent because the energy needed to breakdown the interaction between the water molecules.

The total phenol and flavonoid contents of BE extracted by different levels of ethanol are shown in Table 1. Total phenol content showed significant differences between the treatments. Especially, the 75% EtOH extract had significantly higher total phenolic contents than the other treatments (p<0.05). Lee et al. (2010) showed similar results that total phenol contents in ethanol extract of large deltoid sunurus (Synurus excelsus) and Chrysanthemum-leaf synurus (Synurus palmatopinnatifidus) were higher than those of distilled water extract.
All values are mean±standard deviation.
1)Treatments: DW, brown soybean extracted with distilled water; 50% EtOH, brown soybean extracted with 50% ethanol; 75% EtOH, brown soybean extracted with 75% ethanol; 95% EtOH, brown soybean extracted with 95% ethanol.
A-DMean sharing different letters are significantly different (p<0.05).
Flavonoids, including flavones, flavanones, isoflavones, flavonols and anthocyanidins, have antioxidant activity in food system. In particular, legumes, such as soybean, colored beans, and chick peas contain abundant flavonoids (Pietta, 2000). Total flavonoid contents of the 95% EtOH were significantly higher than the other treatments (p<0.05), followed by 75%, 50% EtOH and DW. Total flavonoid contents were higher in ethanolic extract than distilled water extract, similarly to the total phenol contents.
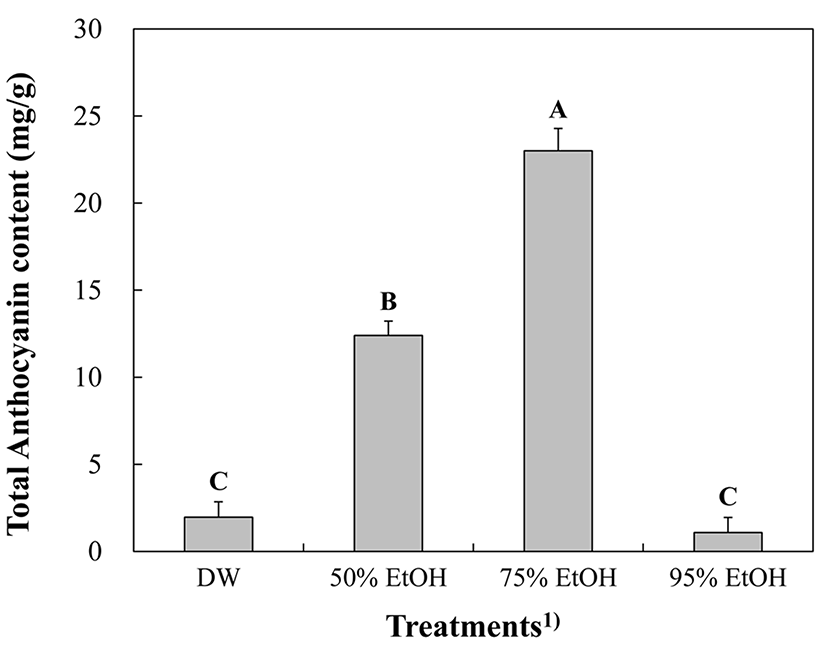
Total anthocyanin contents in BE extracted by different levels of ethanol are presented in Fig. 2. The 75% EtOH showed the highest content of anthocyanin (p<0.05), followed by 50% EtOH, DW and 95% EtOH. According to Kim et al. (2014), 60-75% ethanol was more effective extract solvent than other concentrations of ethanol. These differences were reported that anthocyanins were influenced by chemical structure and pH (Choung et al., 2008). Also, polymerized anthocyanin and non-enzymatic browning pigments were excluded from the calculation because these compounds do not exhibit reversible behavior with pH (Wrolstad et al., 2005). Similarly, Kim et al. (2008) suggested that the efficient extraction solvent for anthocyanin was 60-80% methanol.

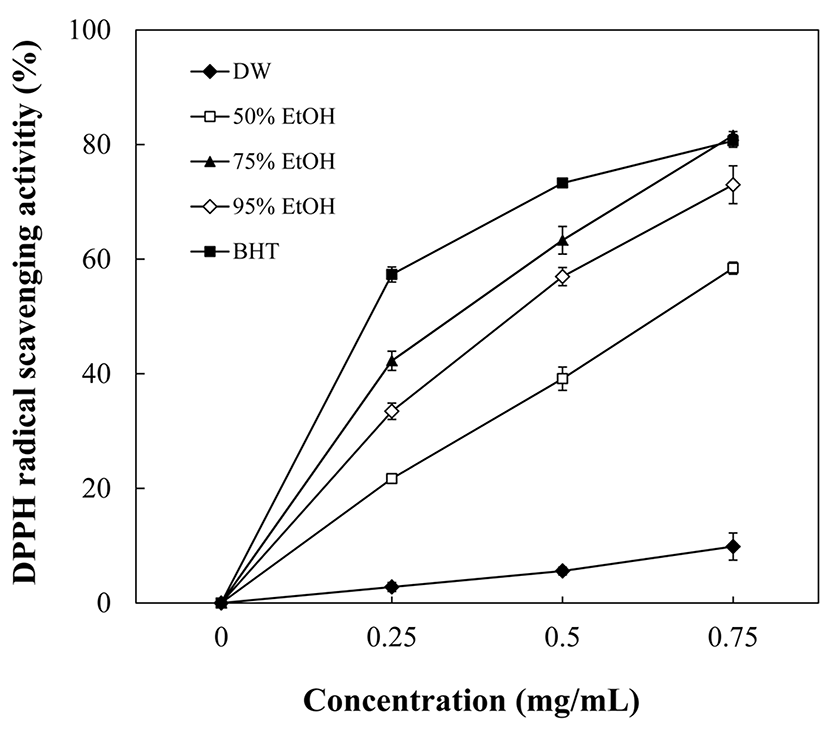
DPPH radical scavenging activity of BE are shown in Fig. 3. As extract solvent (ethanol) concentration increased, DPPH radical-scavenging activity increased and the BE extracted by 75% ethanol showed the highest DPPH radical-scavenging activity among the treatments (p<0.05). Jun et al. (2014) reported that a mixed solvent was more efficient for extracting antioxidant compounds compared to a pure solvent. Additionally, natural antioxidant compounds, such as isoflavones and phenol compounds, are extracted better by 70-80% ethanol (Bae et al., 1997). In this study, 75% ethanol is considered as the most effective solvent to extract antioxidant compounds. The most amount of anthocyanin and total phenol contents in 75% EtOH may have accounted for the highest DPPH radicalscavenging activity. The result of anthocyanin content analysis showed that 75% EtOH presented the highest amount of anthocyanin among the treatments (Fig. 2). In previous study, the high content of anthocyanin in soybeans was shown to possess strong antioxidant activity (Alkond et al., 2011). Kim et al. (2009) reported that DPPH radical-scavenging activity was correlated with polyphenol content which is abundant in soybean. Phenolic compounds act as a reductant reacting with free radicals to make stable products and terminate free radical chain reactions (Neci and Jayaprakasha, 2003).

Experiment 1 showed that brown soybean extract with 75% ethanol has the highest antioxidant activity. The high content of anthocyanin and phenol compounds in 75% EtOH were assumed to play an important role in scavenging free radicals. Thus, addition of brown soybean extract with 75% ethanol was expected to be effective for retard lipid oxidation as a natural antioxidant on pork patties.
The pH values of pork patties with BE during refrigerated storage are shown in Table 2. The pH values of pork patties were decreased significantly as storage time increased (p<0.05). Similar results were found by Song et al. (1997), who revealed that dissociation of CO2 in muscle tissue can cause decreases in pH during storage. The pH values of pork patties showed significant differences with addition of BE or ascorbic acid. The pH values of pork patties with 0.2% BE were significantly higher than the other treatments during refrigerated storage (p<0.05). This result may be attributed to the pH of brown soybean extract (6.22±0.02).
All values are mean±standard deviation.
1)Treatments: CON, pork patty without brown soybean extract; ASC-0.05, pork patty with added 0.05% ascorbic acid; BE-0.05, pork patty with added 0.05% brown soybean extract; BE-0.1, pork patty with added 0.1% brown soybean extract; BE-0.2, pork patty with added 0.2% brown soybean extract.
A-EMeans within a column with different letters are significantly different (p<0.05).
a-dMeans within a row with different letters are significantly different (p<0.05).
The results of color measurements of pork patties formulated with BE during 15 d storage are shown in Table 3. Lightness (CIE L*-value) of pork patties with BE was significantly lower than CON and ASC-0.05 treatments (p<0.05). The redness (CIE a*-value) of sample that BE added was significantly higher than with ASC-0.05 (p<0.05). Also, the lightness of the pork patties decreased during refrigerated storage for 15 d, whereas the redness increased. These results may be due to red-brown color of BE. Similarly, plum extracts increased redness and decreased lightness in turkey breast during storage because of the original dark purple color (Lee and Ahn, 2005). The yellowness (CIE b*-value) of pork patties was not affected by BE. Similarly, Lee et al. (2009) reported that the lightness of anthocyanin in black soybeans was decreased and the yellowness was almost unchanged as heating temperature and time increased. Chen et al. (1999) reported that the addition of colored natural antioxidant affected the meat color. These results showed that anthocyanins in BE affected the color of cooked pork patties during refrigerated storage.
All values are mean±standard deviation.
1)Treatments: CON, pork patty without brown soybean extract; ASC-0.05, pork patty with added 0.05% ascorbic acid; BE-0.05, pork patty with added 0.05% brown soybean extract; BE-0.1, pork patty with added 0.1% brown soybean extract; BE-0.2, pork patty with added 0.2% brown soybean extract.
2)Traits: CIE L*, Lightness; CIE a*, redness; CIE b*, yellowness.
A-CMeans within a column with different letters are significantly different (p<0.05).
a-dMeans within a row with different letters are significantly different (p<0.05).
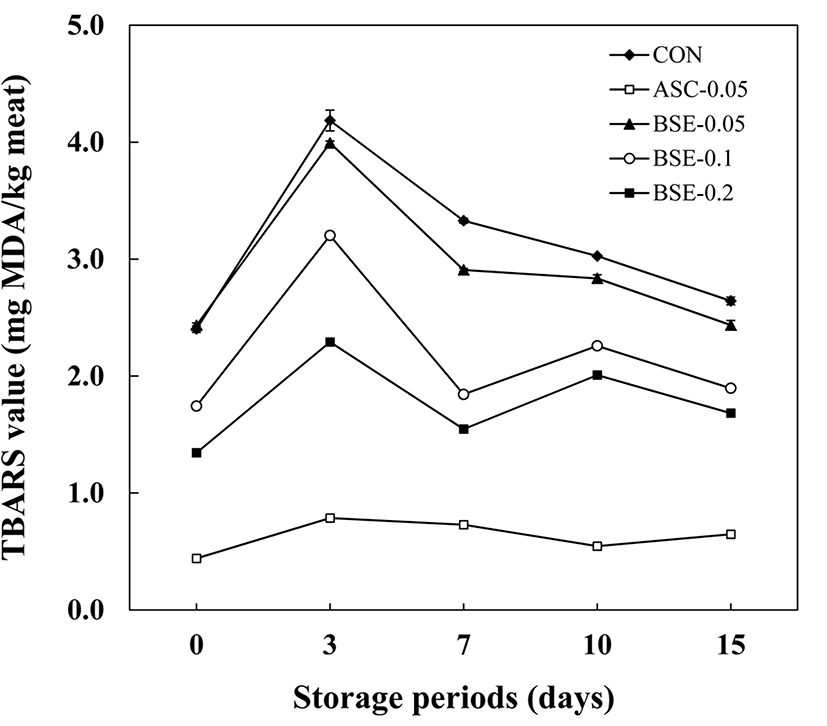
The results of TBARS analysis to determine lipid oxidation of pork patties for 0, 3, 7, 10, and 15 d are shown in Fig. 4. The TBARS values of pork patties with BE were considerably lower than CON during storage (p<0.05), except BE-0.05 (p>0.05). This result indicates that BE above 0.05% inhibited lipid oxidation in pork patties during storage period. The ability of BE to delay lipid oxidation must be related to high free radical scavenging activity on account of abundant total phenols, flavonoids, and anthocyanins contents. In accordance with the result, previous studies reported that extracts of colored soybeans have high DPPH radical-scavenging activity due to procyanidins and it delayed the formation of MDA in meat products (Jayawardana et al., 2011; Takahata et al., 2001). Besides, BE possess various bioactive compounds such as isoflavones, tocopherols, phenolic acids, and anthocyanins (Kim et al., 2005). According to Naveena et al. (2008), anthocyanins and phenolic compounds in pomegranate extract significantly reduced TBARS values of chicken patties during refrigerated storage. Among the treatments, ASC-0.05 showed the lowest TBARS values during refrigerated storage (p<0.05). It has been reported that ascorbic acid inhibited lipid oxidation by reducing superoxide, H2O2, and hydroxyl radicals (Sarma et al., 1997). The TBARS values of all treatments increased at day 3, then began to decrease over the storage period. Min and Ahn (2005) noted that lipid oxidation could be accelerated by any process such as grinding, mincing, and cooking at the beginning of storage. Increase of TBARS values at day 3 may be related to the initial processing of pork patties. It is assumed that decline of TBARS values of samples after day 3 was attributed to a decomposition of malondialdehyde (MDA). Fernandez et al. (1997) revealed that MDA and other short-chain carbon products of lipid oxidation are not stable because these products can be decomposed to organic alcohols and acids during storage.

Total plate count of pork patties was not detected (<1 Log CFU/g) during refrigerated storage (data not shown). Cold storage, cooking process, and vacuum-packaging are assumed that have inhibited a growth of aerobic bacteria in the samples. According to Biswas et al. (2004), changes in storage temperature reduce the survival rate of microbes, and cooking process drastically injures and/or kills psychrotrophic bacteria. Also, vacuum packaging inhibits microbial growth in meat more than other packaging methods (Seydim et al., 2006). Additionally, Viskelis et al. (2009) reported that anthocyanin has antimicrobial activity against Bacillus cereus, Micrococcus luteus, and Listeria monocytogenes in food.
Sensory properties of pork patties with BE are shown in Table 4. Regarding color, the pork patties with BE treatments received significantly higher score than CON (p<0.05). This result was probably due to red-brown color of BE added to pork patties. In addition, color of pork patties decreased significantly during storage except BE-0.2 (p<0.05). The flavor score of BE-0.2 was significantly lower than other treatments (p<0.05). Youn et al. (2014) reported that increasing an addition level of agent may cause lower score of flavor. The flavor of the pork patties was not changed apparently during refrigerated storage. The off-flavor score of the pork patties showed significant differences between the treatments. Pork patties with antioxidant had significantly higher off-flavor scores than pork patties without antioxidant during refrigerated storage (p<0.05). This result indicates that ascorbic acid and brown soybean extract which were added into pork patties inhibited off-flavor generation by delaying lipid oxidation. The overall acceptability score of the pork patties differed significantly among the treatments (p<0.05). ASC-0.05 and BE-0.1 had significantly higher overall acceptability score than the other treatments during storage period (p<0.05). These results were agreed a with Resurreccion (2003) that reported the appearance and flavor influenced consumer overall acceptability of meat.
All values are mean±standard deviation.
1)Treatments: CON, pork patty without brown soybean extract; ASC-0.05, pork patty with added 0.05% ascorbic acid; BE-0.05, pork patty with added 0.05% brown soybean extract; BE-0.1, pork patty with added 0.1% brown soybean extract; BE-0.2, pork patty with added 0.2% brown soybean extract.
2)Traits: color (1=extremely undesirable, 10=extremely desirable), flavor (1=extremely undesirable, 10=extremely desirable), off-flavor (1=extremely undesirable, 10=extremely desirable), and overall acceptability (1=extremely undesirable, 10=extremely desirable).
A-DMeans within a column with different letters are significantly different (p<0.05).
a-cMeans within a row with different letters are significantly different (p<0.05).
Conclusion
In the present study, 75% EtOH had significantly higher DPPH radical-scavenging activity than other gradient ethanol solvent. Also, 75% EtOH had higher estimated contents of phenols and anthocyanins. Addition of BE inhibited lipid oxidation throughout refrigerated storage and affected the redness of pork patties. These results suggest that 0.1% BE can be used as a natural antioxidant that improves shelf-life of meat and meat products during storage.


