


Introduction
Tomatoes are known to contain various bioactive compounds with a number of beneficial health functions, such as antibiotic, anti-inflammatory, anti-oxidative, cardiovascular, and immunomodulatory functions (Freidman, 2013). The health benefits of tomatoes are mainly due to their bioactive carotenoid pigments, including lycopene, β-carotene, and -tomatine (Chanforan et al., 2012). The major functional component presented in tomato is lycopene. It has been reported that tomato contains about 80% of dietary lycopene found in nature (Nguyen and Schwartz, 1999). Besides, as an anticarcinogenic agent, lycopene has many other health benefits (Zhang et al., 2014). Therefore, considerable research works have been undertaken to utilize lycopene in food products (Sesso et al., 2003). Thus, incorporating lycopene into cheeses could be a novel strategy to better utilize the benefits of lycopene for human health. However, lycopene is too sensitive to heat, moisture, pH, and other environmental conditions. Accordingly, an effective technique, such as microencapsulation of lycopene, is needed to ensure its proper delivery and activity.
Microencapsulation is a process of packaging active functional ingredients within a structure to protect the ingredients against adverse environmental conditions and deliver it to appropriate site of the human body after ingestion (Onwulata, 2013). Microencapsulation can reduce off-flavors produced by certain vitamins and minerals, permit time release of nutrients, enhance stability to extreme temperature and moisture, and reduce the reactivity of nutrient with other ingredients (Dziezak, 1988; Pszczola, 1998). Effective utilization of microencapsulated functional ingredients into vehicle largely depends on the choice of coating material (Devos et al., 2010; Parada and Aguilera, 2007). Omega-3 oils have been microencapsulated to minimize oxidative deterioration and allow their use in a stable and easy-to handle form by complex coacervation and spray-dried emulsion (Kaushik et al., 2014). Bifidobacterium longum has also been microencapsulated to ensure its survival in Cheddar cheese during long time storage (Amine et al., 2014). Lipase has been encapsulated with K-carrageenan to accelerate the ripening of Kashar cheese (Akin et al., 2012). As a functional ingredient, peanut sprout has been microencapsulated with medium-chain triglyceride and whey protein concentrate as primary and secondary coating materials, respectively. After spray-dry, these microcapsules have been added into yogurt (Lee et al., 2013).
Appenzeller is a semi-hard cheese produced in the northeastern region of Switzerland. The specialty of this cheese is that the use of herbal brine made of alpine herbs macerated in alcohol can give it a spicy taste (Kessier et al., 1990). Apart from the special flavor content of Appenzeller cheese, adding functional ingredients can be of special interest to improve its health benefits to consemers. However, there is little information about lycopene-enriched tomato concentrates as functional Appenzeller cheese. Therefore, the main objectives of this study were: (1) to develop Appenzeller cheese supplemented with powdered microcapsules of tomato extracts (PMT), and (2) to determine the physicochemical and sensory properties of such products.
Materials and Methods
Tomato extracts containing 6% lycopene (Lyco-O-Mato) was supplied by Lycored Ltd (Israel). Medium-chain triglyceride (MCT) was purchased from Wellga Co., Ltd. (Korea). As coating material, maltodextrin (DE 18, Samyang Genex, Korea) was used. As an emulsifier, Tween 60 (HLB 14.9) was purchased from Il-Sin Co., Ltd. (Korea). Kazu 300 as a mesophilic aromatic culture of freeze-dried lactic culture was used for direct vat set starter culture (Flora Danica, Chr. Hansen’s Lab., Denmark). Naturen Calf Rennet (Double strength 290622104) was purchased from Chr. Hansen’s Lab. (Denmark) to make Appenzeller cheese. All chemicals were of reagent grade unless otherwise specified.
To produce a core material, the ratio of 1:9 (w/w) of tomato extract to MCT was combined in distilled water, stirred at 500 rpm for 3 h, and filtered through a filter paper (Whatman No. 4). To prepare coating material, 30% (w/v) maltodextrin was dissolved in distilled water. The coating material and emulsifier 0.92% Tween 60 were mixed for 30 min with a magnetic stirrer at 400 rpm. The core material was gradually added to the coating material-mixed solution to make a 1:8 (v/v) ratio of core to coating materials with a high speed homogenizer (SSC 1811EA, Matsushida Electronic Industrial Co., Ltd., Japan) at 10,000 rpm for 3 min.
To produce PMT, the emulsion was spray-dried using a pneumatic spray (biphasic) nozzle atomizer (Eyela SD-1000, drying capacity 1,500 mL/h; Tokyo Rikakikai Co., Ltd., Japan) with controlled inlet- and outlet-temperatures, feed rate, and inlet air volume. In this dryer, the emulsion was fed by a peristaltic pump and sprayed into the drying chamber at a 100 kPa atomization pressure. Inlet- and outlet-air temperatures of the spray dryer were fixed at 190 and 90℃, respectively. Cyclone was used to separate the PMT prepared with the emulsion from the air-powder mix. PMT was prepared in duplicates.
PMT was mounted onto a brass stub (10 mm in diameter) using two-sided adhesive tape. The stub surface was gently with a hand-held blower to remove unattached powders. Electrically conductive specimens were then made by coating under an argon atmosphere with a thin layer (approximately 30 nm in thickness) of platinum-palladium (8:2). These specimens were examined with a SEM (Hitachi S-4700, Japan) operated at an accelerating voltage of 15 kV.
Particles size distribution of PMT was determined by a particle size analyzer (Mastersizer 2000, Malvern Instruments Ltd., UK) which employed laser diffraction for size measurement. Briefly, the sample was combined with 10 mL of deionized water at a ratio of 1:400 (w/v) and mixed with a magnetic stirrer at 25℃. The suspension was poured into a cuvette and its particle size was measured at room temperature with fixed scattering angle of 165°. All samples were measured in triplicates. The mean particle size and distribution span were calculated based on a volume median diameter.
Appenzeller cheese was prepared using the method described by Kessier et al. (1990) and Heo et al. (2006). Briefly, raw milk (150 kg) was diluted with 10% tap water and pasteurized at 63℃ for 30 min. It was then cooled to 32℃ and mixed with starter culture containing Lactococcus lactis subsp. cremoris, Lactococcus lactis subsp. diacetylactis and Leuconostoc mesenteroides subsp. cremoris (0.75% Kazu, 0.75% Flora Danica) with the addition of 0.02% CaCl2 to milk. After 40 min, 0.02% (19 mL) of rennet was added to the milk and stood for 25 min. After coagulating, curds were cut to 5 mm, and stirred at 32℃ for 20 min. Whey (10% of the volume of the milk) was partially removed and replaced by an equal volume of 10% hot water (72℃) and cooked at 38℃ for 30 min. The curd-whey mixture was stirred for 60 min at the cooking temperature. After draining, different concentrations (0, 1, 2, 3 and 4%, w/w) of PMT were evenly added to curds and poured into round-shaped molds for pressing. Curds were pressed at 5 times of the curd weight overnight at 26℃. After pressing, fresh cheeses were brined in 20% brine solution for 4 h. After draining-off the brine and drying the cheeses during 2 d, they were ripened at 14℃ for 6 mon with a relative humidity of 90-94%. Samples for analysis were periodically taken at 0, 1, 2, 3, 4, 5 and 6 mon of ripening. Both the control and Appenzeller cheese supplemented with different concentrations (0, 1, 2, 3, and 4%, w/w) were made in duplicates.
Cheese samples were analyzed for moisture, fat (Gerber method), and protein (Kjeldahl method) contents using the methods of the Association of Official Analytical Chemists (2000). All samples were measured in triplicates.
Well ground PMT-added Appenzeller cheese sample (1 g) was removed periodically after 0, 1, 2, 3, 4, 5 and 6 mon of ripening, extracted with extraction buffer (5 mL of diethyl ether, 2.5 g of sodium sulfate and 0.1 mL of 4 N H2SO4) for 2 h, eluted through a 10 mm i.d. glass column containing 1 g of deactivated alumina (alumina oxide neutral), and deactivated with 0.24% distilled water as described by Kwak et al. (1990). Gas chromatograph (DS 6200, Donam Instruments Inc., Korea) equipped with a flame ionization detector was used for short chain free fatty acid analysis. The separation of short-chain free fatty acid was achieved using a 30 m × 0.25 m inner diameter NuckolTM J&W D13-Wax column (Supelco., USA). Gas chromatograph was operated with nitrogen carrier gas at 30 mL/min, hydrogen gas at 60 mL/min, and air at 360 mL/min. The column oven was programmed to have an initial holding for 1 min at 50℃, heating to 225℃ at 25℃/min for 10 min, and holding for 20 min. Temperatures for the injector and the detector were 240 and 260℃, respectively. All quantitative analyses were performed by relating each peak area of tridecanoic acid as an interval standard. Each short-chain free fatty acid was identified by comparing its retention time to that of a standard. All experiments were performed in triplicates.
Agar powder was combined with MRS broth (Difco Laboratores, USA) and 0.004% bromophenol blue to determine lactic acid bacteria counts. One gram of cheese sample was dispersed in 9 mL of 2% sodium citrate and homogenized at 1,500 rpm for 1 min. One milliliter of prepared sample was diluted with 9 mL of sterile 0.8% NaCl. Subsequent dilutions of each sample were plated in triplicates and incubated at 37℃ for 48 h.
Texture profiles of cheese samples were measured using a TMS-Pro Texture Analyzer (Food Technology Co., Sterling, USA) with a crosshead speed of 5 cm/min and a chart record speed of 10 cm/min. Cube-shaped samples (1.5 cm3) were prepared. From these curves, the basic characteristics of texture profiles, such as hardness, cohesiveness, gumminess, springiness and chewiness, were obtained according to the method of Kanawjia et al. (1995). The point of the greatest force during the first compression was the hardness. The extent to which the sample returned to its shape between the first and second compressions was the elasticity. The ratio of the area under the second compression curve was the cohesiveness. Gumminess and chewiness were calculated as hardness × cohesiveness and gumminess × elasicity, respectively. All samples were measured in triplicate.
Color analysis was conducted based on the method described in Perkins-Veazie et al. (2001). Color values were compared between the control and PMT-added Appenzeller cheese using Minolta (Colourimeter CT-310, Japan) after calibrating its original value with a standard plate. Measured L*, a* and b* values were used as indicators of lightness, redness and yellowness, respectively. All samples were measured ten times.
Sensory characteristics of each cheese were studied using quantitative descriptive analysis by a panel of ten selected and trained assessors. Panel was composed of experienced ten panelists from the academic staff working in the Food Technology Department, Sejong University. Panelists were trained using the Spectrum method (Sensory Spectrum, USA). Panel evaluated cheese in terms of appearance, flavor, texture, and taste properties during ripening. The panel was trained 1 h before each evaluation session. Sensory terms for flavor-aroma and texture of cheese were introduced to panelists. Samples were served with a glass of water and an unsalted cracker to the panelists after samples were left at the room temperature for 10 min. Samples were presented to panelists in 3 digit-coded glass plates at the same time in each session. Sensory evaluation of samples in each analysis period was carried out twice. The scale of appearance, flavor, taste and texture was as follows: 1 = very week, 4 = moderate, 7 = very strong.
All statistical analyses were performed using SAS version 9.0 (SAS Institute, USA). Analysis of variance (ANOVA) was performed using general linear model procedure to determine significant differences among samples. Means were compared using Duncan’s multiple range test (p<0.05).
Results and Discussion
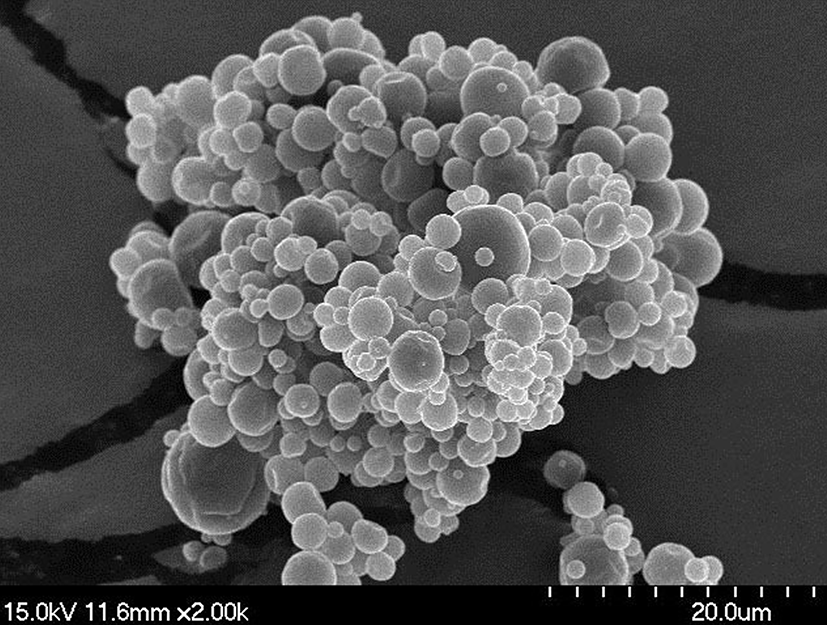
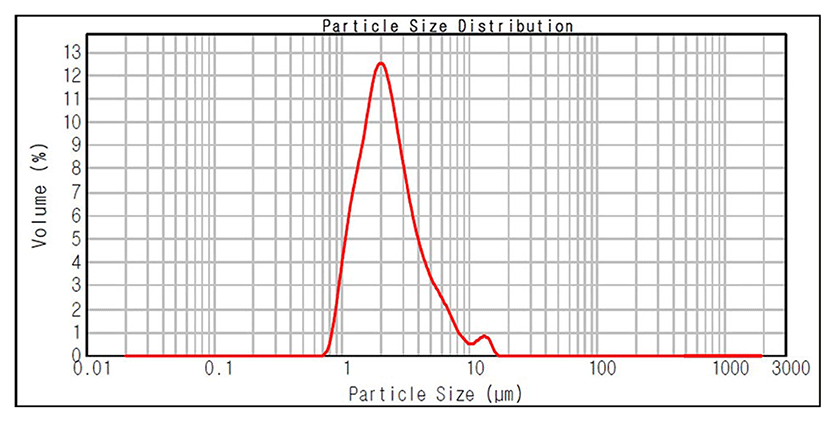
SEM morphology of PMT is shown in Fig. 1. These images revealed that the spray-dried microcapsule formed aggregation with smooth surface and regular spherical shape. The particle sizes of PMT ranged from 1 to 10 m in diameter, with an average particle size of about 2 m (Fig. 2). Ersus and Yurdagel (2007) reported that morphology of the microcapsules coated with MD showed smooth surfaces and spherical shapes. Fang and Bhandari (2010) reported that the typical form of encapsulated particles by spray drying was an average size of 10-100 μm. Therefore, this study determined that sufficient small size of powdered microcapsulations was made from MD.
Chemical compositions (fat, protein, and moisture) of various concentrations (1, 2, 3, and 4%, w/w) of PMT-added Appenzeller cheese at 0 mon of ripening (the initial values) are summarized in Table 1. The control cheese had 33.92% fat, 25.84% protein, and 36.56% moisture. Fat, protein, and moisture contents of the control were not significantly different from those of Appenzeller cheese supplemented with PMT (p<0.05), indicating that the addition (1-4%) of PMT did not considerably influence the chemical compositions of Appenzeller cheese.
All values are mean±standard deviation (n=3).
1)Powdered microencapsules of tomato extracts-added Appenzeller cheese.
2)Control, Appenzeller cheese.
It is well known that the production of short-chain free fatty acids (C4 through C10) is important for cheese ripening (Lin and Jeon, 1987). Short-chain free fatty acids contribute directly to cheese flavor, and provide desirable piquant flavor and aroma in many cheeses (Kwak et al., 1990). In the present study, the production of short-chain free fatty acids in Appenzeller cheese supplemented with PMT during ripening at 14℃ for 6 mon is shown in Table 2. The release of C4 and C10 were mainly contributed to the increase in total level of all cheese samples. The production of all short-chain free fatty acids in the cheese increased significantly and gradually during the ripening of 6 mon (p<0.05). According to Juan et al. (2015), the amount of short-chain free fatty acids gradually in most cheese during storage due to lipolysis. In this study, it was found that there were significant differences between the control and 4% (w/w) PMT-added Appenzeller cheese in total amounts and individual amounts of short-chain free fatty acids after ripening of 6 mon (p<0.05). These results indicated that the supplementation of 4% (w/w) PMT into Appenzeller cheese could remarkably influence the production of short-chain free fatty acid during ripening.
All values are mean±standard deviation (n=3).
1)Powdered microencapsules of tomato extracts-added Appenzeller cheese.
2)Control, Appenzeller cheese.
3)Means with different superscripts in a column (A-K) and row (a-c) are significantly different (p<0.05).
Lactic acid bacteria counts of Appenzeller cheese supplemented with PMT ripened at 14℃ for 6 mon are shown in Table 3. Lactic acid bacteria counts of the cheese were not significantly influenced by the ripening time from 0 to 6 mon or the concentrations (0-4%, w/w) of PMT (p<0.05). Based on these results, adding PMT (0-4%, w/w) to the cheese did not considerably affect the growth of lactic acid bacteria during ripening.
All values are mean±standard deviation (n=3).
1)Powdered microencapsules of tomato extracts- added Appenzeller cheese.
2)Control, Appenzeller cheese.
3)Means with different superscripts in a column (A) and row (a) are significantly different (p<0.05).
Textural properties of different concentrations (1, 2, 3, and 4%, w/w) of PMT-added Appenzella cheese samples ripened at 14℃ during 6 mon are presented in Table 4. Hardness values of all cheese samples proportionally were elevated during the 6 mon of ripening. After 6 mon of ripening, the hardness values of Appenzella cheese supplemented with 4% PMT were significantly higher than that of the control (p<0.05), indicating that more PMT might have absorbed less moisture from cheeses and make it harder. The gumminess and chewiness values also showed the same increasing trends as hardness values. However, in the cohesiveness scores, PMT-added Appenzella cheese samples showed decreasing trends when the concentrations of PMT were increased. The springiness values of the control and PMT-added Appenzella cheese samples were not significantly changed during the ripening time or increasing level of PMT (p<0.05). Therefore, we suggested that the supplementation of PMT could affect the textural properties of Appenzella cheese.
All values are mean±standard deviation (n=3).
1)Powdered microencapsules of tomato extracts- added Appenzeller cheese.
2)Control, Appenzeller cheese.
3)Means with different superscripts in a column (A-L) are significantly different (p<0.05).
Table 5 presents changes in color values of Appenzella cheese supplemented with different concentrations (1, 2, 3, and 4%, w/w) of PMT ripened at 14℃ for 6 mon. The L* values were significantly decreased when ripening time was increased from 0 to 6 mon. However, the L* values were not significantly influenced by the concentrations of PMT (p<0.05). The a* values were significantly increased with an increasing ripening period, and increasing the concentrations from 0 to 4% (w/w) in cheese significantly reduced the a* values (p<0.05). The b* values of Appenzella cheese supplemented with PMT (1-4%, w/w) at the final day of ripening were significantly higher than those of the control cheese. However, they were not significantly influenced by the concentrations of PMT (p<0.05). PMT is normally light yellow. This study revealed that the b* values could be increased when PMT was supplemented to produce the cheese.
All values are mean±standard deviation (n=10).
1)Powdered microencapsules of tomato extracts-added Appenzeller cheese.
2)Control, Appenzeller cheese.
3)Means with different superscripts in a column (A-L) are significantly different (p<0.05).
The sensory attributes of the different concentrations (1, 2, 3, and 4%, w/w) of PMT-added Appenzeller cheese ripened at 14℃ for 6 mon are shown in Table 6. The yellowness values were increased significantly after the supplementation of PMT (1-4%, w/w) due to the yellow color of PMT (p<0.05). In addition, the yellowness values were increased after increasing the ripening time due to the decreases in moisture contents of the cheese samples. In flavor aspects, butyric off-flavor and musty flavor of the control were not significantly different from those of PMT-added Appenzeller cheese after 6 mon ripening period (p<0.05). Tomato flavor increased significantly and proportionally with the concentrations of PMT added and with the ripening periods due to decreases in moisture (p<0.05). The flavors of all samples and control were improved with ripening time. Metabolic processes are responsible for the basic flavor and texture changes during ripening (Kanawjia et al., 1995). For the taste of these cheese samples, bitterness and sourness were not significantly changed after the supplementation of PMT (p<0.05). Bitterness is usually produced by peptides degraded during ripening (Kanawjia et al., 1995). However, sweetness of these cheese samples was significantly increased with increasing ripening time and concentration from 1 to 4% (w/w) (p<0.05). Regarding the texture property, the hardness of cheese was increased with the elevation in ripening time and the concentrations of PMT due to decreases in moisture and chemical reaction during ripening. Giroux et al. (2013) reported that hardness of Cheddar cheese increased by adding green tea extracts. Based on the results of this study, it is applicable to develop PMT-added functional Appenzeller cheese with 1-4% (w/w) PMT.
All values are mean±standard deviation (n=2).
1)Powdered microcapsules of tomato extracts-added Appenzeller cheese.
2)Control, Appenzeller cheese.
3)Means with different superscripts in a column (A-Q) are significantly different (p<0.05).
Conclusion
The present study was performed to elucidate the physicochemical, microbial, and sensory properties of Appenzella cheese supplemented with PMT during ripening of 6 mon. The increase in the concentrations of PMT addition influenced the amounts of short-chain fatty acid, texture and sensory properties of Appenzella cheese. The total amounts of short-chain fatty acids were gradually increased during the ripening periods, irrespective of treatments. Texture and sensory properties of Appenzella cheese supplemented with the concentrations (1-4%, w/w) of PMT were quite acceptable. Therefore, PMT could be successfully used in the production of functional Appenzella cheese without altering its physicochemical or sensory properties during the ripening periods of 6 mon. Moreover, PMT could improve the value of Appenzella cheese with functional properties. Thus, it could be used to produce functional cheese products with health beneficial activities. This will also give ways to produce many functional cheeses in different dairy sectors.